Separation Science and Technology
Publication details, including instructions for authors and subscription information:
http://www.tandfonline.com/loi/lsst20
Effect of Filtration Velocity and Filtration Pressure
Drop on the Bag-Cleaning Performance of a Pulse-Jet
Baghouse
CHUEN -JINN TSAI a , MING -LUN TSAI a & HSIN -CHUNG LU b
a
INSTITUTE OF ENVIRONMENTAL ENGINEERING, NATIONAL CHIAO TUNG UNIVERSITY , HSIN CHU, TAIWAN, REPUBLIC OF CHINA
b
DEPARTMENT OF ENVIRONMENTAL ENGINEERING HEALTH , HUNG KUANG INSTITUTE OF TECHNOLOGY , SHA-LU, TAICHUNG , TAIWAN, REPUBLIC OF CHINA
Published online: 15 Feb 2007.
To cite this article: CHUEN -JINN TSAI , MING -LUN TSAI & HSIN -CHUNG LU (2000) Effect of Filtration Velocity and Filtration Pressure Drop on the Bag-Cleaning Performance of a Pulse-Jet Baghouse, Separation Science and Technology, 35:2, 211-226, DOI: 10.1081/SS-100100152
To link to this article: http://dx.doi.org/10.1081/SS-100100152
PLEASE SCROLL DOWN FOR ARTICLE
Taylor & Francis makes every effort to ensure the accuracy of all the information (the “Content”) contained in the publications on our platform. However, Taylor & Francis, our agents, and our licensors make no
representations or warranties whatsoever as to the accuracy, completeness, or suitability for any purpose of the Content. Any opinions and views expressed in this publication are the opinions and views of the authors, and are not the views of or endorsed by Taylor & Francis. The accuracy of the Content should not be relied upon and should be independently verified with primary sources of information. Taylor and Francis shall not be liable for any losses, actions, claims, proceedings, demands, costs, expenses, damages, and other liabilities whatsoever or howsoever caused arising directly or indirectly in connection with, in relation to or arising out of the use of the Content.
This article may be used for research, teaching, and private study purposes. Any substantial or systematic reproduction, redistribution, reselling, loan, sub-licensing, systematic supply, or distribution in any
form to anyone is expressly forbidden. Terms & Conditions of access and use can be found at http:// www.tandfonline.com/page/terms-and-conditions
Effect of Filtration Velocity and Filtration Pressure
Drop on the Bag-Cleaning Performance of a Pulse-Jet
Baghouse
CHUEN-JINN TSAI* and MING-LUN TSAI
INSTITUTE OF ENVIRONMENTAL ENGINEERING NATIONAL CHIAO TUNG UNIVERSITY
HSIN CHU, TAIWAN, REPUBLIC OF CHINA
HSIN-CHUNG LU
DEPARTMENT OF ENVIRONMENTAL ENGINEERING & HEALTH HUNG KUANG INSTITUTE OF TECHNOLOGY
SHA-LU, TAICHUNG, TAIWAN, REPUBLIC OF CHINA
ABSTRACT
In this study the filtration velocity and filtration pressure drop at the beginning of bag cleaning were used as experimental parameters to evaluate the bag-cleaning per-formance of a pulse-jet baghouse. The effective residual pressure loss was used to in-dicate the cleaning performance after bag cleaning. Two different test dusts, fly ash and limestone, were used. The critical cleaning indices under different operation conditions for bag cleaning were also investigated. A critical average pulse overpressure was found to exist beyond which bag-cleaning performance did not improve much. It was found the filter’s final filtration resistance is an important parameter to decide whether a Venturi is necessary for a good bag-cleaning performance or not. Use of a Venturi was found to increase the average pulse overpressure for a system with a filter’s final resistance coefficient greater than about 500 Pa⭈s/cm. However, no Venturi is recom-mended when the filter’s final resistance coefficient is smaller than 500 Pa⭈s/cm.
INTRODUCTION
Fabric filtration and bag-cleaning performance of a baghouse have been investigated extensively (1–4). Many design and operating parameters
in-Copyright © 2000 by Marcel Dekker, Inc. www.dekker.com
211
* To whom correspondence should be addressed.
fluence the performance of a pulse-jet baghouse, including tank size, tank pressure, blow tube diameter, discharge characteristics of diaphragm valve, nozzle diameter, Venturi type, pulse duration, dust properties, etc. Many previous investigators (3, 5–7) pointed out that a critical cleaning efficiency exists for different indices of cleaning intensity, such as the peak pulse over-pressure, the average pulse overpressure inside the bag, and the fabric ac-celeration. If the index of cleaning intensity exceeds the critical value, the cleaning efficiency improves only slightly while the dust emission will in-crease.
In a previous study a pilot-scale pulse-jet baghouse was designed and tested for investigating the performances of filtration and bag cleaning using fly ash particles at a fixed filtration velocity of 2 cm/s and a filtration pressure drop of 6 in. H2O (or 1500 Pa) (8). The effective residual pressure drop ⌬PE, which
is the intercept of the linear portion of the pressure drop versus filtration time with the ordinate, was used as the index of bag cleaning. It was found that a critical cleaning average overpressure of 500–600 Pa for an effective bag cleaning exists. The addition of a Venturi was found to increase the average pulse overpressure appreciably, hence increasing the cleaning effect for fly-ash particles. Whether or not the same conclusion can be reached for different dust particles at different filtration velocities and different pressure drops at bag cleaning remains to be investigated.
PREVIOUS WORK
The dust accumulates on the fabric to form a dust cake in the filtration pro-cess. When the dust accumulates on the fabric bag, the filter drag is described by the following basic filtration equation (9):
⌬P/vf⫽ Sf⫽ SE⫹ K2(W⫺ WR) ⫽ SE⫹ K2w0 (1)
or
⌬P ⫽ (SE⫹ K2W0)vf⫽ ⌬PE⫹ K2W0vf⫽ Rfvf (2)
where ⌬P is the pressure drop across the filter bag, vfis the filtration velocity,
K2is the specific resistance coefficient of the dust cake, Sfis the filter drag, SE
is the effective drag of residual dust, W is the mass areal density of the dust cake, WRis the residual dust areal mass density, W0is the dust mass areal
den-sity added during the filtration cycle, Rfis the filter’s final resistance
coeffi-cient, and ⌬PEis the effective residual pressure drop (⫽ SEvf). In the above
equations the cake repair period is assumed to be relatively short compared to the homogeneous dust cake period.
When the pressure drop exceeds a preset value, the dust cake must be re-moved by pulse-jet cleaning. A critical pulse-jet cleaning energy exists
yond which bag cleaning improves only slightly. Klingel and Löffler (12) pointed out when the air-pressure impulse (PI) in the fabric bag is greater than 50 Pa⭈s, dust removal efficiency does not increase further. Air-pressure im-pulse PI is defined as the integral of pressure versus time over a im-pulse dura-tion, or PI ⫽ 兰0Tpd p(t)dt (Tpd ⫽ pulse duration). Humphries and Madden (3)
found that there is a minimum pulse pressure of about 0.3 kPa in the fabric bag which removes about 60% of the dust cake from the fabric. Increasing the pulse pressure beyond this minimum value results in only a slight increase in the amount of dust dislodged. Sievert and Löffler (7) also showed that it is necessary to reach a critical static overpressure of 400–500 Pa at all locations along the length of a bag in order to achieve a good fabric-cleaning efficiency. The overpressure is defined as the pulse pressure minus the bag pressure drop. For fly-ash particles, Lu and Tsai (8) found that the critical cleaning average pulse overpressure is 500–600 Pa for fly-ash particles.
During pulse-jet cleaning, a short burst of compressed air is discharged from a nozzle and usually directed through a Venturi into the filter bag to in-crease the pulse pressure within the bag. This nozzle-Venturi system is the so-called jet pump (6, 10, 11). Figure 1 shows a typical jet pump curve, pulsing power curve, and bag operating lines of a pulse-jet fabric filter. A jet pump characteristic curve varies with the initial tank pressure, nozzle size, Venturi configuration, and the distance between the nozzle and Venturi. The maxi-mum pulse pressure developed in the bag by the jet pump is obtained at zero flow rate. Conversely, the maximum flow rate through the Venturi is obtained at zero pulse pressure, or when the bag has zero resistance.
FIG. 1 Typical jet pump and pulse power curves.
Different bag operating lines are shown as solid straight lines A (higher re-sistance coefficient) and B (lower rere-sistance coefficient) in Fig. 1. The oper-ating points, such as Point 1, 2, and 3, are the interceptions between the bag operating lines and the jet pump curves. The intercept of the bag operating line with the vertical coordinate dictates the pulse pressure developed inside the bag during bag cleaning. Points 1, 2, and 3 represent the operating points. For the system with higher resistance coefficient such as Line A, the developed pulse pressure will be higher than the system with lower resistance coefficient, such as Line B. The pulsing power curve, which is calculated from the prod-uct of the jet pump flow rate and the developed pulse pressure, is also shown in Fig. 1. A maximum cleaning power point (MCPP) represents an optimum operating condition, which can be used together with the bag operating line to judge the stability of a baghouse operation.
Lu and Tsai (13) investigated the performance of the Venturi using filter bags of different resistance coefficients. They found that the required initial tank pressure and energy can be reduced with the use of a Venturi for a bag with a high resistance coefficient. Conversely, when the resistance coefficient of the bag is low, a Venturi is found to increase the energy consumption. That is, a higher pulse pressure was achieved without the Venturi for bags with a low resistance coefficient. For bags with higher resistance coefficients, a higher pulse pressure is obtained with a Venturi installed.
In this study a pilot-scale pulse-jet baghouse was tested to investigate the performance of bag cleaning under different filtration velocities and different pressure drops at the beginning of bag cleaning. The objective of this study is to determine the critical cleaning indices under different operating conditions. The influence of installing a Venturi and different nozzle diameters on the per-formance of bag cleaning under different filtration velocities and different test particles was also examined.
EXPERIMENTAL METHOD
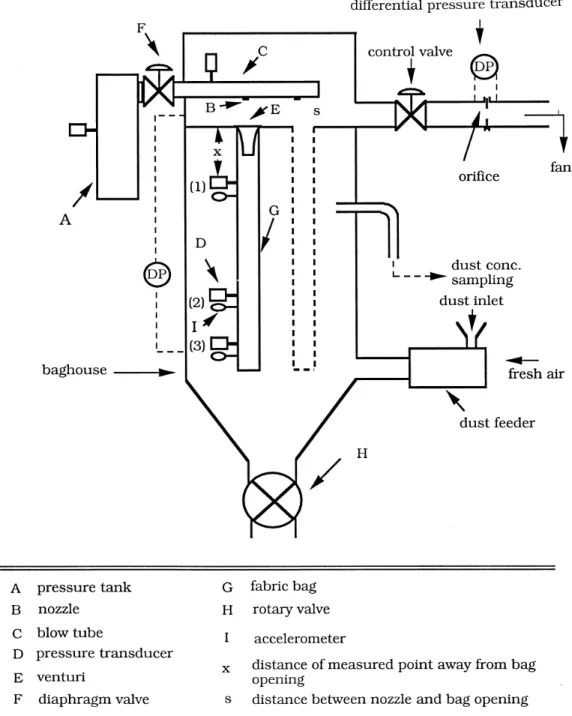
The schematic diagram of the pilot-scale pulse-jet bag filter for testing the performance of dust filtration and bag cleaning is shown in Fig. 2. The equipment consists of a compressed air reservoir, diaphragm valve, air blow tube, nozzles with or without Venturi, fan, dust feeder, and a baghouse com-partment. The compressed air tank volume was 0.08 m3; the blow tube di-ameter was 8.3 cm. The Venturies used in the experiment are shown in Fig. 3. A type-1 Venturi is of a conventional design and a type-2 Venturi is a bet-ter design which minimizes flow separation in the divergent section. Inside the baghouse compartment, two 1.5 m long and 127 mm diameter fabric bags made of polyester with an acrylic coating were installed. A cylindrical cage supported the bags. A flow rate control device including an orifice, a
pressure transducer, and a control valve were set downstream of the bag-house to measure the air flow rate during filtration. The filtration velocity was kept constant at 2, 3, or 4 cm/s. The test dusts were limestone and fly ash. The fly ash was obtained from a local coal fire power station and its MMAD (mass median aerodynamic diameter) and g (geometric standard
deviation) were measured in the baghouse by a MOUDI cascade impactor
FIG. 2 Schematic of experimental setup.
(Multi-Orifice Uniform Deposit Impactor, Model 100, MSP Inc., St Paul, MN, USA) to be 6.0 m and 2.1, respectively. Limestone was obtained from a local manufacturer and its MMAD and g were measured to be 2.62 m
and 2.2, respectively.
The test dust was fed into the baghouse from a homemade screw-type dust feeder located before the gas inlet duct and dispersed by 40 psi compressed air. There was a speed control device to control the output dust concentration of the dust feeder. Dust mass concentration inside the compartment was deter-mined by the gravimetric method for each test during filtration.
Conditioned bags were used. The bags were conditioned by running the baghouse using the test dust for many filtration cycles until the filtration time
FIG. 3 Type-1 and type-2 Venturi.
and residual pressure drop became nearly constant. For the current experi-ment, this conditioning process lasted for over 50 hours. During filtration, the pressure drop ⌬P across the bag and the volume flow rate were measured con-tinuously. The pressure drop versus time curve can be used to decide the ef-fective residual pressure loss and the specific resistance coefficient, K2, of the
dust cake. After attaining a pressure drop of 6 or 8 in. of H2O (1500 or 2000
Pa), the diaphragm valve was opened and the compressed air was discharged into the bag from the nozzle to remove the dust accumulated on the bag. The dislodged dust fell down to the hopper and was removed by the rotary valve. The tank pressure, the nozzle diameter, and the Venturi were varied for the pulse-jet cleaning system to obtain different operating conditions.
RESULTS AND DISCUSSION
Filtration Curves under Different Operating Conditions
Typical filtration curves obtained at different cycles are shown in Fig. 4 for limestone particles when the type-2 Venturi was used. It is seen that the cycle
FIG. 4 Typical filtration pressure drop versus filtration time for different cycles. Pressure drop at bag cleaning ⫽ 1500 Pa, type-2, Venturi, dn⫽ 13 mm, Ptk0⫽ 196 kPa, limestone.
time (or filtration time) is nearly constant at 4 minutes when the bags are well conditioned before the experiment. The specific dust cake resistance coeffi-cient K2can be obtained from such filtration curves by fitting the data by
lin-ear regression, Eq. (2), and the effective residual pressure drop ⌬PEcan be
ob-tained from the intercept of the linear portion of the curve with the ordinate. Figures 5(a)–(c) show the typical relationship of filtration pressure drop ver-sus filtration time under various initial tank pressure conditions with no Ven-turi used. The pressure drop at bag cleaning was fixed at 2000 Pa (or 8 in.H2O), the nozzle diameter was fixed at 13 mm. It is seen that the initial tank
pressure and filtration velocity influence the shape of the filtration curves. When the initial tank pressure is increased, the residual pressure drop is de-creased while the slope of filtration stays almost constant as long as the filtra-tion velocity is kept constant. With the initial tank pressure exceeding a criti-cal value, the filtration curves will overlap and the residual pressures drop will remain the same. For example, it is seen in Fig. 5(a) that the filtration curves for ptk0greater than 294 kPa almost overlap and the effective residual pressure
drops are all close to 169 Pa. This indicates that a critical tank pressure value exists for effective bag cleaning. When the initial tank pressure exceeds this critical value, the pulse-jet cleaning effect is improved only slightly.
When the filtration velocity is decreased to 3 or 2 cm/s, the corresponding critical tank pressure will also be decreased to a value smaller than 294 kPa, as indicated in Figs. 5(b) and (c). The corresponding effective residual pres-sure drop is also smaller than 169 Pa. For example, when the tank prespres-sure is fixed at 196 kPa, the effective residual pressure drop is now 25 and 0 Pa for the filtration velocity of 3 and 2 cm/s, respectively. At critical cleaning condi-tions, the cycle time also varies with the filtration velocity. The cycle times are 2, 7, and 14 minutes for filtration velocities of 4, 3, and 2 cm/s, respectively.
If the pressure drop at bag cleaning is decreased to 1500 Pa (or 6 in.H2O),
the bag can be cleaned more effectively at a smaller tank pressure. The criti-cal tank pressures are now 98, 196, and 294 kPa for filtration velocities of 2, 3, and 4 cm/s, respectively. The effective residual pressure drop is lower (0, 7.5, and 20 Pa for filtration velocities of 2, 3, and 4 cm/s, respectively) when the tank pressure is fixed at 196 kPa.
Experimental filtration curves obtained using type-2 Venturi indicate that the Venturi does not improve bag cleaning performance for limestone parti-cles. The corresponding critical tank pressure and the effective residual pres-sure drop are now higher than for the case without a Venturi. The critical tank pressures are now 118, 294, and 392 kPa and the effective residual pressure drops are now 0, 75, and 139 kPa for filtration velocities of 2, 3, and 4 cm/s, respectively.
The above results are for nozzle diameter of 13 mm. Similar experimental data were also obtained for a smaller nozzle diameter, 8 mm. However, the
FIG. 5 Filtration pressure drop versus filtration time at filtration velocities of (a) 4, (b) 3, and (c) 2 cm/s. Limestone, no Venturi, dn⫽ 13 mm, pressure drop at bag cleaning ⫽ 2000 Pa.
perimental data indicate that both critical tank pressure and effective residual pressure drop are greater than for the 13 mm nozzle diameter. That is, the bags are more difficult to clean.
The specific dust cake resistance coefficient, K2, can be calculated from the
filtration curves as
K2(s⫺1) ⫽ 2.24 ⫻ 105Vf0.655, fly ash (3)
K2(s⫺1) ⫽ 4.75 ⫻ 105Vf0.437, limestone (4)
It is seen from these two equations that the smaller limestone particles have higher specific dust cake resistance coefficients than do the larger fly-ash par-ticles; also, a higher filtration velocity will result in more dust cake com-paction and higher resistance coefficients. Given all operation parameters fixed, the effect of the higher resistant coefficient for limestone particles is to increase the pulse pressure developed inside the bag compared with particles with a lower resistance coefficient.
Average Pulse Overpressure and the Role of a Venturi
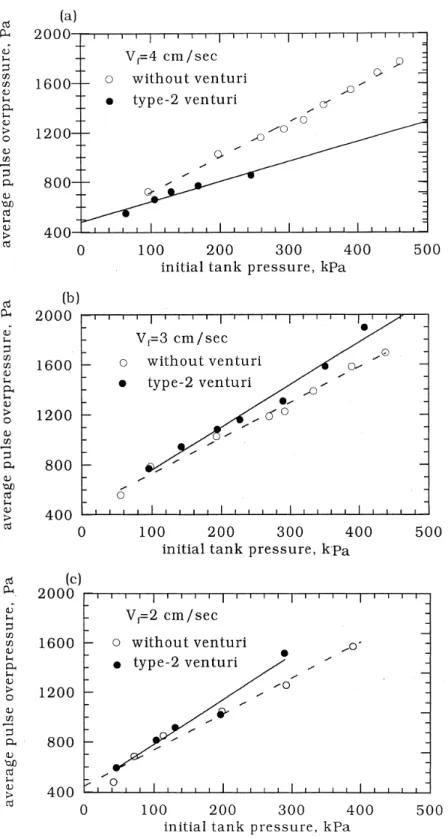
Figures 6(a)–(c) show that the average pulse overpressure increases as the initial tank pressure increases for limestone particles when the pressure drop at bag cleaning is 2000 Pa and the nozzle diameter is 13 mm. The average pulse overpressure is calculated from the difference between the pulse pres-sure inside the bag and that outside the bag. From Eq. (2), the filter’s final re-sistance coefficient Rfcan be calculated from the ratio of the pressure drop at
bag cleaning, ⌬P, and filtration velocity, vf. As shown in Fig. 6(a), if the
fil-tration velocity is kept at 4 cm/s (or Rf⫽ 500 Pa⭈s/cm), the use of a type-2
Venturi will lower the pulse overpressure more than for a system without a Venturi. However, if the filtration velocity is kept at 2 cm/s (or Rf ⫽ 1000
Pa⭈s/cm), the use of a type-2 Venturi will increase the pulse overpressure more than will a system without a Venturi. That is, whether or not a Venturi is needed depends on Rf. A Venturi is not suitable for a system with a low
resis-tance coefficient (Rf smaller than about 500 Pa⭈s/cm). For a system with a
higher resistance coefficient (Rfgreater than about 500 Pa⭈s/cm), use of a
Ven-turi is suggested to reduce the required initial tank pressure and energy con-sumption. Experimental data using the same parameters except for the pres-sure drop at bag cleaning is lowered to 1500 Pa, which reconfirms the above conclusion.
When fly-ash particles are tested, the above finding remains the same, as shown in Fig. 7. The filtration velocity was kept at 2 cm/s, the pressure drop at bag cleaning was fixed at 1500 Pa (or Rf⫽ 750 Pa⭈s/cm), and the nozzle
diameter was varied from 8 to 20 mm. Figure 7 Indicates that the average pulse overpressure for a system with a type-1 Venturi is indeed higher than
FIG. 6 Relationship between average pulse overpressure and initial tank pressure at filtration velocities of (a) 4, (b) 3, and (c) 2 cm/s. Limestone, pressure drop at bag cleaning ⫽ 2000 Pa,
dn⫽ 13 mm.
for a system without a Venturi for all the nozzle diameters tested. A larger nozzle and a higher tank pressure are seen to increase the pulse overpressure inside the bag when all the other parameters are fixed. The effect of the two different types of Venturi on bag cleaning performance has not been deter-mined.
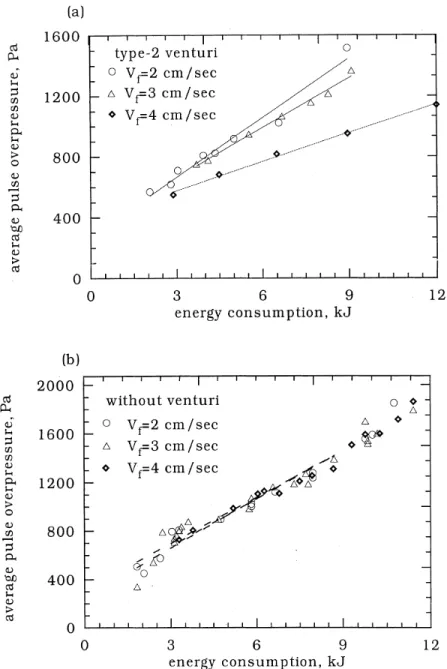
The use of a Venturi is sensitive to variation of filtration velocity, as Fig. 8 shows. When operating at a higher filtration velocity, the pulse overpres-sure developed in the bag becomes higher than when operating at a lower fil-tration velocity, assuming energy consumption is the same. On the contrary, in a system without a Venturi, the average pulse overpressure under different filtration velocities remains nearly the same regardless of energy consump-tion.
Multiple variable regression analysis shows that the average pulse over-pressure can be related to the square root of the initial tank over-pressure and noz-zle diameter, as shown in Fig. 9 for limestone particles, when the system is without a venturi. The filter’s final resistance coefficient is weakly related to the average pulse overpressure. The empirical equation is
Pov⫽ 224Ptk00.495Rf0.002dn0.504 (5)
where the units are Povin Pa. Ptk0in kg/cm2, Rfin Pa⭈s/cm, and dnin mm.
FIG. 7 Relationship between average pulse overpressure and initial tank pressure for different nozzle diameters. Fly ash pressure drop at bag cleaning ⫽ 1500 Pa, Vf⫽ 2 cm/s.
Critical Cleaning Indices
Lu and Tsai (8) found that the critical cleaning average pulse overpressure is 500–600 Pa for fly-ash particles. Their experiment was done at a fixed fil-tration velocity of 2 cm/s. As can be seen from Fig. 6, the average pulse over-pressure is directly related to the initial tank over-pressure. In addition, many other factors, such as filtration velocity, use of a Venturi, pressure drop at bag
clean-FIG. 8 Relationship between average pulse overpressure and energy consumption. (a) type-2 Venturi, (b) without Venturi. Limestone, pressure drop at bag cleaning ⫽ 2000 Pa, dn⫽ 13 mm.
ing, and nozzle diameter, will influence the average pulse overpressure, and thus the critical cleaning average pulse overpressure. If the filtration velocity is fixed at 2 cm/s and no Venturi is used, the critical cleaning average pulse overpressure is found to be 1000 Pa for limestone particles. This value will change to 800 Pa if a type-2 Venturi is used. For other conditions, the critical cleaning pulse overpressure can be extracted from filtration curves such as Fig. 6. The critical pulse overpressure for limestone is seen to be higher than that of fly-ash particles, which indicates that smaller limestone particles are more difficult to remove from the bag than bigger fly-ash particles.
CONCLUSIONS
A pilot pulse-jet baghouse was used to investigate the critical conditions and the role of a Venturi by using two different test dusts under different op-erating conditions.
The filtration velocity and filtration pressure drop at the beginning of bag cleaning were used as experimental parameters to evaluate the bag-cleaning performance of a pulse-jet baghouse. The effective residual pressure loss was used to indicate the cleaning performance after bag cleaning, and two differ-ent test dusts, limestone and fly ash, were used. A critical tank pressure (or a
FIG. 9 Comparison of empirical average pulse overpressure with experimental data, no Venturi. Limestone.
critical average pulse overpressure) was found to increase with filtration ve-locity and is different for different types of dust. Whether a Venturi is used or not also influences the critical bag-cleaning conditions. It was found the fil-ter’s final filtration resistance is an important parameter to decide whether a Venturi is necessary for good bag-cleaning performance. Use of a Venturi was found to increase the average pulse overpressure for a system with a filter’s fi-nal resistance coefficient greater than about 500 Pa⭈s/cm. However, no Ven-turi is recommended when the filter’s final resistance coefficient is smaller than 500 Pa⭈s/cm.
ACKNOWLEDGMENT
The authors thank the Taiwan National Science Council of the Republic China for financial support under Contract NSC-87-2211-E-009-005.
NOTATIONS
C dust concentration in the baghouse (g/m3)
dn nozzle diameter for bag cleaning (mm)
K2 specific resistance coefficient of the dust cake (s⫺1)
⌬P filtration pressure drop (Pa)
⌬PE effective residual pressure loss (Pa)
Pov average pulse overpressure (Pa)
Ptk0 initial tank pressure for bag cleaning (kg/cm2)
Rf filter’s final resistance coefficient (Pa⭈s/cm)
SE effective drag of residual dust (Pa⭈s/cm)
Sf filter drag (Pa⭈s/cm)
t filtration time after each bag cleaning (s)
vf filtration velocity (cm/s)
W mass areal density of the dust cake (g/cm2)
W0 freshly accumulated dust areal density after a cleaning cycle (g/cm2)
WR residual dust areal mass density (g/cm2)
REFERENCES
1. R. Dennis and H. A. Klemm, “Modeling Concepts for Pulse-Jet Filtration,” J. Air Pollut.
Controls Assoc., 30, 38 (1980).
2. M. J. Ellenbecker and D. Leith, “Dust Removal from Non-Woven Fabric-Cleaning Meth-ods Need to be Improved,” Filt. Sep., 18, 41 (1981).
3. W. Humphries and J. J. Madden, “Fabric Filtration for Coal-Fired Boilers: Dust Dislodg-ment in Pulse Jet Filters,” Ibid., 20, 40 (1983).
4. J. L. Koehler and D. Leith, “Model Calibration for Pressure Drop in a Pulse-Jet Cleaned Fabric Filter,” Atmos. Environ., 17, 1909 (1983).
5. W. J. Morris, “Cleaning Mechanisms in Pulse Jet Fabric Filters,” Filtr. Sep., 21, 50 (1984).
6. M. D. Ravin, W. Humphries, and R. Postle, “A Model for the Performance of a Pulse Jet Filter,” Ibid., 24, 201 (1988).
7. J. Sievert and F. Löffler, “Fabric Cleaning in Pulse-Jet Filter,” Chem. Eng. Process., 26, 179 (1989).
8. H. C. Lu and C. J. Tsai, “A Pilot-Scale Study of the Design and Operation Parameters of a Pulse-Jet Baghouse,” Aerosol Sci. Technol., 29(6), 510 (1998).
9. R. P. Donovan, Fabric Filtration for Combustion Source: Fundamentals and Basic
Tech-nology, Dekker, New York, NY, 1985, p. 159.
10. E. Bakke, “Optimizing Filtration Parameters,” J. Air Pollut. Control Assoc., 24, 1150 (1974).
11. K. Morris, C. J. Cursley and R. W. K. Allen, “The Role of Venturis in Pulse-Jet Filters,”
Filtr. Sep., 28, 24 (1991).
12. R. Klingel and F. Löffler, “Influence of Cleaning Intensity on Pressure Drop and Residual Dust Areal Density in a Pulse-Jet Fabric Filter,” Proc. Filtech. Conf., London, 1983, p. 306. 13. H. C. Lu and C. J. Tsai, “The Influence of Design and Operation Parameters on Bag Clean-ing Performance of the Pulse-Jet Baghouse,” Am. Soc. Civil Eng., J. Environ. Eng., 125, 583 (1999).
Received by editor March 5, 1999 Revision received June 1999