國 立 交 通 大 學
機械工程學系
博士論文
質子交換膜燃料電池中傳輸現象效應對性能影
響之研究
Investigation of the Effects of Transport Phenomena on the
Performance of Proton Exchange Membrane Fuel Cells
研 究 生 : 江 木 勝
指導教授 : 陳 俊 勳 教授
曲 新 生 教授
質子交換膜燃料電池中傳輸現象效應對性能影
響之研究
Investigation of the Effects of Transport Phenomena on the
Performance of Proton Exchange Membrane Fuel Cells
研 究 生 : 江 木 勝 Student : Mu-Sheng Chiang
指導教授 : 陳 俊 勳 教授 Advisor : Chiun-Hsun Chen
曲 新 生 教授
Hsin-Seng Chu
國 立 交 通 大 學
機 械 工 程 學 系
博 士 論 文
A Thesis
Submitted to Department of Mechanical Engineering
College of Engineering
National Chiao Tung University
in partial Fulfillment of the Requirements
for the Degree of
Doctor of Philosophy
in
Mechanical Engineering
May 2006
Hsinchu, Taiwan, Republic of China
中 華 民 國 九 十 六 年 五 月
質子交換膜燃料電池中傳輸現象效應對性能影響之研究
學生 : 江木勝 指導教授 : 陳俊勳 曲新生
國立交通大學
機械工程系
摘 要
本論文探討質子交換膜燃料電池於各種傳輸元件設計與水熱操作模式下的 傳輸現象與性能影響。研究中首先建置描述質子交換膜燃料電池內部各種傳輸及 電化學現象之數學模式,其中以質量、物種、動量與電流守恆方程式做為模式主 要架構。在電化學反應部份以 Bulter-Volmer 方程式加以描述,方程式使用活化 過電位聯繫觸媒層中電子相與質子相電位,為反應的主要驅動力。為考慮電化學 反應所產生熱能,模式中同時納入系統能量守恆方程式,其中焓值源項考慮電流 焦耳熱、過電位以及水之相變化潛熱。本研究中含蓋三個質子交換膜燃料電池傳 輸現象與電化學反應之主要議題, 分別為溫溼度梯度、傳輸元件效應以及新型陰 極流道設計對性能影響之研究。 在探討各式加濕與溫度梯度的影響時,數值計算結果以極化曲線與局部性 質分佈說明各種加濕與溫度梯度效應。結果顯示陰陽極加溼溫度變化對電池性能 產生不同效果。而在溫度梯度效應方面,依據梯度大小與梯度方向亦有不同的現 象表現。在任一較高的邊界溫度下,由於觸媒反應速率及薄膜導電度的提升,電 池性能隨另一邊界溫度之增加而提升。從局部氣體濃度及液態水分佈情況繪圖 中,顯示出其與溫度及加濕梯度具有密切關係,進而對電池性能產生影響。 於傳輸元件設計效應之研究中,藉由改變各種流道高寬比與氣體擴散層厚 度的分析結果顯示,細高型的流道設計適合於中電流密度的電池操作情況,而寬 扁型的流道則於高電流密度下有較佳的性能輸出。經由特定位置橫向氧氣濃度與相電位圖形顯示在燃料電池中的氧氣傳輸與電子傳導對局部電化學反應呈現競 爭效應,其相對強度與操作條件與位置有關係。於電池極化曲線中顯示最佳氣體 擴散層厚度隨操作電壓減少而增大;然而在最小的考慮電壓0.14V 時,由於液態 水的累積與傳輸路徑增長而逆轉此一趨勢。 本論文第三部份針對一具新型陰極流道燃料電池之電化學反應與性能進行 探討。藉由流道出口寬度改變,而考量漸擴、直管與漸縮等三種外型流道的效應。 研究結果顯示漸縮型流道於中電池電壓情況下,由於其具有增進電子傳輸之效果 而有較佳性能表現。反之,當電池操作電壓下降反應速率提升時,漸擴型流道因 為可以提供較高濃度氧氣至觸媒層反應位址,致使其產生較大電流輸出。藉由檢 視觸媒層中局部電流密度與氧氣及各項電位分佈情形,可以獲得燃料電池中內部 電化學反應的變化趨勢。此一結果可以使我們從一般所熟知的整體性能曲線變化 機制中,進一步了解電池內部由於各種物種傳輸現象特性差異,所產生反應主導 機制不同的原因,對於研發者及工程師具有重要幫助。
Investigation of the Effects of Transport Phenomena on the
Performance of Proton Exchange Membrane Fuel Cells
Student: Mu-Sheng Chiang Advisor: Chiun-Hsun Chen
Hsin-Seng Chu
Department of Mechanical Engineering
National Chiao Tung University
ABSTRACT
This dissertation presents a numerical investigation of the transport phenomena and performance of proton exchange membrane fuel cell (PEMFCs) with various transport component design parameters as well as water and thermal management schemes. A three-dimensional fuel cell model, incorporating conservations of species, momentum, as well as current transport, is developed at first. The Bulter-Volmer equation that describes the electrochemical reaction in the catalyst layer is adopted with the activation overpotential as the connection between the solid phase potential and that of the electrolyte phase. To ensure the conservation of enthalpy, the energy equation is employed to the model domain with three sources of enthalpy generation: ohmic heating, activation overpotential as well as phase change of water harnessed in modeling. Three major topics concerning the transport phenomena as well as electrochemical reaction in PEMFCs are presented in this dissertation. This includes the water and thermal management, transport component design effect as well as a novel cathode channel shape effect.
In the investigation of cell temperature and humidification effects, numerical prediction results are presented using polarization curves and contour plots. Findings show that humidification level perturbation on the anode or cathode side creates an individual effect. Mechanisms influencing performance variation tendencies are interpreted. Also, modeling results with existing temperature gradient exhibit different
trends on the overpotentials according to the slop and magnitude. At a higher boundary temperature on either side, cell performance increases according to the temperature increase on the other side because the reaction kinetic and ionic phase conductivity is promoted. Contour plots of local concentration and saturation level show the close relation between the existence of both temperature and humidification gradients and the local properties variations.
Through cell performance simulation with various channel aspect ratios and gas diffusion layer (GDL) thicknesses, a slender channel is found suitable for cells operating at moderate reaction rate, and a flat channel produces more current at low cell voltage. Plots of transverse oxygen concentration and phase potential variation indicate that these oppositely affect the local current density pattern. The relative strengths of these two factors depend on the transport component position and geometry, as well as on the cell operating conditions. Consequently, the curves of cell output current density demonstrate that the optimal GDL thickness increases as the cell voltage decreases. However, at the lowest considered cell voltage of 0.14V, optimal thickness decreases as that of a thick GDL the oxygen deficiency caused by long traveling length and clogging effect of liquid water reverses this relationship. The electrochemical reaction and performance of PEMFCs with a novel cathode channel shape is proposed in the third part of this dissertation. This channel geometry has a characteristic of continuous variation of shoulder/channel ratio along the main stream direction. Three types of channel configurations: convergent, straight and divergent channels are investigated. The calculation results demonstrate the effects of the channel configuration on the transport phenomena and cell reaction. As the cell operates at a medium cell voltage, the convergent channel behaves better because the electrons transport is enhanced and the corresponding ohmic overpotential is small.
On the contrary, the divergent shape channel performs better at higher reaction rate as it is able to deliver sufficient oxygen concentration to the reaction sites. Through the distribution inspections of the local current density, oxygen concentration and potential fields in the catalyst layer, variation trend of the electrochemical reaction in the fuel cell is available. With the knowledge of the well comprehended determining reasons of global performance variation, these results can further offer the explanations, which are of great important to the researchers and engineers, of the different dominant mechanisms resulting from the characteristic differentials of transport phenomena for the various species inside the fuel cell.
致 謝
本論文得以完成,首先感謝指導老師曲新生教授與陳俊勳教授悉
心指導,兩位老師嚴謹治學態度與諄諄教誨使學生在專業領域、學術
論文寫作與問題釋疑方面,獲得莫大的助益。同時也感謝台南成功大
學陳朝光國家講座教授多年來的教導,陳老師高瞻遠囑,學術淵博,
對於學生循循善誘,暮鼓晨鐘,猶似醍醐灌頂,如沐春風。
感謝口試委員翁政義校長、陳發林教授、林清發教授與顏維謀校
長於審閱論文時所提指正與寶貴建議,以及諸位老師獨到見解,使得
本論文更臻完備。同時感謝電物所簡賸瑞博士在研究方向與文稿撰寫
上的協助。
在學期間,熱物理研究室的成員,特別是旭昉、世國、鵬樟、建
興、時明、孝彥、建評、純怡、清益以及諸多畢業學長與碩班學弟們
在課業切磋與研究生活上也提供了許多幫助。
最後,對於撫育我的父母親、關心我之所有親友,特別是岳母的
祝福與愛妻遊兒多年來無怨無悔始終如一的付出,予宛諭、宛庭及家
庭無微不至的照顧,使研究生活無後顧之憂,致上最高的敬意與謝
意,謹將此這份的來不易的成果與榮耀與大家一起分享。
TABLE OF CONTENTS
ABSTRACT (in Chinese) ………... i
ABSTRACT (in English)……… iii
ACKNOWLEDGEMENT………. vi
TABLE OF CONTENTS……… vii
LIST OF TABLES……….. xi
LIST OF FIGURES……… xii
NOMENCLATURE……… xix
CHAPTER 1 INTRODUCTION………... 1
1.1 Background……….. 1
1.1.1 Operating Principles of PEMFCs………... 1
1.1.2 Transport Phenomena and Cell Reaction in PEMFCs……… 2
1.2 Literature Survey……….. 4
1.2.1 Modeling Development and Water/Thermal Management Investigation……… 4
1.2.2 Investigation of Cell Component Design……… 5
1.2.3 Numerical Method Development………. 9
1.3 Objectives……….. 10
1.4 Outlines……….. 10
CHAPTER 2 MATHEMATICAL MODELING……….. 16
2.1 Model Description……… 17
2.2 Basic Assumptions……… 17
2.3 Governing Equations……… 18
2.3.1 Continuity Equation……… 19
2.3.3 Mass Transport……… 20
2.3.4 Electrochemical Reaction……… 21
2.3.5 Potential Fields……… 22
2.3.6 Liquid Water Transport……….... 24
2.3.7 Energy Equation……….. 26
2.4 Boundary Conditions………. 27
2.4.1 Flow Field Boundary Conditions………. 27
2.4.2 Potential Field Boundary Conditions……… 27
2.5 Method of Solution……… 29
2.4.3 Calculation Procedure……….. 29
2.4.4 Model Validation……….. 29
CHAPTER 3 EFFECTS OF TEMPERATURE AND HUMIDIFICATION LEVELS ON THE PERFORMANCE OF PROTON EXCHANGE MEMBRANE FUEL CELLS……….. 37
3.1 Introduction……….. 37
3.2 Effects of Humidification Scheme………... 38
3.2.1 Enhanced Humidification Scenario………. 38
3.2.2 Reduced Humidification Scenario……… 40
3.2.3 Combined Enhanced and Reduced Humidification Scenario. 41 3.3 Effects of Cell Temperature Gradient………. 42
3.3.1 Cell Performance at Higher Cathode Temperature…………... 42
3.3.2 Cell Performance at Higher Anode Temperature………. 43
3.3.3 Cell Performance at Lower Anode Temperature……….. 43
3.4.1 Temperature Field……… 45
3.4.2 Oxygen Concentration Distribution………. 45
3.4.3 Water Saturation Level………. 46
3.5 Tendency Comparisons between Predicted and Other Experimental Results……… 46
3.6 Summary……… 48
CHAPTER 4 TRANSPORT COMPONENT DESIGN EFFECTS ON PROTON EXCHANGE MEMBRANE FUEL CELL PERFORAMNCE ………... 66
4.1 Introduction……….. 66
4.2 Cell Performance Subjected to Transport Component Design………. 66
4.2.1 Effect of Channel Aspect Ratio……… 67
4.2.2 Effect of Diffusion Layer Thickness……… 67
4.3 Local Properties Variations in Transverse Direction……….. 69
4.3.1 Membrane Conductivity and Potential……… 69
4.3.2 Solid Phase Potential and Activation Overpotential………… 71
4.3.3 Water Saturation Level……… 73
4.3.4 Oxygen Concentration and Current Density……… 74
4.4 Vertical Distribution of Velocity and Oxygen Concentration………… 79
4.5 Effect of Operating Temperature………... 80
4.6 Tendency Comparisons with Previous Works from Literature……….. 82
4.7 Summary……… 83
CHAPTER 5 ELECTROCHEMICAL REACTION AND PERFORMANCE OF PROTON EXCHANGE
FLOW CHANNEL SHAPE……… 112
5.1 Introduction……….. 112
5.2 Model Properties Distributions……….. 114
5.2.1 Oxygen Concentration………. 114
5.2.2 Water Saturation Level………. 115
5.2.3 Potential Fields and Activation Overpotential……….. 116
5.3 Local Catalyst Reaction Rate……… 119
5.4 Cell Performance for Channel Design with Various S/C Ratios……… 122
5.5 Effect of Reactant Stoichiometry on Cell Performance………. 123
5.6 Summary……… 124
CHAPTER 6 CONCLUSIONS AND FUTURE PERSPECTIVES ... 146
6.1 Concluding Remarks………. 146
6.2 Future Perspectives..………. 150
REFERENCES……… 152
LIST OF TABLES
Table 2.1 Cell geometries and operating conditions of base model……… 31 Table 2.2 Electrochemical parameters and transport properties………. 32 Table 2.3 Results of three computation grid systems based on the parameters
in Table 2.1 and Table 2.2……… 33 Table 4.1 Channel and shoulder geometries for various ARs (unit: mm)……... 86 Table 5.1 Main cell parameters, properties and operating conditions…………. 127 Table 5.2 Simulation cases for various channel configurations used in this
LIST OF FIGURES
Fig. 1.1. Operating principle of a single PEMFC……… 12 Fig. 1.2. Basic components of a single PEMFC……….. 13 Fig. 1.3. The dominant mechanisms of cell performance……… 14 Fig. 1.4. Various overpotentials and available potential in fuel
cells……… 15 Fig. 2.1. Physical and computational domains considered in this
study………... 34 Fig. 2.2. Numerical flow chart of current study……… 35 Fig. 2.3 Comparison of current model results with Wang et al. at 323K and
343K………... 36 Fig. 3.1. Effect of anode enhanced humidification scheme with 10K of
anode humidification level greater than cell temperature for cell
temperatures 333K, 343K and 353K………. 50 Fig. 3.2. Effect of cathode enhanced humidification scheme with 10K of
cathode humidification level greater than cell temperature for cell temperatures 333K, 343K and 353K………. 51 Fig. 3.3. Effect of anode reduced humidification scheme with 10K of anode
humidification level smaller than cell temperature for cell
temperatures 333K, 343K and 353K………. 52 Fig. 3.4. Effect of cathode reduced humidification scheme with 10K of
cathode humidification level smaller than cell temperature for cell temperatures 333K, 343K and 353K………. 53 Fig. 3.5. Effect of humidification gradient that combines anode reduced and
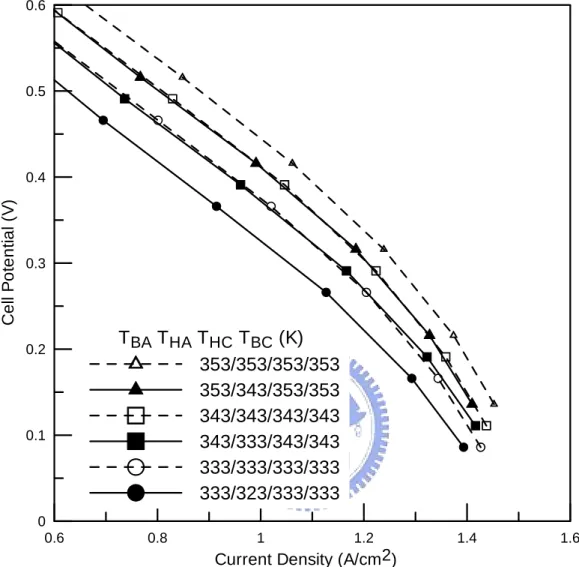
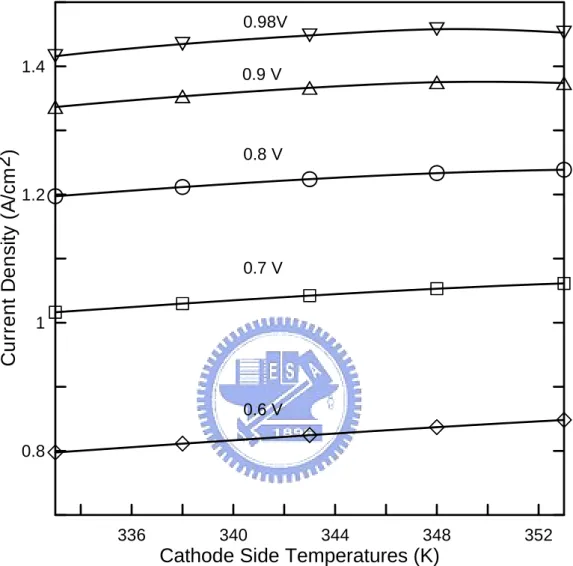
353K………... 54 Fig. 3.6. Cell performance at various total overpotentials with 353K cathode
temperatures and anode temperatures varied from 333K to
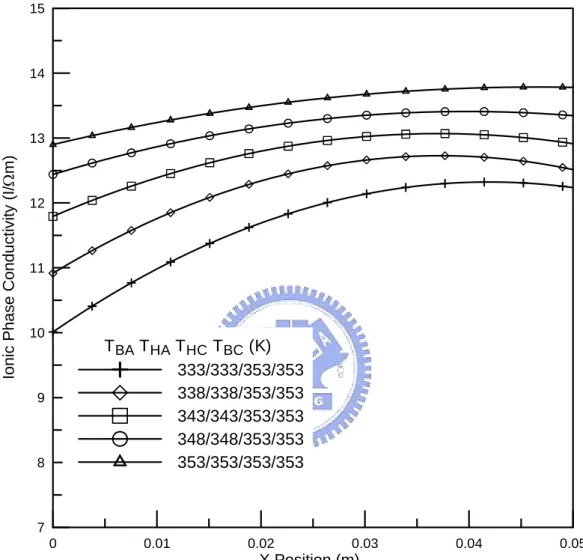
353K………... 55 Fig. 3.7. Ionic Phase conductivity along central channel direction on
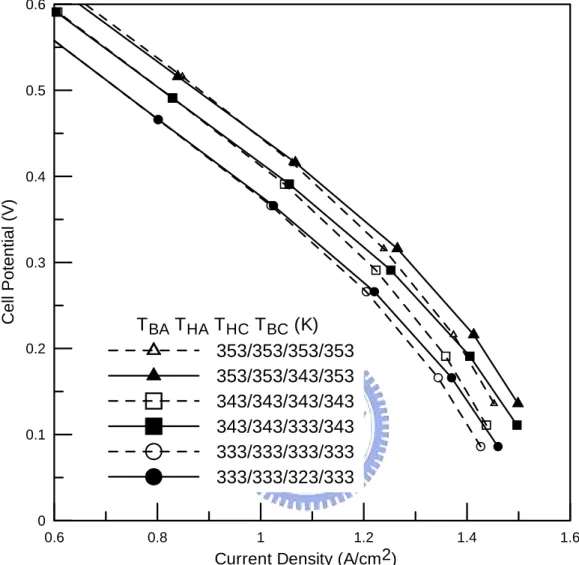
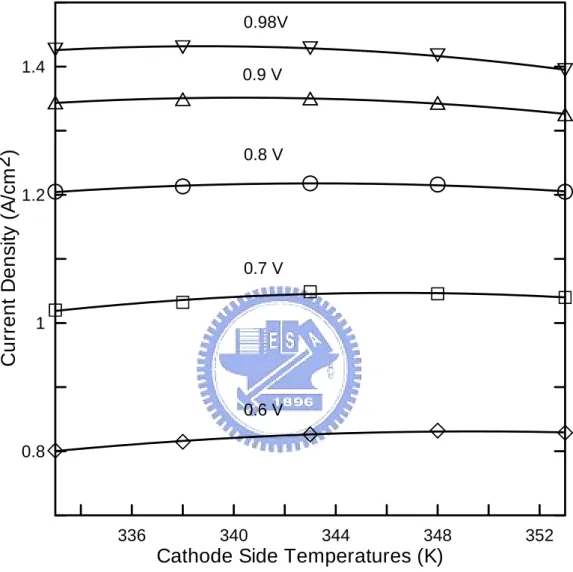
membrane middle section for cases in Fig. 3.6……….. 56 Fig. 3.8. Cell performance at various total overpotentials with 353K anode
temperatures and cathode temperatures varied from 333K to
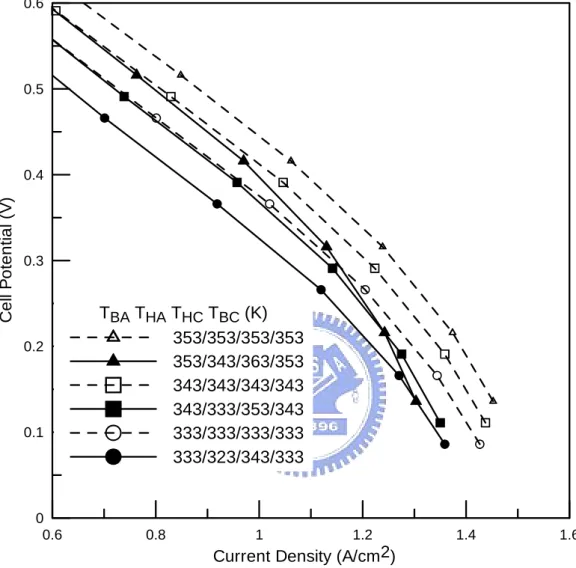
353K………... 57 Fig. 3.9. Cell performance at various total overpotentials with 333K anode
temperatures and cathode temperatures varied from 333K to
353K ……….. 55 Fig. 3.10(a). Ionic phase conductivity along central channel direction on
membrane middle section for cases in Fig. 3.9 at total cell
overpotential of 0.6V………. 59 Fig. 3.10(b). Ionic phase conductivity along central channel direction on
membrane middle section for cases in Fig. 3.9 at total cell
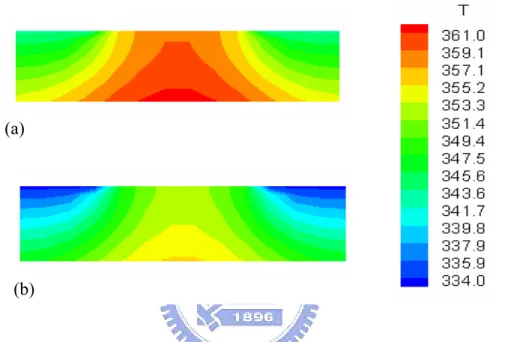
overpotential of 0.98V………... 60 Fig. 3.11. Local temperature contours in cathode GDL at section of
x=0.025m with 353K anode temperatures and cathode
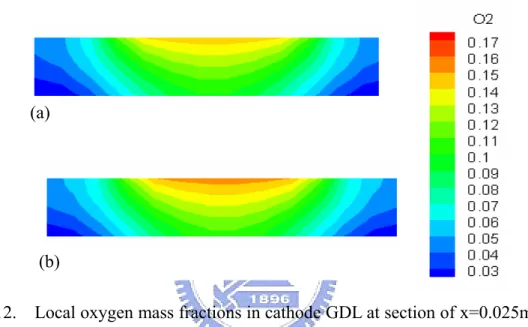
temperatures (a) 343K (b) 333K……… 61 Fig. 3.12. Local oxygen mass fractions in cathode GDL at section of
x=0.025m with 353K anode temperatures and cathode
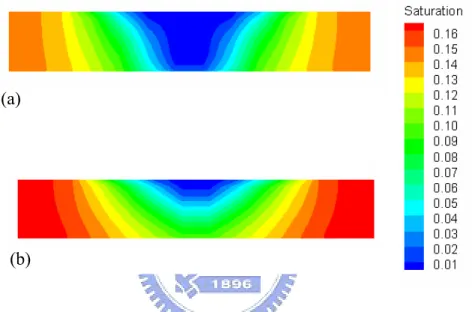
temperatures (a) 343K (b) 333K……… 62 Fig. 3.13. Local water saturation in cathode GDL at section of x=0.025m
with 353K anode temperatures and cathode temperatures (a) 343K (b) 333K……… 63 Fig. 3.14 Experimental results of Wang et al. (2003) on the effects of
cathode humidification schemes. The cell temperature is set at 343K and the cathode humidification temperatures varied from
313K to 353K……… 64 Fig. 3.15 Experimental results of Lee et al. (1999b) on the effects of anode
and cathode enhanced humidification schemes. The cathode humidification temperatures vary from 348K to 358K while the
anode humidification temperatures vary from 358K to 368K……... 65 Fig. 4.1(a) Current density distribution at various cell voltages as function of
AR……….. 87 Fig. 4.1(b) Current density distribution at various cell voltages as function of
GDL thickness……… 88 Fig. 4.2(a) Distributions of potential and conductivity of membrane in the
transverse direction of the middle X-Y plane for three values of AR at cell voltages of 0.62V……… 89 Fig. 4.2(b) Distributions of potential and conductivity of membrane in the
transverse direction of the middle X-Y plane for three values of AR at cell voltages of 0.14V……… 90 Fig. 4.3(a). Distributions of potential and conductivity of membrane in the
transverse direction of the middle X-Y plane for three values of
GDL thickness at cell voltage of 0.62V………. 91 Fig. 4.3(b). Distributions of potential and conductivity of membrane in the
GDL thickness at cell voltage of 0.14V………. 92 Fig. 4.4 (a). Transverse distributions of solid phase potential and activation
overpotential at the interface between the cathode catalyst layer
and the GDL for three values of AR at cell voltage of 0.62V……… 93 Fig. 4.4 (b). Transverse distributions of solid phase potential and activation
overpotential at the interface between the cathode catalyst layer
and the GDL for three values of AR at cell voltage of 0.14V……… 94 Fig. 4.5 (a). Transverse distributions of solid phase potential and activation
overpotential at the interface between the cathode catalyst layer
and the GDL for three GDL thicknesses at cell voltage of 0.62V…. 95 Fig. 4.5(b). Transverse distributions of solid phase potential and activation
overpotential at the interface between the cathode catalyst layer
and the GDL for three GDL thicknesses at cell voltage of 0.14V…. 96 Fig. 4.6(a). Effect of channel aspect ratio on transverse water saturation of the
cathode GDL along channel direction at cell voltage of 0.62V……. 97 Fig. 4.6(b). Effect of channel aspect ratio on transverse water saturation of the
cathode GDL along channel direction at cell voltage of 0.14V……. 98 Fig. 4.7(a). Effect of GDL thickness on transverse water saturation of the
cathode GDL along channel direction at cell voltage of 0.62V……. 99 Fig. 4.7(b). Effect of GDL thickness on transverse water saturation of the
cathode GDL along channel direction at cell voltage of 0.14V…… 100 Fig. 4.8(a). Transverse distributions of oxygen mass fraction and local current
density at the interface between the cathode catalyst layer and the
GDL for three values of AR at cell voltage of 0.62V……… 101 Fig. 4.8(b). Transverse distributions of oxygen mass fraction and local current
density at the interface between the cathode catalyst layer and the
GDL for three values of AR at cell voltage of 0.14V……… 102 Fig. 4.9(a). Transverse distributions of oxygen mass fraction and current
density at the interface between the cathode catalyst layer and the
GDL for three GDL thicknesses at cell voltage of 0.62V…………. 103 Fig. 4.9(b). Transverse distributions of oxygen mass fraction and current
density at the interface between the cathode catalyst layer and the
GDL for three GDL thicknesses at cell voltage of 0.14V………….. 104 Fig. 4.10(a). Vertical distributions of fluid velocity and oxygen mass fraction
in cathode channel and GDL for AR value of 0.5………. 105 Fig. 4.10(b). Vertical distributions of fluid velocity and oxygen mass fraction
in cathode channel and GDL for AR value of 1.5………. 106 Fig. 4.11(a). Vertical distributions of fluid velocity and oxygen mass fraction
in cathode channel and GDL for GDL thickness of 152 micro m…. 107 Fig. 4.11(b). Vertical distributions of fluid velocity and oxygen mass fraction
in cathode channel and GDL for GDL thickness of 356 micro m…. 108 Fig. 4.12. Effects of operating temperature on cell performance at various
values of AR………... 109 Fig. 4.13 Effects of operating temperature on cell performance at various
values of GDL thickness……… 110 Fig. 4.14 Experimental results of Lee et. al. (1999a) on the effect of
compression force on cell performance………. 111 Figure 5.1 (a) Computational Domain (b) Cathode Channel Configuration…... 129 Figure 5.2 (a) Oxygen mass fraction contours at cell voltage of 0.62V for
Figure 5.2 (b) Oxygen mass fraction contours at cell voltage of 0.22V for
outlet port S/C values of 0.67, 1 and 1.5……… 131 Figure 5.3 (a) Liquid water saturation contours at cell voltage of 0.62V for
outlet port S/C values of 0.67, 1 and 1.5…….……….. 132 Figure 5.3 (b) Liquid water saturation contours at cell voltage of (a) 0.62V (b)
0.22V for outlet port S/C values of 0.67, 1 and 1.5………... 133 Figure 5.4 (a) Solid and membrane phase potential contours at cell voltage of
0.62V for straight channel……….. 134 Figure 5.4 (b) Solid and membrane phase potential contours at cell voltage of
0.22V for straight channel……….. 135 Figure 5.5 (a) Activation overpotential contours at cell voltage of 0.62V for
outlet port S/C values of 0.67, 1 and 1.5……… 136 Figure 5.5 (b) Activation overpotential contours at cell voltage of 0.22V for
outlet port S/C values of 0.67, 1 and 1.5……… 137 Figure 5.6 (a) Current density contours at cell voltage of 0.62V for outlet port
S/C values of 0.67, 1 and 1.5………. 138 Figure 5.6 (b) Current density contours at cell voltage of 0.22V for outlet port
S/C values of 0.67, 1 and 1.5………. 139 Figure 5.7 (a) Transverse oxygen mass fraction and current density at
x=0.012m of CL middle plane with cell voltage of 0.62V and S/C
values of 0.67, 1.50……… 140 Figure 5.7 (b) Transverse oxygen mass fraction and current density at
x=0.048m of CL middle plane with cell voltage of 0.62V and S/C
values of 0.67, 1.50……… 141 Figure 5.8 (a) Transverse oxygen mass fraction and current density at
x=0.012m of CL middle plane with cell voltage of 0.22V and S/C
values of 0.67, 1.50……… 142 Figure 5.8 (b) Transverse oxygen mass fraction and current density at
x=0.048m of CL middle plane with cell voltage of 0.22V and S/C
values of 0.67, 1.50……… 143 Figure 5.9 Comparison of cell performance for various cathode channel
geometry designs………... 144 Figure 5.10 Effect of reactant stoichiometry on cell current density at
operating voltages of 0.22V and 0.62V for three cathode channel
NOMENCLATURE
C form drag constant
c molar concentration, mole m-3 D diffusivity, m2 sec-1
-1
F Faraday constant, 96500 C mole
g gravitational acceleration, m sec-2
H height, m i current density, A m-2 K permeability, m2 k relative permeability L length, m -1
M molecular weight, kg mol m catalyst loading, mg m-2 n number of species P pressure, Pa
q number of electron transferred r rate constant
R universal constant, 8.314 J mole-1 K-1 s saturation level
S source term T temperature, K
U vector form of mixture velocity, m sec-1
u scalar form of mixture velocity, m sec-1 V Voltage, V
w mass fraction of species W width of domain, m x molar fraction y switching function Greek symbols transfer coefficient β tortuosity δ dry porosity ε φ potential, V ϕ concentration dependence overpotential, V η
dynamic viscosity, N sec m-2 μ
ν kinematic viscosity, m2 sec-1 γ water content in membrane
contact angle θ electric conductivity, S m-1 σ surface tension, N m-1 ς
stoichiometry of hydrogen or oxygen ξ
Superscripts
c capillary Subscripts a anodic c cathodic cat catalyst cel cell cha channel con condensation eva evaporation F Forchheimer term g gaseous phase
j volumetric transfer current density k anode or cathode
l liquid phase m momentum
mas per unit mass of carbon supported catalyst particle mem membrane phase
p index for phases plt platinum s species sat saturation sol solid phase v per unit volume
w water
x x component y y component z z component index for species
CHAPTER 1
INTRODUCTION
1.1 Background
Fuel cell system directly converts chemical energy of fuel into electrical power.
Unlike the traditional internal combustion engine, it releases the energy through an
electrochemical reaction with the advantages of quietness, high efficiency, low
emission, and simplicity. Given these characteristics, it is likely to substitute current
power transformation methods which are facing the series problems of fossil oil
shortage and global climate change. The proton exchange membrane fuel cells
(PEMFCs), using solid polymers as working ions passages, have recently received
much attention and intensive study as a promising candidate on the applications of
vehicles, 3C equipments and other movable or stationary power systems. (Spiegel et
al., 1999; Barbir, 2005; Sammes, 2006).
1.1.1 Operating Principles of PEMFCs
During the fuel cell power conversion process, chemical energy stored in the
bounded atom electronic orbits is liberated and converged into electrical energy
macroscopically liberate electrons of hydrogen molecules which are converted into
protons simultaneously at the anode. As shown in Fig. 1.1, these two charged species
are transported through individual gateways by electric field functions and other
mechanisms. The electrons move along the external circuit and release electrical
energy through potential drop on the loading. Protons transport is driven by a set of
more complicated factors. The proton exchange membrane must be hydrated for ion
movement facilitation. It uses polytetrafluoroethylene (PTFE) as the structure
backbone and sulfonic acid side chains for the ion conduction purpose. Although
proton movement in the membrane is not well understood, suitable membrane water
content is beneficial (Nguyen and White, 1993). Additionally, with polar molecular
property, water is also carried by protons and moved from the anode to cathode during
cell operation. Concentration and pressure gradients through the membrane also have
a degree of influences on water transport. Water is produced in the cathode catalyst
layer due to cell reaction and, with the aforementioned effects, may lead to a flooding
problem and dramatically reduce cell performance at high current density. A typical
unit cell structure is drawn in Fig. 1.2.
1.1.2 Transport Phenomena and Cell Reaction in PEMFCs
PEMFC performance is dictated by factors such as transport component
processes in the PEMFC involve multiphase, multi-component flow, and heat and
mass transfer in porous media with electrochemical reactions. Reactants are delivered
and distributed evenly by grooved flow channels on bipolar plates. Despite the simple
geometry of flow channels, the actual flow field is intrinsically three-dimensional that
contains longitudinal, transverse, and through plane directions. The cathode catalyst
layer serves as oxygen sink as well as water source. The most challenging aspect of
modeling the fuel cell transport phenomena is that these processes are coupled with
complex electrochemical reactions.
When fuel cell delivering current and electrical energy, the associate energy
losses, or sometimes called overpotentials are unavoidable and require further
investigation. There are three main sources of energy losses; they are electrode
kinetics loss, ohmic loss and mass transport loss. When the reaction rate is slow, the
polarization curve is dominated by the electrode kinetics loss. However, as the current
density increases, the dominant mechanism of cell performance shifts from ohmic loss
to mass concentration loss as shown in Fig. 1.3. From another viewpoint, the ohmic
losses are mainly originated from the currents of electron and proton at their
individual passages, as depicted in Fig. 1.4. The difference between the two phase
potentials in catalyst layer is called activation overpotential, which is the driving force
circuit voltage minus the summation of these losses. Therefore, when the total
overpotential in the cell domain increases, the driving force for fuel cell reaction also
increases and more electric current is produced. However, the remaining cell voltage
to drive outer electric loading decreases. To obtain a high performance characteristic
of the PEMFCs, the quest of the involved correlation among various design parameter
as well as operating conditions has long been the major subject of the researchers.
1.2 Literature Survey
1.2.1 Modeling Development and Water/Thermal Management Investigation
Bernardi et al. (1990, 1991, 1992) and Springer et al. (1991) pioneered the
study of PEMFC modeling which utilized the lump approach and conservation theory
to develop unidirectional models through electrodes and membrane assuming
isothermal condition. The Bernardi’s model (1990) suggested reactant gas
humidification tuning to accommodate changing cell demands for water. Fuller et al.
(1993) considered a two-dimensional membrane-electrode assembly and examined
the water, thermal management in PEMFC. Membrane water concentration and gas
channel temperature were calculated for different heat transfer coefficients. Findings
showed that a lower heat transfer coefficient is responsible for membrane dehydration,
along-the-channel, two-dimensional model including various thermal management
schemes. Their model results showed that the heat exchanger design with counter
flow is more effective than co-flow and constant bulk temperature schemes. Besides
these works, the Row et al. model (2001) included variable membrane hydration and
water phase change in the electrodes. Baschuk et al. (2000) investigated variable
degree effect of water flooding in the cathode catalyst layer and/or cathode electrode
backing region on cell performance. Simpalee et al. (2000) formulated a
comprehensive three-dimensional model to predict temperature distribution inside a
straight channel PEMFC, and presented a group of source terms facilitating
commercial software application. Djilali et al. (2000) analyzed transport phenomena
in a PEMFC assessing non-isothermal and non-isobaric effects. Furthermore,
numerical results of Ju et al. (2005) with a single-phase and non-isothermal model
revealed that temperature rise within the cell could be as high as 13.75K at medium
reaction rate under certain conditions. The recent study of Wang et al. (2006) revealed
that a new heat removal mechanism resembling the heat pipe exists in the electrode.
1.2.2 Investigation of Cell Component Design
On the studied of the component designs, Giorgi et al. (1998) investigated
diffusion layer porosity influence on effective catalyst activity for the cathode
electrode performance for PEMFC were also conducted experimentally. An optimal
thickness of diffusion layer was found due to its lower electrical resistance. Decreased
performance with the thickest diffusion layer was attributed to a long reactant
transport passage and to the flooding problem. Jordan et al. (2000) reported the
carbon support and electrode loading effects on PEMFC performance. Various
parameter impacts, such as diffusion layer thickness, PTFE content and morphology,
as well as operating temperature and humidification condition on cell performance
were addressed. Lee et al. (1999a) asserted from experimental results that an optimal
bolt torque was obtained for a soft commercial diffusion layerbecauseof porosity and
electrical contact resistance changes. Their results also revealed that a cell with high
bore torque corresponding to a thin diffusion layer generates more current at a
moderate reaction rate, and a moderate bore torque performs better at a high reaction
rate for this kind of diffusion layer.
Several elaborate mathematical models were developed to provide qualitative
insights into the transport phenomena in a PEMFC, besides the experimental works.
He et al. (2000) presented a two-dimensional, two-phase, multi-component transport
model investigating gas and liquid water hydrodynamic effects on PEMFC
performance employing an inter-digitated flow field. Parametric study on electrode
density increases monotonically with electrode thickness increase, no matter what the
operating voltage. Furthermore, beyond this finite thickness, cell performance
decreases. This phenomenon was explained by reactant transport and liquid water
removal viewpoints. The effects of channel and shoulder width ratio (C/S ratio)
revealed that cell performance enhances with a greater C/S ratio. Natarajan et al.
(2001) proposed a half-cell, transient model for the cathode using the conventional
flow field to evaluate design parameter influences on fuel cell transport processes.
Contrary to He et al. (2000), they found, as diffusion layer thickness decreases at
lower cathode overpotential, the reactant transport is not affected by the liquid water
and at some diffusion layer thickness, current density loss at the shoulder region
outweighs channel region gain, leading to an optimum diffusion layer thickness.
However, a thinner diffusion layer thickness results in better performance and an
optimum thickness does not exist at a higher reaction rate.
In the two-dimensional half-cell model performed by West et al. (1996),
effects of rib sizing and geometry of GDL on current and water distributions within
the cell were reported. Special attention was given to the relation between rib width
and water content in the membrane. Kulikovsky et al. (1999) conducted the
parametric studies with high and low values of solid phase electrode conductivity
Their study concluded that at low solid phase conductivity, cell reaction concentrates
mainly at the rib region catalyst layer and the catalyst can be removed from the
channel region catalyst layer with little impact on total cell performance. Simplified
descriptions of the kinetic and mass transport model developed from Jeng et al. (2004)
concluded that GDL effectiveness decreases with reaction rate and increases with flow
channel width. Also, when GDL porosity is low, cell performance decreases with an
increase in GDL thickness. Sun et al. (2005a, 2005b) conducted a series of
investigations on catalyst layer structural parameter influences with an improved
cross-the-channel model. Various design and operating factors such as C/S ratio,
orthotropic GDL conductivity, and electrode compression effects were investigated in
the model while charge transfer and oxygen diffusion were simultaneously taken into
account. Gas and electron transport plays an essential role in cathode performance in
that both electric conductivity and GDL thickness could be vital parameters for
transport component optimal design, as conclusions indicated.
Recently, Yan and co-workers (Yan et al. 2004; 2005; Liu et al. 2005; 2006)
investigated various vital issues of the PEMFCs, including the water and thermal
management in PEM, transient behaviors of reactant transport, baffle-blocked channel
and channel design with tapered configuration. The conclusions in the study of flow
response and better performance can be reached by a larger channel depth ratio.
Moreover, a new flow field with baffles in the tandem array was proposed to enhance
the reactant transport and cell performance. The beneficial effects of the presence of
baffles are notable with the increase of width and/or number of baffles in the tandem
array. The simulation work of a tapered flow channel design revealed that the cell
performance can be noticeably promoted with the fuel channel tapered at a higher
reaction rate. Meanwhile, under this operating condition, the influence of liquid water
on the cell performance is significant.
1.2.3 Numerical Method Development
With the fast development of the hardware and software of microcomputers,
most groups researching cell performance simulation have recently begun to apply
commercial computational fluid dynamics (CFD) algorithms in their study with
integration of several conjugate problems such as potential fields, electrochemical
reaction and two-phase flow. Hence, a more rigorous three-dimensional simulation
has been made possible for investigating the complex transport phenomena. The
species and properties in the physical domain can be described in greater detail, and
the numerical results are more reliable than one- or two-dimensional models (Dutta et
al., 2000; Dutta et al., 2001; Berning et al., 2002; Berning et al., 2003; Wang et al., 2003; Um et al., 2004).
1.3 Objectives
The above literature review shows that there is still much necessity to
investigate the complex electrochemical and transport phenomena in the PEMFCs.
Also, the relations between local cell reaction and physical properties are still not well
understood. In this study, a multi-component, multi-phase, three-dimensional model
of the PEMFCs is developed and numerically solved to enhance the understanding of
the underlying characteristics of the cell reactions as well as various important factors
that dominate the polarization curves of the PEMFCs.
1.4 Outlines
This dissertation is organized as follows. Chapter 2 introduces the model
development and numerical method for solving the transport phenomenon and
electrochemical reaction of the PEMFCS. Basic assumptions employed in the
modeling process are also presented. Chapter 3 addresses the effects of existing
temperature and humidification level gradients on cell boundaries are explored by the
developed model. Polarization curves are presented for various scenarios of these
water and thermal management schemes. The mechanisms that cause the variation of
the performance curves are discussed. Also, the interrelations among the physical
design on the local physical properties as well as cell performance are described in
Chapter 4. Two important design parameters, channel aspect ratio and gas diffusion
layer thickness are examined in great detail. Transverse distributions of various model
variables as well as local reaction rate are plotted and discussed. Chapter 5 introduces
the investigation of the electrochemical reaction and performance of PEMFCs with a
novel cathode flow channel shape. Through the assignment of various values of
shoulder/channel (S/C) ratio at cathode outlet port, the channel configurations can be
classified as convergent, straight and divergent shapes. Variations of various model
transport variables as well as cell performance are proposed and discussed.
Mechanism that dominates local cell reaction is examined through the comparison of
the variation trends among local current density, oxygen concentration and potential
fields. In Chapter 6, the conclusions of this investigation are drawn and suggestions
e
-e
-e
-e
-e
-Cathode Reaction
Anode Reaction
H
+H
+H
+H
2H
2H
2O
2O
2O
2e
-e
-e
-e
-e
-e
-H2O
H
2O
H
2O
Cathode Flow Field
Anode Flow Field
PEM
e
-e
-e
End plate Current collector Bipolar plate Diffusion media Catalyst layer Membrane Catalyst layer Diffusion media Bipolar plate Current
collector End plate
Electrode Kinetics
Dominated Ohmic Polarization Dominated
Cell V o ltage Mass Transport Dominated Current Density
Anode PEM Cathode
Total Overpotential
Cell Potential Open Circuit Voltage
Solid Phase Potential
Membrane Phase Potential Activation Overpotential
CHAPTER 2
MATHEMATICAL MODELING
The computational fluid dynamic (CFD) method plays an important role on
the resolution of the flow and temperature fields of the thermal-fluid problems. As the
physical domain in a unit PEMFC is extremely thin, usually within the mm scale for
the main components, it is extremely difficult to measure the local values of various
important physical properties such as species concentration, velocity, temperature and
current density. Based on the conservation law, several governing equations
describing the inter-correlated relations of various properties can be developed and
solved by numerical algorithm, providing essential and fundamental information to
the engineer working on the technique development of fuel cell.
In this chapter, the general modeling framework employed in the subsequent
study is presented. Equations depicting the electrochemical reactions as well as
current transport are incorporated with the conservation equations of the CFD.
Relations featuring the reaction kinetics, membrane conductivity and the transport
parameters of the reactant and the product are also provided along with proper
2.1 Model Description
The general structure is periodical and symmetric for a fuel cell with straight
flow channel. Therefore, as illustrated in Fig. 2.1, the physical region containing nine
major components with one single channel and two half shoulders are considered in
modeling. The anode, and cathode catalyst layers (CLs) and membrane are regarded
as separate entities, despite the ultra-thinness of the CLs. Two GDLs are compressed
by current collector ribs(shoulders) on each cell side to deliver reactants to the
reaction sites under the ribs. The spaces in the bipolar plate (BP) grooves, commonly
called the anode and cathode channels, are passages in which gases are transported
throughout the cell. This work describes the following transport phenomena and
reaction in a PEMFC:
z Three-dimensional convection and diffusion in flow channels and porous media;
z Electrochemical reactions in the catalyst layers of the anode and the cathode;
z Multi-species mass transport;
z Formation and transport of liquid water;
z Electronic current transport through bipolar plates and electrodes;
z Positive ionic current transport through the membrane and catalyst layers.
Basic assumptions are made to simplify actual cell conditions in the theoretical
model and thus facilitate the modeling approach of transport component and operating
condition influences on transport phenomena and cell performance. The following are
the most important:
z The Reynolds number of the fluid is below 100 due to low mixture velocity,
laminar flow is considered;
z The GDLs, CLs and membrane are modeled as porous media;
z Each component has isotropic transport properties;
z The gaseous phase of the working fluid behaves as an ideal gas;
z The electric potential on the outer surface of each bipolar plate is constant;
z No charge accumulates in the electrodes and the domain is electrically neutral;
z The system operates in a steady state.
2.3 Governing Equations
A unified domain approach is employed to avoid tedious boundary condition
appointments on the component interface in the following formulations. Instead,
proper physical and transport properties such as porosity and permeability are
designated on each distinct domain. This method can significantly simplify the model
interfaces between different layers are not required (Gurau et al., 1998; Um et al.,
2000; 2004; You et al., 2002; Wang et al., 2003).
2.3.1 Continuity Equation
The continuity equation is used to describe the mass conservation of mixture
throughout the domain:
(
εeffρ)
=0 ⋅∇ U (2-1)
where the mixture density ρ is the volume-weighted average of the phase
mass concentration for the consideration of the two-phase flow (Wang et al., 2001). It
can be expressed as:
(2-2) ) s 1 ( s g l +ρ − ρ = ρ
where s stands for the saturation level in porous medium, representing the
volume fraction of the pore occupied by the liquid phase and can be given as:
g l l v v v s + = (2-3) 2.3.2 Momentum Equation
The generalized Navier-Stokes equation is introduced to represent momentum
conservation of the mixture; a source term is included to consider the additional drag
forces in the porous medium (Mazumder et al., 2003; Wang et al., 1993):
(2-4)
(
ρεeff)
=−εeff∇P+∇⋅⎛⎜⎝εeffμeff∇ ⎠⎞⎟+εeffρk +Sm⋅
where represents the effective porosity given by ; is
the effective viscosity of the mixture;
) s 1 ( eff =ε − ε μeff eff ε
ρk is the kinetic density; is the sum of
Darcy and Forchheimer drag forces associated with the morphology (porosity and
permeability) of the porous medium:
m S
)
(
rl l)
(
rg g g l eff / k / k ) s 1 ( s μ ν + ν − ρ + ρ = (2-5) g rg g l rl l k k k ν ν ρ + ν ν ρ = ρ (2-6) ) C K ( K ) ( S eff F eff 2 eff m U U ρ ε + μ ε − = (2-7)The momentum equation automatically becomes the Darcy equation in the
porous area where the magnitudes of convection and diffusion term are extremely
small. In Eq. (5), the relative permeabilities of the liquid and gas phase can be
expressed as a function of saturation (Wang et al., 2001):
(2-8) 3 rl s k = (2-9) 3 rg (1 s) k = − 2.3.3 Mass Transport
The mass fraction of each species in the gas mixture can be given as follows:
α β δ αβ − = β α ⎥+ ⎦ ⎤ ⎢ ⎣ ⎡ ∇ ε ρ ⋅ ∇ = ⎟ ⎟ ⎠ ⎞ ⎜ ⎜ ⎝ ⎛ ν ν ⋅ ∇
∑
n 1 eff s 1 g rg effρw k D ( ) w S ε U (2-10)Notably, the Bruggemann correction is applied in this equation to consider the
medium. The multi-component diffusion coefficient is a function of species
concentration and binary diffusion coefficient, the latter can be written as (Cussler,
1997; Wangard et al., 2001): αβ D δ γδ γδ δ γ γδ ψ Ω ⎥ ⎥ ⎥ ⎦ ⎤ ⎢ ⎢ ⎢ ⎣ ⎡ ⎟ ⎟ ⎠ ⎞ ⎜ ⎜ ⎝ ⎛ + = P M 1 M 1 T 0018583 . 0 2 1 2 3 D (2-11)
The source term defines the creation or consumption of species at the
electrode catalyst sites and is given by: α s S F 4000 M S Ss,o2 = ,jc O2 (2-12) l O 2 H c ,j O 2 H , s S F 2000 M S S = − + (2-13) F 2000 M S Ss,H2 = ,ja H2 (2-14) 2.3.4 Electrochemical Reaction
At the electrode catalyst sites, reactants undergo an electrochemical reaction.
Hydrogen is oxidized and oxygen reduced at the anode and the cathode, respectively.
These two reactions are driven by the potential difference between the solid phase and
the electrolyte phase, called the activation overpotential η . The activation
overpotential in the anode tends to energize the electrons lost by hydrogen; at the
Bulter-Volmer equation describes this important phenomenon and is related to the
source terms in Eq. (2-12)-(2-14):
⎥ ⎦ ⎤ ⎢ ⎣ ⎡ ⎟⎟ ⎠ ⎞ ⎜⎜ ⎝ ⎛−β η − ⎟⎟ ⎠ ⎞ ⎜⎜ ⎝ ⎛β η ⎟ ⎟ ⎠ ⎞ ⎜ ⎜ ⎝ ⎛ = α ϕ α α RT F exp RT F exp c c i A S k,a k k,c k ref , k , ref v k ,j (2-15)
where is the effective reaction surface area of the catalyst particle and is closely
related to the morphology and platinum loading of the catalyst layer. An expression
for the relationship among these parameters is written as:
V A cat plt mas v H m A A = (2-16)
where is the catalyst area per unit mass of catalyst particle, represents
the catalyst loading and stands for the catalyst layer thickness.
mas A mplt cat H k , ref i
The term in Eq. (2-15) is the exchange current density, which
characterizes the catalyst layers. Due to sluggishness of oxygen reduction reaction at
the cathode, its value is several orders of magnitude smaller than that at the anode.
Hence, the cathode exhibits significant activation overpotential during cell operation.
The experimental results of Parthasarathy yielded the following relation
(Parthasarathy et al., 1992): ⎟ ⎠ ⎞ ⎜ ⎝ ⎛ − = T 4001 507 . 3 exp 10 iref,o2 4 (2-17) 2.3.5 Potential Fields
Two charged species, electrons and protons, are transported in the fuel cell and
subjected to individual driving forces determined by the potential gradient. The
negatively charged electrons flow through the catalyst layer, the gas diffusion layer,
and the bipolar plate; the positively charged protons flow goes through the catalyst
layer and the membrane. The catalyst layer is a source of charges at the anode and a
sink at the cathode. The assumption of electro-neutrality yields the following
expressions for electrical current conservation in the catalyst layer:
(2-18)
(
−σsol∇φsol)
=−S,jk ⋅ ∇(
−σmem∇φmem)
=S,jk ⋅ ∇ (2-19)Outside the catalyst layer, no current sink or source is presented and the right
hand sides of Eqs. (2-18) and (2-19) are equal to zero, suggesting that no species is
created or consumed; electrical current conservation is therefore easily understood.
In the membrane, the ionic conductivity σmem is strongly related to the water contentγ , defined as the ratio of the number of water molecules to the number of the
charge sites (Springer et al., 1991):
⎭ ⎬ ⎫ ⎩ ⎨ ⎧ ⎥⎦ ⎤ ⎢⎣ ⎡ − − γ = σ ) T 1 303 1 ( 1268 exp ) 00326 . 0 005139 . 0 ( mem (2-20)
An empirical relationship between the water content in the membrane and the partial pressure of the water is:
(2-21) ⎪ ⎪ ⎩ ⎪ ⎪ ⎨ ⎧ ≤ < + ≤ < + − + = γ 3 a 1 for a 4 . 1 6 . 12 1 a 0 for a 36 a 85 . 39 a 81 . 17 043 . 0 2 3
where a is the water activity and is given by: sat w p p x a= (2-22)
In the above equation, the saturation pressure varies with temperature and can
be determined from the thermodynamic table or using the following empirical
expression: (2-23) 3 7 2 5 sat 10p 2.1794 0.02953T 9.1837 10 T 1.4454 10 T log =− + − ⋅ − + ⋅ −
where T is in unit of and is in unit of bars. This formulation can be utilized
with a relative error less than 1.5 percent in the range of 20 to 100 .
C
o
sat
P
oC oC
2.3.6 Liquid Water Transport
During fuel cell operation, water partial pressure in the electrode may exceed
its saturation pressure if the local water concentration is high. Therefore, liquid water
is possibly formed and occupies the electrode pore space. Operating the cell at a high
reaction rate may cause severe mass transport overpotential because the diffusion
species are blocked. Additionally, extremely small pores in the fuel cell porous media
cause the capillary force to dominate liquid water transport in the hydrophilic surfaces.
Smaller pores correspond to stronger capillary forces. However, the actual expression
of this force cannot be formulated because the real liquid-gas interface configuration
recovery field and adapted by Wang et al. (1992) to study two-phase flow transport in
capillary porous medium, is applied :
)
(
l l rg g rl g l rg rl c eff l l rl eff S k k k Kk s D k ⎟⎟+ ⎠ ⎞ ⎜ ⎜ ⎝ ⎛ ν + ν ρ − ρ − ∇ ε ⋅ ∇ = ⋅ ∇ + ⎟⎟ ⎠ ⎞ ⎜⎜ ⎝ ⎛ ν ν ρ ε ⋅ ∇ U N g (2-24)where represents the liquid water flux due to electro-osmosis drag in the
membrane, it is associated with proton transport and is a function of local current
density and the electro-osmotic drag coefficient. The first term on the right-hand side
describes the capillary pressure effect, whereas the second term is the gravitational
separation between the liquid and gas phases of water. The variable D is the
capillary diffusion coefficient and can be expressed as a function of saturation level,
surface tension, and permeability (Wang and Beckermann, 1997; You and Liu, 2002):
l N c
(
)
l rg g rl 2 2 1 eff c rg rl c k k 966 . 0 s 338 . 3 s 789 . 3 K cos k Kk D ν + ν ⎥ ⎥ ⎥ ⎦ ⎤ ⎢ ⎢ ⎢ ⎣ ⎡ − + − ⎟⎟ ⎠ ⎞ ⎜⎜ ⎝ ⎛ ε θ ς − = (2-25)where , are the relative permeabilities associated with pore space reduction
by the co-existence of multiphase fluids.
rl
k krg
The last term in Eq. (2-24) is introduced to account for liquid water
condensation or evaporation, and can be expressed as (He et al., 2000): ) y 1 )( p p x ( s r y ) p p x ( RT x r M
S eff w w sat eva eff l w sat
con l
l − + ε ρ − −
ε
where y is a constant with unity or zero value depending on water species
condensation or evaporation scenarios in the porous medium.
2.3.7 Energy Equation
The temperature field of the cell domain can be obtained from solving energy
equation which describes the thermal energy conservation. Except for inlet and outlet
boundaries, enthalpy generation is considered from three sources; joule heating due to
current transport in the medium, electrochemical reaction irreversibility due to
over-potential at electrodes, and latent heat of water due to phase change. Many
physical properties are closely related to temperature in the cell domain. First, mixture
velocities at channel inlet ports for a fixed reactant stoichiometry and a given cell
geometry are primarily decided by their thermodynamic states subsequently dictated
by mixture temperatures. Secondly, electrochemical reaction kinetic in the catalyst
layer and membrane conductivity are also influenced by local temperatures. Thirdly,
the temperature field is also responsible for water formation or evaporation.
Consequently, it has certain effects on reactant concentration and membrane water
content. The generalized steady state energy equation can be expressed as:
h j n 1 1 -n 1 eff T ρD w h ) : S S ( ) h ( + σ ⋅ + η − ∇ ε + ∑∑ ∇ + ∇ κ ⋅ ∇ = ερ ⋅ ∇ = α β= αβ β α i i U U τ (2-27)
where the first two terms on the right hand side represent the conduction energy and
and the fifth terms describe the electrical related thermal effects where Sj is the
volumetric current density in catalyst layer that can be expressed by the Bulter-Volmer
equation. The last term results from the consideration of phase change when water
evaporation or condensation occurs in the cell domain and is presented in the next
section following the phase change formulation. Detail expansion of this equation in
scalar form is expressed in App. A.
2.4 Boundary Conditions
2.4.1 Flow Field Boundary Conditions
Model boundaries fall into three categories as indicated by Fig. 2.1 -
symmetric boundaries (SBs), impermeable boundaries (IBs), and channel boundaries
(CBs). The SB conditions are imposed on both transverse sides of the model and
physical quantities such as mass flux or momentum flux have zero gradients. The
Neumann conditions are also assigned on IB, the top (or bottom) and side surfaces of
the channels adjacent to the bipolar plates. Additionally, non-slip conditions are
applied for the IB velocity fields.
Unlike these simple boundary conditions, the CB conditions importantly
velocities, thermodynamic states, and mass fractions of mixture are specified
according to the desired operating scenarios and mixture of interest. Based on the
stoichiometric flow ratio, the inlet velocity of the reactant is:
k in , k k , w , sat cha cha in , k cha cel k P x P P 1 H qFW RT L IW v α ⎟⎟ ⎠ ⎞ ⎜⎜ ⎝ ⎛ − ξ = (2-28)
The mass fractions of the species on the CB are specified according to
operating pressure and fully saturated humidification condition. Dalton’s law and the
ideal gas law yield the molar fraction of individual species. The mass fraction, used in
the preceding formulation, is given by:
∑
= j J j i i i M x M x w (2-29)2.4.2 Potential Field Boundary Conditions
Specific solid phase potential is assigned to each bipolar plate outer surface in
addition to these transport variables. This value is generally set to zero on the anode
BP outer surface, and a cell total overpotential is set on the cathode BP. Meanwhile, a
membrane phase potential zero gradient is applied at the interface between GDL and
CL, representing a protonic current absence through this interface because of the lack
of a conducting medium. This method yields the local current density in the cell from
ohmic law; it also accurately yields the catalyst layer activation overpotential. The cell
tot oc l ce V
V = +η (2-30)
where is the total cell overpotential and is the open circuit voltage given
by (He et al, 2000): tot η Voc T 0025 . 0 2329 . 0 Voc = + (2-31) 2.5 Method of Solution 2.5.1 Calculation Procedure
The nonlinearity and coupling in the model formulation eliminate an analytical
solution possibility. The forgoing transport equations are numerically solved using the
commercial computational fluid dynamic code CFD-ACE+, based on the control volume formulation and the SIMPLE algorithm (Patankar, 1980; CFD-ACE TM User Manual, 2004; Liu et al., 2005; Soong et al., 2005). The numerical flow chart of
present investigation is shown in Fig. 2.2. The calculation is regarded to be converged
if the normalized residual of each variable is less than 10e-4.
2.5.2 Model Validation
Three structure mesh systems- 60x30x12, 80x40x16, and 90x48x18 are
constructed to explore numerical result dependence on computational cell number.
Base model geometries and operating conditions are listed in Table 2.1. Model
component electrochemical parameters and transport properties, obtained mainly from
Weng et al., 2005; Hum and Li, 2004; Nguyen et al., 2004;
http://www.etek-inc.com/home.php.), are listed in Table 2.2. Numerical calculations
are performed on a Pentium IV 2.4GHz PC with a 1G RAM. The mesh system
(80x40x16) is adopted because current density values are satisfactory with an error
range of 2% when using base model geometries and parameters of these two Tables,
please see Table 2.3. Based on the reported operating conditions and component
geometries of Wang et al.’s report (Wang, Husar, Zhou and Liu, 2004), data in Figure
Table 2.1 Cell geometries and operating conditions of base model
Geometry and condition Value Unit
Domain length 50 mm
Domain width 1.6 mm
Gas channel width 0.8 mm
Domain height 4.303 mm
Gas channel height 0.8 mm
Diffusion layer height 0.254 mm
Catalyst layer height 0.01 mm
Membrane height 0.175 mm
Molar ratio of cathode side dry air (N /O ) 2 2 79/21
Reactant relative humidity 100%
Reactant stoichiometry 3
Cell back pressure 2 atm
Table 2.2 Electrochemical parameters and transport properties
Parameters and Properties Value Unit Sources
(Um et al., 2000)
Porosity of the diffusion and catalyst layer 0.4
(Um et al., 2000)
Porosity of the membrane 0.28
(CFD-ACE TM User
Manual, 2004) 2
Permeability of the diffusion and catalyst layer 2.3E-11 m
(CFD-ACE TM User
Manual ,2004) 2
Permeability of the membrane 1.0E-18 m
(Mazumder and Cole, 2003) Tortuosity of the diffusion and catalyst layer 1.5
(Mazumder and Cole, 2003)
Tortuosity of the membrane 3
(He et al., 2000) -1
Condensation rate constant 100 sec
(He et al., 2000) -1
sec-1
Evaporation rate constant 100 atm
(Marr and Li, 1999) 0.5
Concentration dependence of H2
(Marr and Li, 1999)
Concentration dependence of O2 1
(Mazumder and Cole, 2003) Transfer coefficients at anode (anodic and cathodic) 0.5
(Mazumder and Cole, 2003) Transfer coefficients at cathode(anodic and cathodic) 1.5
(Hum and Li, 2004) -1
Electrical conductivity of electrode 114 S m
-2
Catalyst loading 0.4 mg cm
http://www.etek-inc.c om/home.php. 2 -1
Catalyst surface area per unit mass 100 m g
(Natarajan and Nguyen, 2001)
Contact angel 0 degree
(Nguyen et al., 2004) -3
Exchange current density for anode reaction 1.4E5 A cm
(Nguyen et al., 2004) -3
Reference concentration of oxygen 3.39E-6 mol cm
(Nguyen et al., 2004) -3
Table 2.3 Results of three computation grid systems based on the parameters in Table 2.1 and Table 2.2
90x48x18
Grid 60x30x12 80x40x16
Cell
Voltage density current (A/cm
cpu
time relative current density (A/cm
cpu
time relative current time cpu
error error density
(A/cm (V) 2 2 2 ) (100%) ) (100%) ) 0.47 0.866 17324 3.12 0.885 43989 0.99 0.894 105114 0.57 0.645 14657 3.84 0.661 37643 1.43 0.670 89178 6113 3.81 31270 1.44 0.67 0.433 0.444 0.450 79827 0.77 0.239 4688 3.51 0.245 24386 1.33 0.248 56722 0.87 0.075 3467 2.67 0.077 20043 1.00 0.077 47062
1 Computational domain 2 Cathode bipolar plate
3 Cathode flow channel
4 Cathode gas diffusion layer 5 Cathode catalyst layer
6 Membrane
7 Anode catalyst layer 8 Anode gas diffusion layer
9 Anode bipolar plate
10 Anode flow channel
START
Set up grid system and initial values
Impose BCs
Refresh model variables Calculate transport properties and
correlation functions
Calculate velocity and pressure fields
Calculate other scalar variables
Fig. 2.2. Numerical flow chart of current study Post processing
Converged? no
yes
0 0.4 0.8 1.2 1.6 Current Density (A/cm2)
0.4 0.6 0.8 1 Cell Po ten tial (V)
Exp. result of Wang et al. at 323K Model result of Wang et al. at 323K Current model result at 323K Exp. result of Wang et al. at 343K Model result of Wang et al. at 343K Current model result at 343K