Room-temperature NIR phosphorescence of new
iridium (III) complexes with ligands derived from
benzoquinoxaline
1
Hsing-Yi Chen, Cheng-Han Yang, Yun Chi, Yi-Ming Cheng, Yu-Shan Yeh,
Pi-Tai Chou, Hsi-Ying Hsieh, Chao-Shiuan Liu, Shie-Ming Peng, and
Gene-Hsiang Lee
Abstract: A new series of new iridium (III) complexes (1–5) bearing ligands derived from benzoquinoxaline were
de-signed and synthesized. X-ray structural analyses of 1 reveal a distorted octahedral geometry around the Ir atom in which the pyrazolate chelate is located opposite to the cis-oriented carbon donor atoms of benzoquinoxaline, while the benzoquinoxaline ligands adopt an eclipse configuration and their coordinated nitrogen atoms and carbon adopt trans-and cis-orientation, respectively. Complexes 1–5 exhibit moderate NIR phosphorescence with peak maxima located at around 910–930 nm. As supported by the TDDFT approach, the transition mainly involves benzoquinoxaline3π–π* intraligand charge transfer (ILCT) and metal (Ir) to benzoquinoxaline charge transfer (MLCT) of which the spectros-copy and dynamics of relaxation have been thoroughly investigated. The relatively weak NIR emission can be tenta-tively rationalized by the low energy gap of which the radiationless deactivation may be governed by nearly
temperature-independent, weak-bonding motions in combination with a minor channel incorporating small torsional mo-tions associated with phenyl ring in the benzoquinoxaline sites.
Key words: phosphorescence, NIR, iridium, benzoquinoxaline, isoquinoline, bipyridine, pyrazolate, acetylacetonate. Résumé : On a préparé une nouvelle série de complexes de l’iridium(III) (1–5) portant des ligands dérivés de la
ben-zoquinoxaline. L’analyse des données structurales du composé 1, obtenues par diffraction des rayons X, révèle la pré-sence d’une géométrie octaédrique déformée autour de l’atome d’iridium dans laquelle le chélate pyrazolate se trouve à l’opposé des atomes de carbone donneurs de la benzoquinoxaline orientés en cis, alors que les ligands benzoquinoxa-line adoptent une conformation éclipsée et que leurs atomes d’azote coordonnés adoptent respectivement des orienta-tions cis et trans. Les complexes 1–5 présentent de la phosphorescence modérée dans le proche infrarouge (PIR) avec un pic maximal situé autour de 910 à 930 nm. Tel que le prédit l’approche TDDFT, la transition implique principale-ment un transfert de charge interligand (TCIL) 3π–π* de la benzoquinoxaline et un transfert de charge du métal (iri-dium) à la benzoquinoxaline (TCML) dont on a étudié à fond la spectroscopie et la dynamique de relaxation. L’émission relativement faible dans le proche infrarouge pourrait être rationalisée en fonction d’une discontinuité de faible énergie de laquelle la désactivation sans rayonnement pourrait être orientée par des mouvements de faible liaison, pratiquement indépendants de la température, en combinaison avec une voie mineure qui incorporerait de faibles mou-vements de torsion du noyau phényle dans les sites benzoquinoxalines.
Mots clés : phosphorescence, PIR, iridium, benzoquinoxaline, isoquinoléine, bipyridine, pyrazolate, acétylacétonate.
[Traduit par la Rédaction] Chen et al. 318
Received 30 June 2005. Published on the NRC Research Press Web site at http://canjchem.nrc.ca on 21 March 2006.
This paper is dedicated to Professor Arthur J. Carty; he has been our mentor, collaborator, and friend for the past 15 years. H.-Y. Chen, C.-H. Yang, and Y. Chi.2Department of Chemistry, National Tsing Hua University, Hsinchu 300, Taiwan.
Y.-M. Cheng, Y.-S. Yeh, P.-T. Chou,3S.-M. Peng, and G.-H. Lee. Department of Chemistry and Instrumentation Center, National Taiwan University, Taipei 106, Taiwan.
H.-Y. Hsieh.4Department of Food Nutrition, Chung Hwa College of Medical Technology, Tainan 717, Taiwan.
C.-S. Liu. Department of Chemistry, SooChow University, Taipei 111, Taiwan.
1This article is part of a Special Issue dedicated to Professor Arthur Carty. 2Corresponding author (e-mail: [email protected]).
3Corresponding author (e-mail: [email protected]).
Introduction
Transition metal complexes, which exhibit strong emis-sion in fluid solution at room temperature, have been exten-sively investigated owing to their fundamental interest and key roles in the design of novel systems for solar energy conversion (1), telecommunication and other optical technol-ogies (2), as well as fabrication of high efficiency phospho-rescent organic light emitting devices (OLEDs) (3). So far, most of the reported luminescent metal complexes emit in the visible region, while studies of emission properties in the NIR region are relatively rare. One reason lies in that de-creasing the energy gap toward NIR may trigger a much faster radiationless decay channel because of the interaction between ground and emitting states, i.e., the so-called en-ergy gap law, giving rise to poor quantum efficiencies (4).
The first class of complexes showing notable NIR lumi-nescence should be credited to the lanthanide complexes in-corporating the Nd(III), Yb(III), and Er(III) ions (5). Sharp emission signals for lanthanide complexes are expected sim-ply because the 4f orbitals in the lanthanide elements are buried deep within the atom and would not be seriously cou-pled with the ligand vibration motions, as opposed to the broad d–d transitions of the transition metals. As a second class, the Pd porphyrinate types of complexes are docu-mented as exhibiting moderate NIR phosphorescence in the fluid state at room temperature, a property which is desirable for application as oxygen sensors for biomedical applica-tions in vivo (6). The third class consists of the polypyridyl complexes involving the Re(I), Ru(II), and Os(II) metal ions with the d6 electronic configuration (7). Their systematic synthesis has remained as the outstanding issue in view of applications. These complexes typically absorb appreciably in the high energy region of the spectra, accompanied by the MLCT absorptions at lower energy, as well as a certain de-gree of contribution from direct3MLCT absorption, a result of the heavy atom enhanced spin-orbit coupling. Accord-ingly, NIR phosphorescent emissions are achievable for sys-tems with extended electronic delocalization between the metal and ligands in both ground and excited states, making them important as light harvesting sensitizers for solar cell applications.
As an extension of our contribution to the third-row metal phosphorescent materials, we have embarked on the devel-opment of Ir(III)-based metal complexes showing detectable luminescence in the NIR spectral region. The key designing feature is to utilize a diphenyl substituted benzoquinoxaline ligand that allows formation of a highly extendedπ conjuga-tion. The choice of Ir as the central atom renders the advan-tages of linking the benzoquinoxaline ligand through facile orthometalation, affording a desirable metal–chelate bonding interaction and a presumably rigid molecular skeleton. Along this line, the emission gaps are expected to shift significantly toward the lower energy, i.e., the NIR region, without drastic reduction to the corresponding emission efficiency.
Experimental section
General experiments
The pyrazole ligands, 3-trifluoromethyl-5-(2-pyridyl)pyra-zole (fppz)H and
1-(5-tert-butyl-2H-pyrazol-3-yl)isoquino-line (bpiq)H, were prepared according to the literature meth-ods (8). Commercially available chemicals were used with-out further purification. All reactions were monitored by TLC with Merck silica gel plates (0.20 mm with fluorescent indicator UV254). Compounds were visualized with 254 or 365 nm UV irradiation. Column chromatography was car-ried out using silica gel purchased from Merck (230– 400 mesh). Mass spectra were obtained on a JEOL SX-102A instrument operating in electron impact (EI) or fast atom bombardment (FAB) mode. 1H and 13C NMR spectra were recorded on a Varian INOVA-500 instrument; chemical shifts are quoted with respect to the internal standard tetra-methylsilane for 1H and 13C NMR data. Elemental analysis was carried out with a Heraeus CHN-O rapid elementary an-alyzer.
Cyclic voltammetry (CV)
CV measurements were performed using a BAS 100 B/W electrochemical analyzer. The oxidation and reduction mea-surements were recorded, respectively, in anhydr. CH2Cl2 and anhydr. THF containing 0.1 mol/L TBAPF6 as the sup-porting electrolyte, at a scan rate of 100 mV s–1. The poten-tials were measured against a Ag/Ag+ (0.01 mol/L AgNO
3) reference electrode with ferrocene as the internal standard.
Preparation of 2,3-diphenyl benzo[g]quinoxaline
An anhydrous ethanol solution (30 mL) of 2,3-naphthal-enediamine (1.0 g 6.33 mmol) and benzil (1.34 g, 6.33 mmol) was heated to reflux for 5 h. Then the solution was gradually cooled to room temperature. The solid depos-ited from solution was then filtered, washed with a few drops of ethanol, and dried in vacuum overnight to afford 1.8 g of yellow-green 2,3-diphenyl benzo[g]quinoxaline (5.42 mmol, 86%), denoted as (dpbq)H. The yellow-colored derivative 2,3-di-p-tolyl benzo[g]quinoxaline, (dtbq)H, was obtained from 4,4′-dimethylbenzil in a similar fashion.
Spectral data for (dpbq)H
1H NMR (400 MHz, CDCl
3, 298 K)δ: 8.72 (s, 2H), 8.07 (dd, 2H, JHH= 6.4, 2.8 Hz), 7.56 (d, 4H, JHH= 7.2 Hz), 7.52 (dd, 2H, JHH = 6.4, 2.8 Hz), 7.38–7.32 (m, 6H). MS (EI)
m/z: 332 [M+]. Anal. calcd. for C24H16N2: N 8.43, C 86.72, H 4.85; found: N 8.48, C 86.63, H 5.05.
Spectral data for (dtbq)H
1H NMR (400 MHz, CDCl
3, 298 K)δ: 8.69 (s, 2H), 8.09– 8.06 (m, 2H), 7.54–7.51 (m, 2H), 7.46 (d, 4H, JHH= 10 Hz), 7.15 (d, 4H, JHH = 10 Hz), 2.37 (s, 6H). MS (EI) m/z: 360 [M+]. Anal. calcd. for C26H20N2: N 7.77, C 86.64, H 5.59; found: N 7.41, C 86.65, H 5.26.
Preparation of [(dpbq)2IrCl]2
The chloride-bridged complex [(dpbq)2IrCl]2 was synthe-sized according to the method reported by Nonoyama (9), involving treatment of IrCl3·3H2O (1.0 g, 2.84 mmol) with (dpbq)H (2.83 g, 8.5 mmol) in 2-methoxyethanol (30 mL) for 24 h. Then the solution was treated with water (30 mL) to induce precipitation of a dark brown solid. The solid was then filtered, washed with methanol, and dried under vac-uum (1.8 g, 1.22 mmol, 71%).
Preparation of [(dtbq)2IrCl]2
On the basis of a procedure similar to that described for [(dpbq)2IrCl]2, the p-tolyl-substituted complex [(dtbq)2IrCl]2 was synthesized in ~75% yield.
Preparation of [(dpbq)2Ir(fppz)] (1)
A mixture of [(dpbq)2IrCl]2 (300 mg, 0.168 mmol), 3-trifluoromethyl-5-(2-pyridyl)pyrazole (fppzH, 80 mg, 0.38 mmol), and Na2CO3 (100 mg, 0.94 mmol) in 2-methoxyethanol (20 mL) was heated to reflux for 4 h. An excess of deionized water was added after cooling the solu-tion to room temperature (RT). The precipitate was collected by filtration and washed with methanol (10 mL), followed by diethyl ether (10 mL). Black crystals of [(dpbq)2Ir(fppz)] (1) were obtained from a mixture of CH2Cl2and methanol at RT (210 mg, 0.19 mmol, 58%).
Spectral data for 1
1H NMR (400 MHz, CDCl 3, 298 K)δ: 8.77 (s, 1H), 8.64 (d, 1H, JHH = 5.6 Hz), 8.54 (s, 1H), 8.49 (s, 1H), 8.05 (s, 1H), 7.94–7.88 (m, 4H), 7.75 (d, 1H, JHH= 8.0 Hz), 7.72– 7.61 (m, 5H), 7.61–7.55 (m, 3H), 7.45–7.38 (m, 4H), 7.35 (t, 1H, JHH = 6.0 Hz), 7.27–7.32 (m, 2H), 7.25–7.20 (m, 3H), 6.78 (d, 1H, JHH= 7.6 Hz), 6.72 (t, 1H, JHH= 8.0 Hz), 6.65 (t, 1H, JHH= 7.6 Hz), 6.60 (t, 1H, JHH= 7.2 Hz), 6.50–6.47 (m, 2H), 6.36 (d, 1H, JHH = 7.2 Hz). MS (FAB,193Ir) m/z: 1067 [M+]. Anal. calcd. for C57H35F3IrN7: N 9.19, C 64.15, H 3.31; found: N 9.09, C 64.21, H 3.62.
Preparation of [(dpbq)2Ir(bpiq)] (2)
Procedures identical to that of 1 were followed, using 200 mg of [(dpbq)2IrCl]2 (0.112 mmol), 71 mg of (bpiq)H (0.28 mmol), and 60 mg of Na2CO3 (0.57 mmol) in 20 mL of 2-methoxyethanol. Black crystals of [(dpbq)2Ir(bpiq)] (2) were obtained from a mixture of CH2Cl2 and hexane at RT (74 mg, 0.085 mmol, 33%).
Spectral data for 2
1H NMR (400 MHz, CDCl 3, 298 K)δ: 9.00 (s, 1H), 8.50– 8.43 (m, 5H), 8.30 (s, 1H), 7.97 (b, 2H), 7.87 (d, 2H, JHH= 8.0 Hz), 7.82 (d, 1H, JHH = 8.0 Hz), 7.72 (d, 1H, JHH = 8.0 Hz), 7.69–7.58 (m, 7H), 7.52 (t, 1H, JHH = 7.2 Hz), 7.44–7.28 (m, 4H), 7.26–7.18 (m, 5H), 6.74–6.66 (m, 2H), 6.64–6.53 (m, 3H), 6.45 (t, 1H, JHH = 7.6 Hz), 6.31 (d, 1H, JHH = 8.0 Hz), 1.37 (s, 9H). MS (FAB, 193Ir) m/z: 1105 [M+]. Anal. calcd. for C64H46F3IrN7: N 8.87, C 69.54, H 4.19; found: N 8.79, C 69.48, H 4.56.
Preparation of [(dpbq)2Ir(bpy)] (3)
A mixture of [(dpbq)2IrCl]2 (200 mg, 0.11 mmol), 2,2′-bipyridine (bpy, 45 mg, 0.29 mmol), and AgBF4 (100 mg, 0.51 mmol) in CH2Cl2 (25 mL) was stirred at RT for 3 h. The solution was filtered and the filtrate was evaporated to give the crude product. Black crystals of [(dpbq)2Ir(bpy)][BF4] (3) were obtained from a mixture of CH2Cl2 and hexane at RT (110 mg, 0.09 mmol, 41%).
Spectral data for 3
1H NMR (400 MHz, CDCl 3, 298 K)δ: 8.71 (d, 2H, JHH= 4.8 Hz), 8.60 (s, 2H), 8.55 (d, 2H, JHH = 8.8 Hz), 8.20 (t, 2H, JHH = 7.6 Hz), 7.96 (d, 2H, JHH = 8.0 Hz), 7.86–7.80 (m, 8H), 7.68–7.64 (m, 8H), 7.49 (t, 2H, JHH= 3.6 Hz), 7.40 (t, 2H, JHH = 7.6 Hz), 7.03 (d, 2H, JHH = 8.0 Hz), 6.75 (t, 2H, JHH= 7.6 Hz), 6.63 (t, 2H, JHH= 7.2 Hz), 6.54 (d, 2H,
JHH= 7.6 Hz). MS (FAB,193Ir) m/z: 1011 [M+]. Anal. calcd. for C58H38F4IrN6: N 7.65, C 63.45, H 3.49; found: N 7.71, C 63.25, H 3.57.
Preparation of [(dtbq)2Ir(fppz)] (4)
Procedures identical with that of 1 were followed, using 200 mg of [(dtbq)2IrCl]2 (0.106 mmol), 113 mg of (fppz)H (0.53 mmol), and 100 mg of Na2CO3(0.94 mmol) in 20 mL of 2-methoxyethanol. Black crystals of [(dtpz)2Ir(fppz)] (4) were obtained from a mixture of CH2Cl2and methanol at RT (120 mg, 0.107 mmol, 50%).
Spectral data for 4
1H NMR (400 MHz, CDCl 3, 298 K)δ: 8.69 (s, 1H), 8.57 (d, 1H, JHH = 8.0 Hz), 8.49 (s, 1H), 8.44 (s, 1H), 7.98 (s, 1H), 7.91 (d, 1H, JHH= 8.0 Hz), 7.86 (d, 1H, JHH= 8.0 Hz), 7.81 (d, 2H, JHH= 5.2 Hz), 7.72 (d, 1H, JHH= 8.0 Hz), 7.54 (t, 1H, JHH= 1.2 Hz), 7.50–7.41 (m, 5H), 7.40 (t, 3H, JHH= 1.2 Hz), 7.31–7.24 (m, 4H), 7.20–7.12 (m, 3H), 6.63 (s, 1H), 6.57 (d, 1H, JHH= 8.0 Hz), 6.48 (d, 1H, JHH= 8.0 Hz), 6.44 (s, 1H), 6.20 (s, 1H), 2.54 (s, 3H), 2.51 (s, 3H), 1.86 (s, 3H), 1.79 (s, 3H). MS (FAB, 193Ir) m/z: 1123 [M+]. Anal. calcd. for C61H43F3IrN7: N 8.73, C 65.23, H 3.86; found: N 8.64, C 64.89, H 3.81.
Preparation of [(dtbq)2Ir(acac)] (5)
A mixture of [(dtbq)2IrCl]2 (200 mg, 0.106 mmol), acetylacetone (acacH, 300 mg, 3.0 mmol), and Na2CO3 (100 mg, 0.94 mmol) in CH2Cl2 (20 mL) was stirred at RT for 24 h. After stopping the reaction, the solution was washed with water (3 × 50 mL), dried over MgSO4, and con-centrated to dryness. Black crystals of [(dtbq)2Ir(acac)] (5) were recrystallized from CH2Cl2 and hexane at RT (90 mg, 0.89 mmol, 42%).
Spectral data for 5
1H NMR (400 MHz, CDCl
3, 298 K)δ: 8.84 (s, 2H), 8.65 (s, 2H), 8.03 (d, 2H, JHH = 8.0 Hz), 7.94–7.89 (m, 6H), 7.49–7.42 (m, 8H), 7.06 (d, 2H, JHH= 8.4 Hz), 6.41 (d, 2H,
JHH = 8.4 Hz), 6.32 (s, 2H), 4.63 (s, 1H), 2.52 (s, 6H), 1.79 (s, 6H), 1.61 (s, 6H). MS (FAB,193Ir) m/z: 1010 [M+]. Anal. calcd. for C57H45IrN4O2: N 5.55, C 67.77, H 4.49; found: N 5.51, C 67.63, H 4.83.
X-ray structural analysis
Single crystal X-ray diffraction data were measured on a Bruker Smart CCD diffractometer using (Mo Kα) radiation (λ = 0.710 73 Å). The data collection was executed using the SMART program. Cell refinement and data reduction were made with the SAINT program. The structure was deter-mined using the SHELXTL/PC program and refined using full-matrix least-squares. All non-hydrogen atoms were re-fined anisotropically, whereas hydrogen atoms were placed at the calculated positions and included in the final stage of refinements with fixed parameters. The crystallographic re-finement parameters for complexes 1 and 3 are summarized in Table 1, and selected bond distances and angles of these complexes are listed in Tables 2 and 3, respectively.
The crystallographic data for complexes 1 and 3 (exclud-ing structure factors) have been deposited.5
Spectral and dynamic measurement
Steady-state absorption and emission spectra were
re-corded with a Hitachi (U-3310) spectrophotometer. The NIR emission spectra were acquired by exciting the sample solu-tion under a rectangular excitasolu-tion configurasolu-tion using an Ar ion laser (488 or 514 nm, Innova 90, Coherent Inc., Santa Clara, California) and the continuous wave was chopped by
Compound 1 3
Formula C57H35F3N7Ir·CH2Cl2 C58H38N6Ir·BF4·CH2Cl2
Molecular weight 1 152.05 1 182.88
Crystal system Triclinic Triclinic
Space group P-1 P-1 Crystal size (mm3) 0.4×0.15×0.12 0.18×0.15×0.05 a (Å) 11.9568(4) 16.3626(6) b (Å) 12.0739(5) 17.2949(6) c (Å) 17.1667(7) 19.5430(7) α (°) 74.820(1) 73.631(1) β (°) 82.535(1) 72.197(1) γ (°) 84.788(1) 70.003(1) V (Å3) 2 367.4(2) 4 850.1(3) Z 2 4 ρcalcd (g cm–3) 1.616 1.620 Temp (K) 295(2) 150(1) µ (mm–1) 2.994 2.927 Reflections collected 31 690 64 361
Independent reflections 10 878 (R(int) = 0.0419) 22 242 (R(int) = 0.0680)
RF, Rw(F2) (all data) 0.0445, 0.0928 0.0873, 0.1475
RF, Rw(F2) [I > 2σ(I)] 0.0360, 0.0860 0.0606, 0.1319
GOF 1.043 1.144
Note: RF=Σ||Fo– Fc||/Σ|Fo| and Rw(F2) = [Σw|Fo2– Fc2|2/Σw(Fo4)]1/2.
Table 1. Crystal data and refinement parameters for complexes 1 and 3.
Bond lengths (Å) Ir—N(1) 2.201(3) Ir—N(4) 2.065(3) Ir—C(10) 1.990(4) C(25)···N(2) 3.013(7) C(49)···N(1) 3.165(6) Ir—N(2) 2.116(3) Ir—N(6) 2.047(3) Ir—C(34) 1.991(4) C(25)···N(3) 3.381(6) C(49)···C(1) 3.439(6) Bond angles (°) N(1)-Ir-N(2) 75.02(13) N(6)-Ir-C(34) 79.47(15) N(2)-Ir-C(10) 174.19(14) N(4)-Ir-C(10) 79.21(15) N(1)-Ir-C(34) 170.85(14) N(4)-Ir-N(6) 178.16(12)
Table 2. Selected bond lengths (Å) and angles
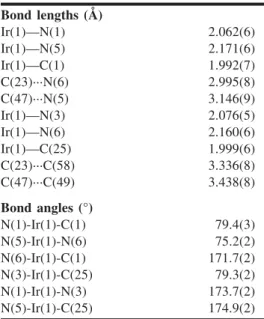
(°) for complex 1. Bond lengths (Å) Ir(1)—N(1) 2.062(6) Ir(1)—N(5) 2.171(6) Ir(1)—C(1) 1.992(7) C(23)···N(6) 2.995(8) C(47)···N(5) 3.146(9) Ir(1)—N(3) 2.076(5) Ir(1)—N(6) 2.160(6) Ir(1)—C(25) 1.999(6) C(23)···C(58) 3.336(8) C(47)···C(49) 3.438(8) Bond angles (°) N(1)-Ir(1)-C(1) 79.4(3) N(5)-Ir(1)-N(6) 75.2(2) N(6)-Ir(1)-C(1) 171.7(2) N(3)-Ir(1)-C(25) 79.3(2) N(1)-Ir(1)-N(3) 173.7(2) N(5)-Ir(1)-C(25) 174.9(2)
Table 3. Selected bond lengths (Å) and angles
(°) for complex 3.
5Supplementary data for this article are available on the journal Web site (http://canjchem.nrc.ca) or may be purchased from the Depository of Unpublished Data, Document Delivery, CISTI, National Research Council Canada, Ottawa, ON K1A 0R6, Canada. DUD 5002. For more information on obtaining material refer to http://cisti-icist.nrc-cnrc.gc.ca/irm/unpub_e.shtml. CCDC 276875 and 276876 contain the crystal-lographic data for this manuscript. These data can be obtained, free of charge, via http://www.ccdc.cam.ac.uk/conts/retrieving.html (Or from the Cambridge Crystallographic Data Centre, 12 Union Road, Cambridge CB2 1EZ, UK; fax +44 1223 336033; or [email protected]).
a mechanic chopper operated at 200 Hz. To minimize the re-absorption effect, the excitation beam was focused as closely as possible to the front wall of the quartz cell. The NIR emission was measured by the photomultiplier tube (Hamamatzu R5509-72, operated at –80 °C) coupled with a Lock-in amplifier (SR830, Stanford Research Systems, Sunnyvale, California) and a monochromator (SpectraPro-275, Acton Research Corporation, Acton, Massachusetts) in that the grating was blazed at 1200 nm. IR125 (Exciton Inc., Dayton, Ohio) withΦ ~ 0.11 (λmax~ 925 nm) in DMSO so-lution was used as a standard to calculate the emission quan-tum yield (10). For the NIR lifetime measurement, the sample was excited by a 532 nm pulse (2nd harmonic of Nd:YAG, 6 ns). The emission trace was detected by a photo-multiplier tube (Hamamatzu R5509-72) operated at –80 °C and recorded by a sampling oscilloscope (TDS 3012, Tektronix, Beaverton, Oregon). An average of 100 shots was taken in the lifetime measurement, unless specified else-where.
Computational methodology
Calculations on the electronic ground state of complexes 1 and 3 were carried out using B3LYP density functional the-ory (11, 12). A double-ζ quality basis set consisting of Hay and Wadt’s effective core potentials (LANL2DZ) (13) was employed for the Ir atom and a 6-31G* (14) basis for the H, C, N, and F atoms. A relativistic effective core potential (ECP) replaced the inner core electrons of Ir(III), leaving the outer core (5s25p6) electrons and the 5d6 valence electrons. Time-dependent DFT (TDDFT) calculations (15) using the B3LYP functional were then performed based on the struc-tural optimized geometries. Typically, the lowest 10 triplet and 10 singlet roots of the nonhermitian eigenvalue equa-tions were obtained to determine the vertical excitation ener-gies. Oscillator strengths were deduced from the dipole transition matrix elements (for singlet states only). The ground-state B3LYP and excited-state TDDFT calculations were carried out using Gaussian03 (16).
Results and discussion
Syntheses and structural characterization
The preparation of highly conjugated ligand chromophores is necessary to achieve the NIR-emitting iridium complexes. As depicted in Scheme 1, the required ligands can be syn-thesized by treatment of 2,3-naphthalenediamine and dibenzil to produce 2,3-diphenyl-or di-p-tolyl-substituted benzo[g]quinoxaline in good yields. This synthetic approach follows the literature procedure utilized for the analogous diphenylquinoxaline, and is best prepared from related o-phenylenediamine and the corresponding α-diketone in refluxing ethanol (17).
Subsequent reactions of IrCl3·nH2O with (dpbq)H or (dtbq)H in refluxing ethoxyethanol afforded chloride-bridged dimers [(dpbq)2IrCl]2 or [(dtbq)2IrCl]2, respectively. These dimer complexes can easily react with the pyrazole chelate ligand (fppz)H in the presence of Na2CO3 to afford black-colored complexes [(dpbq)2Ir(fppz)] (1) and [(dtbq)2Ir(fppz)] (4), where (fppz)H = 3-trifluoromethyl-5-(2-pyridyl)pyrazole. Similar reactions towards other bidentate chelates such as 1-(5-tert-butyl-2H-pyrazol-3-yl)isoquinoline ((bpiq)H),
2,2⬘-bipyridine (bpy), and acetylacetone (acacH) yielded the cor-responding Ir(III) complexes, [(dpbq)2Ir(bpiq)] (2), [(dpbq)2Ir(bpy)][BF4] (3), and [(dtbq)2Ir(acac)] (5), respec-tively (see Scheme 2).
All iridium complexes were easily soluble in organic sol-vents such as CH2Cl2, THF, and acetone, and the corre-sponding solutions showed negligible decomposition for a period of over 24 h, upon exposure to air. Routine character-izations were conducted using microanalysis, mass spec-trometry, and 1H NMR spectroscopy. Moreover, the fppz complex 1 was further characterized by single crystal X-ray diffraction analysis. Its ORTEP diagram is depicted in Fig. 1, while crucial bond distances and angles are listed in Table 1.
As depicted in Fig. 1, complex 1 reveals a distorted octa-hedral geometry around the Ir atom, consisting of two cyclo-metalated phenylbenzoquinoxaline fragments and one (2-pyridyl) pyrazolate ligand. The unique pyrazolate chelate is located opposite to the cis-oriented carbon donor atoms of benzoquinoxaline, while the benzoquinoxaline ligands adopt an eclipse configuration and their coordinated nitrogen at-oms (N(4) and N(6)) and carbon atat-oms (C(10) and C(34)) adopt trans and cis orientation, respectively. This coordin-ative arrangement is akin to those of the parent phenyl pyridine ligands observed for the chloride-bridged dimer
NH2 NH2 O O N N + R R R R R = H; (dpbq)H R = Me; (dtbq)H Scheme 1. 2 N N Ir N N N But 2 N N Ir N N 2 N N Ir N N N CF3 BF4 -2 N N Ir O O (1), R = H (2) (5) (3) (4), R = Me R R Scheme 2.
complex [(ppy)2Ir(µ-Cl)]2 (18), the diketonate complex (ppy)2Ir(acac) (19), and even the pyrazolate derivatives, sug-gesting that the incoming fppz ligand occupies the positions of the bridging chloride ligands in its starting material, [(dpbp)2IrCl]2. Moreover, the uncoordinated and cyclo-metalated phenyl groups show twisting angles of 40°–54°, as well as unusually large deformation angles of 23°–28° with respect to the middle benzoquinoxaline fragments. The deformation angles reveal an unfavorable steric interaction between the chelating ligands and can be gauged by the least-squares calculation using planes defined by the cyclometalated phenyl group and the middle C6 hexagon of the benzoquinoxaline. It appears to us that the nonbonding repulsion between benzoquinoxaline and pyridyl pyrazolate ligands is the main driving force causing such a large distor-tion at the cyclometalated phenyl groups, as most of the interligand C···C and C···N nonbonding contacts listed in Ta-ble 2 are shorter than a limited value of ca. 3.4 Å, i.e., the sum of the van der Waals radii of the carbon atoms.
For a further comparison, the X-ray structural study on the cationic dipyridine complex 3 was also examined. Com-parison of the ORTEP diagram (Fig. 2) and the metric pa-rameters (Table 3) with those of 1 shows no significant variation on the overall molecular architecture, except for the formation of an approximate C2 rotational axis that bi-sects the bipyridine ligand and passes through the central Ir metal atom. This increasing molecular symmetry is consis-tent with the simplification of the 1H NMR spectral pattern observed in solution at RT (see the Experimental section).
Electrochemistry
The electrochemical properties of these Ir complexes were investigated by CV using ferrocene as the internal standard, and the respective redox data are listed in Table 4. During the anodic scan, all iridium complexes exhibited a reversible oxidation wave with potentials in the region 0.50–0.77 V. It
is believed that the oxidation process mainly occurred at the metal center and, in part, with a slight contribution from the surrounding chelate ligands (20). Thus, the formal oxidation potential was strongly dependent on the electronic environ-ment of the Ir(III) cation, i.e., a better electron donor would shift the oxidation potential to a less positive value. This hy-pothesis was verified by the increasedπ conjugation of the anionic bpiq ligand in 2, which decreased the oxidative po-tential from 0.77 (in 1) to 0.61 V (in 2), while the attach-ment of the 2,2′-bipyridine ligand in 3 led to the complete suppression of the metal oxidation signal owing to its cationic nature. Moreover, replacement of the phenyl sub-stituents with tolyl subsub-stituents of benzoquinoxaline also slightly altered the oxidation potential, as supported by the fact that the oxidation potential of 4 is cathodically shifted to 0.70 V in comparison with that of the parent complex 1. Owing to the presence of an extra methyl substituent, this result could possibly be attributed to a slightly better σ-do-nor ability of the cyclometalated tolyl group.
Upon switching to the cathodic sweep in THF, two revers-ible reduction processes, with potentials ranging from –1.33 to –1.96 V, were detected for all complexes (1–5). We as-signed these signals to a sequential reduction of the cyclo-metalated benzoquinoxaline fragments. For dtbq complex 4, the first reduction peak is shifted to –1.65 V in comparison with that of the dpbq counterpart 1 (–1.54 V) because of the electron-releasing effect of the para-methyl substituents. Conversely, complex 3 showed the lowest reduction poten-tials, owing to its cationic nature, while complexes 2 and 5 gave the highest reduction potential among the whole series. The results indicate that the third ancillary ligand also sig-nificantly affects the redox properties of these Ir complexes, possibly via their enhanced donor capability as well as the extended π conjugation. Qualitatively, this observation is consistent with both the photophysical properties and theo-retical predictions elaborated as follows.
( )
a
( )
b
Fig. 1. (a) ORTEP diagram of 1 with thermal ellipsoids shown at the 30% probability level; fluorine atoms of the CF3substituent were omitted for clarity. (b) Same ORTEP diagram with an emphasis on the spatial distortion of dpbq ligands.
Photophysical properties
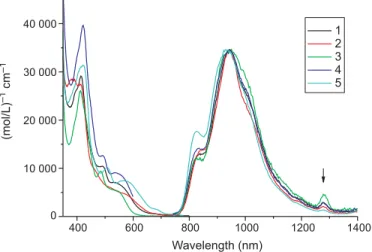
Figure 3 shows the absorption and emission spectra of complexes 1–5 in CH2Cl2. As supported by CV measure-ments as well as the frontier orbital analyses (see the follow-ing section), it is reasonable to assign the first S0–S1 transition to absorption peaks around 500–600 nm (ε ~ 5 × 10³ (mol/L)–1 cm–1) to a metal to ligand (benzoquinoxaline part) charge transfer (MLCT) overlapping with the inter-ligand phenyl to benzoquinoxaline transition. Due to a large molecular framework, the composition of higher electronic states is complicated, so that any corresponding assignments for complexes 1–5 may not be meaningful. Furthermore, the Ir-metal-enhanced spin-orbit coupling should result in nonnegligible absorptivity for the triplet transition, as indi-cated by a corresponding small absorption hump around 650–700 nm. However, absorption bands ascribed to the triplet manifolds could not be distinctly resolved mainly ow-ing to their hidow-ing inside the UV region of the strong sow-inglet transitions. Detailed discussion regarding the transition in the triplet manifold will be given in the Theoretical approach section.
Figure 3 also depicts the emission spectra of complexes
1–5 in CH2Cl2. The spectral feature, quantum efficiency and
relaxation dynamics (vide infra) of complexes 1–5 show concentration independence up to 10–3 mol/L, indicating a
negligible aggregation effect in fluid solution. To reveal any differences in the spectral profile, the emission spectra were normalized at the peak wavelength. In comparison, for all complexes studied, only a slight variation was observed in view of the emission spectral feature and peak position. As listed in Table 5, the relaxation dynamics of 1–5 are O2 con-centration dependent. For example, the decay time of com-plex 1 was measured to be 286 ns in the degassed CH2Cl2, while it was decreased to 200 ns upon aeration. In the O2 de-pendent study, in which the O2concentration was monitored by its vapor pressure filled in the vacuum line and deduced by Henry’s law, a straight Stern–Volmer plot could be for-mulated (not shown here), and an oxygen-quenching rate constant of 1.7 × 10⁹ (mol/L)–1 s–1 was deduced, which is nearly one-nineth of the diffusion-controlled rate of 2.0 × 10¹⁰(mol/L)–1s–1calculated from the Stokes–Einstein
equa-(a)
(b)
Fig. 2. (a) ORTEP diagram of 3 with thermal ellipsoids shown at the 50% probability level. (b) Same ORTEP diagram with an
empha-sis on the spatial distortion of dpbq ligands.
Complex E1/2ox(V)a E 1/2red (V)a 1 0.77 [100]b –1.54 [110], –1.81 [100] 2 0.61 [80] –1.64 [100], –1.91 [100] 3 — –1.31 [80], –1.61 [80] 4 0.70 [100] –1.65 [110], –1.91 [120] 5 0.50 [90] –1.73 [90], –1.96 [100]
aPotential values referenced vs. Fc/Fc+. bData in square bracket denotes the |E
pa– Epc| values in mV.
Table 4. One-electron redox potentials of complexes 1–5.
400 600 800 1000 1200 1400 0 10 000 20 000 30 000 40 000 1 2 3 4 5 Wavelength (nm) (mol/L) cm –1 –1
Fig. 3. The absorption and emission spectra of complexes 1–5 in
CH2Cl2. The peak intensities were normalized.λex= 514 nm. The arrow indicates the peak for1O2 1∆g(v′ = 0) → Σg–(v′′ = 0)
tion in CH2Cl2. The result is consistent with the O2 -quench-ing triplet state accord-quench-ing to the theory of electron-exchange type (Dexter type) of energy transfer expressed as (21):
T + 3O 2
kO2
⎯⎯⎯→ S0 + 1O 2
The overall spin must be conserved upon forming a collisional complex. Accordingly, the possibility of each col-lision producing 1O2 is statistically one-nineth. Perhaps the strongest support for the O2quenching is given by the obser-vation of 1O2 (1∆g (v′′ = 0) → 1Σ–g(v′ = 0) emission with a peak wavelength at ~1276 nm (22) for complexes 1–5 in aer-ated CH2Cl2(see the arrow in Fig. 3). The results, in combi-nation with the rather small radiative decay rate of <106s–1, lead us to unambiguously assign the dominant emission in complexes 1–5 to be of phosphorescence character. The spectra show a distinctly 0–0 vibronic onset of the transition, a profile that normally appears in a3π–π* transition of aro-matic chromophores with high symmetry. The results
pro-vide a clue that the observed phosphorescence possesses, in part, a3π–π* character plausibly originating from a
ligand-center chromophore of long conjugation such as
benzoquinoxaline. Nevertheless, the involvement of other transitions such as3MLCT is also possible. Furthermore, the observation of rather small changes in spectral features, as well as peak positions, implies that frontier orbitals respon-sible for the T1–S0 transition may be mainly derived from the same origin for complexes 1–5. It is thus of fundamental importance to gain more detailed insights into the transition properties of the phosphorescence based on the theoretical approaches elaborated as follows.
Theoretical approach
Theoretical confirmation of the photophysical properties of complex 1 was provided by the DFT calculations. In this study, the crystallographic data for 1 was used as the frame-work for the extended Hückel formalism, and the calculation Complex λabs(nm) (ε, 103(mol/L)–1cm–1) λ
em(nm) Φaer(×103)a τaer(ns) τdeg(ns)
1 535 (7), 491 (10), 414 (29) 916 6.48 200 286
2 575 (5), 464 (10), 414 (27) 922 9.53 195 276
3 540 (5), 484 (9), 412 (26) 922 3.59 245 403
4 541 (9), 491 (13), 422 (40) 916 10.2 209 302
5 570 (7), 508 (10), 421 (31) 904 21.8 216 290
aQuantum efficiencies were measured in aerated CH 2Cl2.
Table 5. Photophysical properties of complexes 1–5 in CH2Cl2at room temperature.
HOMO
LUMO
Fig. 4. HOMO and LUMO of complex 1 involved in the low-lying transition.
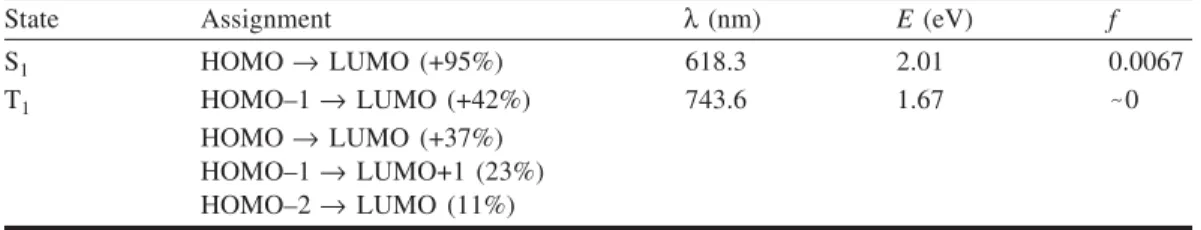
State Assignment λ (nm) E (eV) f
S1 HOMO→ LUMO (+95%) 618.3 2.01 0.0067
T1 HOMO–1→ LUMO (+42%) 743.6 1.67 -0
HOMO→ LUMO (+37%) HOMO–1→ LUMO+1 (23%) HOMO–2→ LUMO (11%)
was performed via a CACAO program (see the Experimen-tal section). Figure 4 depicts the features of the HOMO to HOMO–3 and LUMO to LUMO+3 frontier orbitals mainly involved in the lower-lying transition, while the descriptions and the energy gaps of each transition are listed in Table 6. The validity of the TDDFT approach can be readily per-ceived by the calculated T1→ S0 emission peak at 745 nm, which is very close to the 0–0 onset peak (~785 nm) ob-served experimentally. Based on the results (see Fig. 4 and Table 6), the electron densities of the HOMO are mainly lo-cated on the Ir(III) metal center and, to a small extent, the cyclometalated phenyl ligand, while a large portion of the electron densities of HOMO–1 and HOMO–2 is attributed to the π orbitals of benzoquinoxaline overlapping with certain dπorbitals of the Ir(III) atom. Conversely, the electron den-sities of LUMO and LUMO+1 are distributed mostly on the benzoquinoxaline moiety. The S0→ S1and S0→ S2
transi-tions mainly incorporate HOMO → LUMO (+95%) and
HOMO → LUMO+1 (+93%), respectively, and thus are
dominated by MLCT (dπ (Ir) → π* (benzoquinoxaline)) overlapping withπ–π* ILCT (mainly cyclometalated phenyl site (π) → benzoquinoxaline pyridine site (π*)) in character. As supported by the data shown in Table 6, the higher ex-cited states in the singlet manifold, S0→ Sn(n > 3), are
rela-tively much more complicated, the results of which make a definitive frontier orbital assignment meaningless. In con-trast, the lowest electronic transition in the triplet manifold, i.e., S0 → T1, mainly incorporates the ligand center benzoquinoxaline3π–π*transition and3MLCT (dπ(Ir)→ π* (benzoquinoxaline)).
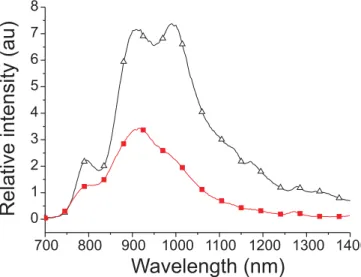
The contribution of the 3π–π* transition is manifested by the low-temperature (77 K) approach to complex 1. Figure 5 shows the luminescence spectrum of 1 in a 77 K CH2Cl2 matrix. Two salient remarks can be pointed out promptly ac-cording the spectral layout. First, in comparison to that mea-sured at 298 K, the enhancement of the vibronic progression at 77 K is obvious, showing the notable population switch-ing from perhaps3MLCT/3π–π mixing character to the3π–π dominating state under this condition. Nevertheless, one cannot eliminate the possibility that the increase in vibronic resolution upon cooling may just indicate an increase in ri-gidity of the molecule, making the vibrational levels more identical to one another, as well as the disappearance of hot bands. Secondly, the phosphorescence intensity at 77 K is increased ~2.5-fold with respect to that at 298 K. Similar structural phosphorescence with 2- to ~3-fold increases in intensity was observed for complexes 2–5 in 77 K CH2Cl2. Thus, temperature-dependent radiationless deactivation path-ways may only play a minor role to the relaxation dynamics. Moreover, as listed in Table 5, substitution at non-benzo-quinoxaline sites causes neither spectral change nor large al-ternation of the quantum efficiency. The latter implies that the large amplitude vibration or any torsional motion at non-benzoquinoxaline sites, which generally quenches emission in the NIR region, are not actively involved in the deactiva-tion process. This viewpoint can be radeactiva-tionalized by the negli-gible contribution of non-benzoquinoxaline ligands to both HOMO (or HOMO–1 and HOMO–2) and LUMO (or LUMO+1). Since complexes 1–5 all bear aryl substituents at benzoquinoxaline sites, it is plausible that the torsional mo-tion of phenyl (or tolyl) substituents, the relaxamo-tion
dynam-ics of which should be temperature dependent, partly induces the radiationless transition. However, one ought to realize that because of the much smaller NIR energy gap, excitation that causes any weakening of the bond strength may result in crossing of the potential energy surface between T1 and S0 states and eventually trigger the rapid radiationless deactiva-tion. In the case of complexes 1–5, these nearly temperature-independent, weak vibrational motions play a key role in ac-counting for the dominant radiationless deactivation.
Conclusion
In summary, we report the syntheses and characterization of a new series of NIR Ir(III) complexes (1–5). These com-plexes exhibit moderate NIR phosphorescence with peak wavelengths around 910–920 nm at RT. As supported by the TDDFT approach, the transition mainly involves benzoiso-quinoline3π–π* intraligand charge transfer and metal (Ir) to benzoisoquinoline charge transfer. The relatively weak NIR emission can be tentatively rationalized by the low energy gap of which the radiationless deactivation may be governed by the large amplitude vibration and, in part, the phenyl tor-sional motions at the benzoquinoxaline sites. Knowing that current interest in Ir(III) types of phosphorescence emitter is focused on the Ir(III)-type OLED, to switch gears in re-search orientation, future applications of the titled NIR com-plexes and (or) relevant derivatives may be motivated by the strategy of using these complexes in the fabrication of pho-tovoltaic devices (23). Focus on this approach is in progress.
Acknowledgment
We thank the National Science Council of Taiwan, Repub-lic of China, for financial support (grant Nos. NSC 91-2119-M-002-016) and (NSC 91-2113-M-007-006). 700 800 900 1000 1100 1200 1300 1400 0 1 2 3 4 5 6 7 8
Wavelength (nm)
Relative
intensity
(au)
Fig. 5. The luminescence spectrum of 1 at room temperature (䊏)
and in the 77 K CH2Cl2matrix (∆). Note that both spectra were analyzed using the same absorbance and excitation wavelength (514 nm). Thus, the intensity ratio can be directly estimated from the spectral integration.
References
1 (a) B. O’Regan and M. Graetzel. Nature (London), 353, 737 (1991); (b) A. Hagfeldt and M. Gratzel. Acc. Chem. Res. 33, 269 (2000); (c) D. Kuciauskas, M.S. Freund, H.B. Gray, J.R. Winkler, and N.S. Lewis. J. Phys. Chem. B, 105, 392 (2001); (d) M. Gratzel. Nature (London), 414, 338 (2001).
2. (a) R.J. Mears and S.R. Baker. Opt. Quantum Electron. 24, 517 (1992); (b) E. Desurvire. Phys. Today, 97, 20 (1994); (c) N. Ono, S. Ito, C.H. Wu, C.H. Chen, and T.C. Wen. Chem. Phys. 262, 467 (2000).
3. (a) M.A. Baldo, D.F. O’Brien, Y. You, A. Shoustikov, S. Sibley, M.E. Thompson, and S.R. Forrest. Nature (London),
395, 151 (1998); (b) Y.-L. Tung, S.-W. Lee, Y. Chi, Y.-T. Tao,
C.-H. Chien, Y.-M. Cheng, P.-T. Chou, S.-M. Peng, and C.-S. Liu. J. Mater. Chem. 15, 460 (2005); (c) A. Tsuboyama, H. Iwawaki, M. Furugori, T. Mukaide, J. Kamatani, S. Igawa, T. Moriyama, S. Miura, T. Takiguchi, S. Okada, M. Hoshino, and K. Ueno. J. Am. Chem. Soc. 125, 12971 (2003); (d) Y.-L. Tung, S.-W. Lee, Y. Chi, L.-S. Chen, C.-F. Shu, F.-I. Wu, A.J. Carty, P.-T. Chou, S.-M. Peng, and G.-H. Lee. Adv. Mater. 17, 1059 (2005).
4. (a) E.M. Kober, J.V. Caspar, R.S. Lumpkin, and T.J. Meyer. J. Phys. Chem. 90, 3722 (1986); (b) L. Della Ciana, W.J. Dressick, D. Sandrini, M. Maestri, and M. Ciano. Inorg. Chem. 29, 2792 (1990).
5. (a) T.J. Foley, B.S. Harrison, A.S. Knefely, K.A. Abboud, J.R. Reynolds, K.S. Schanze, and J.M. Boncella. Inorg. Chem. 42, 5023 (2003); (b) W.-K. Wong, A. Hou, J. Guo, H. He, L. Zhang, W.-Y. Wong, K.-F. Li, K.-W. Cheah, F. Xue, and T.C.W. Mak. J. Chem. Soc. Dalton Trans. 3092 (2001); (c) A. Vogler and H. Kunkely. Top. Curr. Chem. 213, 143 (2001); (d) N.M. Shavaleev, L.P. Moorcraft, S.J.A. Pope, Z.R. Bell, S. Faulkner, and M.D. Ward. Chem. Eur. J. 9, 5283 (2003); (e) A.M. Klonkowski, S. Lis, M. Pietraszkiewicz, Z. Hnatejko, K. Czarnobaj, and M. Elbanowski. Chem. Mater. 15, 656 (2003). 6. (a) I.B. Rietveld, E. Kim, and S.A. Vinogradov. Tetrahedron,
59, 3821 (2003); (b) V.V. Rozhkov, M. Khajehpour, and S.A.
Vinogradov. Inorg. Chem. 42, 4253 (2003).
7. (a) A. Juris, V. Balzani, S. Campagna, G. Denti, S. Serroni, G. Frei, and H.U. Guedel. Inorg. Chem. 33, 1491 (1994); (b) A. Mamo, A. Juris, G. Calogero, and S. Campagna. Chem. Commun. (Cambridge), 1225 (1996); (c) M.K. Nazeeruddin, R. Humphry-Baker, M. Gratzel, and B.A. Murrer. Chem. Commun. (Cambridge), 719 (1998).
8. (a) W.R. Thiel and J. Eppinger. Chem. Eur. J. 3, 696 (1997); (b) S.P. Singh, D. Kumar, B.G. Jones, and M.D. Threadgill. J. Fluorine Chem. 94, 199 (1999).
9. M. Nonoyama. J. Organomet. Chem. 86, 263 (1975). 10. R.C. Benson and H.A. Jues. J. Chem. Eng. Data, 22, 379
(1977).
11. C. Lee, W. Yang, and R.G. Parr. Phys. Rev. B, 37, 785 (1988). 12. A.D. Becke. J. Chem. Phys. 98, 5648 (1993).
13. (a) P.J. Hay and W.R. Wadt. J. Chem. Phys. 82, 270 (1985); (b) W.R. Wadt and P.J. Hay. J. Chem. Phys. 82, 284 (1985); (c) P.J. Hay and W.R. Wadt. J. Chem. Phys. 82, 299 (1985). 14. P.C. Hariharan and J.A. Pople. Mol. Phys. 27, 209 (1974). 15. (a) C. Jamorski, M.E. Casida, and D.R. Salahub. J. Chem.
Phys. 104, 5134 (1996); (b) M. Petersilka, U.J. Grossmann, and E.K.U. Gross. Phys. Rev. Lett. 76, 1212 (1996); (c) R. Bauernschmitt, R. Ahlrichs, F.H. Hennrich, and M.M. Kappes. J. Am. Chem. Soc. 120, 5052 (1998); (d) M.E. Casida. J. Chem. Phys. 108, 4439 (1998); (e) R.E. Stratmann, G.E. Scuseria, and M.J. Frisch. J. Chem. Phys. 109, 8218 (1998). 16. M.J. Frisch, G.W. Trucks, H.B. Schlegel, G.E. Scuseria, M.A.
Robb, J.R. Cheeseman, J.A. Montgomery, Jr., T. Vreven, K.N. Kudin, J.C. Burant, J.M. Millam, S.S. Iyengar, J. Tomasi, V. Barone, B. Mennucci, M. Cossi, G. Scalmani, N. Rega, G.A. Petersson, H. Nakatsuji, M. Hada, M. Ehara, K. Toyota, R. Fukuda, J. Hasegawa, M. Ishida, T. Nakajima, Y. Honda, O. Kitao, H. Nakai, M. Klene, X. Li, J.E. Knox, H.P. Hratchian, J.B. Cross, V. Bakken, C. Adamo, J. Jaramillo, R. Gomperts, R.E. Stratmann, O. Yazyev, A.J. Austin, R. Cammi, C. Pomelli, J.W. Ochterski, P.Y. Ayala, K. Morokuma, G.A. Voth, P. Salvador, J.J. Dannenberg, V.G. Zakrzewski, S. Dapprich, A.D. Daniels, M.C. Strain, O. Farkas, D.K. Malick, A.D. Rabuck, K. Raghavachari, J.B. Foresman, J.V. Ortiz, Q. Cui, A.G. Baboul, S. Clifford, J. Cioslowski, B.B. Stefanov, M.A.G. Liu, A. Liashenko, P. Piskorz, I. Komaromi, R.L. Mar-tin, D.J. Fox, T. Keith, Al-Laham, C.Y. Peng, A. Nanayakkara, M. Challacombe, P.M.W. Gill, B. Johnson, W. Chen, M.W. Wong, C. Gonzalez, and J.A. Pople. Gaussian 03. Revision C.02 [computer program]. Gaussian, Inc., Wallingford, Conn. 2004.
17. G.B. Caygill, R.M. Hartshorn, and P.J. Steel. J. Organomet. Chem. 382, 455 (1990).
18. F.O. Graces, K.A. King, and R.J. Watts. Inorg. Chem. 27, 3464 (1988).
19. S. Lamansky, P. Djurovich, D. Murphy, F. Abdel-Razzaq, H.-E. Lee, C. Adachi, P.E. Burrows, S.R. Forrest, and M.E. Thompson. J. Am. Chem. Soc. 123, 4304 (2001).
20. (a) Y. Ohsawa, S. Sprouse, K.A. King, M.K. DeArmond, K.W. Hanck, and R.J. Watts. J. Phys. Chem. 91, 1047 (1987); (b) P.J. Hay. J. Phys. Chem. A, 106, 1634 (2002); (c) F.-M. Hwang, H.-Y. Chen, P.-S. Chen, C.-S. Liu, Y. Chi, C.-F. Shu, F.-I. Wu, P.-T. Chou, S.-M. Peng, and G.-H. Lee. Inorg. Chem.
44, 1344 (2005).
21. D.L. Dexter. J. Chem. Phys. 21, 836 (1953).
22. For example, see: P.T. Chou, Y.C. Chen, C.Y. Wei, S.J. Chen, H.L. Lu, and T.H. Wei. J. Phys. Chem. A, 101, 8581 (1997), and refs. therein.
23. (a) P.A. Anderson, F.R. Keene, T.J. Meyer, J.A. Moss, G.F. Strouse, and J.A. Treadway. J. Chem. Soc. Dalton Trans. 3820 (2002); (b) M.K. Nazeeruddin, S.M. Zakeeruddin, J.-J. Lagref, P. Liska, P. Comte, C. Barolo, G. Viscardi, K. Schenk, and M. Graetzel. Coord. Chem. Rev. 248, 1317 (2004).