© 1991 Elsevier Science Publishers B.V. All rights reserved 0165-0270/91/$03.50 NSM 01302
Interactive program for spectral and area analysis of compound
action potentials of A-fiber and C-fiber
F.-S. Jaw
1,
S.-N. Yu1,
J.-C. L e e 2, H.-W. Tsao 1, H.J. Yu 1 and C.-T. Y e n 2 Departments of l Electrical Engineering and 2 Zoology, National Taiwan University, Taipei 10764 (Taiwan)(Received 24 June 1991)
(Revised version received 9 September 1991) (Accepted 13 September 1991)
Key words: Interactive program; Spectral analysis; Compound action potentials; A-fiber; C-fiber
An interactive program was described to correct the baseline wandering of the compound action potentials (CAPs) of C-fiber, to calculate the area and the peak amplitude of CAPs, and to analyze their spectral distribution. Using this program, we found the optimal bandpass of the filter for recording CAPs to be from 10 Hz to 3 kHz.
I n t r o d u c t i o n
The recording of compound action potentials (CAPs) has played an essential role in many fields of neurophysiology (Landau et al., 1968; Dong et al., 1982; Favaro et al., 1988; Jaw et al., 1991). T h e r e are, however, 2 basic problems left unsolved in the recording of CAPs. One is the bandpass requirement for recording CAPs; the other concerns the analysis of the CAPs of C-fiber (CCAPs).
A bandpass filter is usually used to reject noises in recording CAPs. On the one hand, too n a r r o w a bandwidth distorts recorded CAPs. On the other hand, small signals such as CCAPs may be seriously contaminated by noises in wide-band recording. Therefore, an adequate bandpass set- ting of the filter is important. Unfortunately, the optimal bandpass for recording CAPs has not been determined.
The baseline of CCAPs is usually curvy and wandering, owing to either the much larger CAPs of A-fiber (ACAPs) or the stimulation artifact. T h e wandering baseline should be corrected be- fore analyzing the area or the peak amplitude of CCAPs.
In this investigation, we described an interac- tive program to correct the baseline wandering of CCAPs, to calculate the area and the peak ampli- tude of CAPs, to analyze their spectral distribu- tion and to determine the optimal bandpass of the filter for recording CAPs. This program was developed by the use of the T U R B O C compiler and was executed on an IBM PC compatible microcomputer. We will supply this program free of charge upon request if a 3.5-in floppy disc and the return postage are provided.
M a t e r i a l s a n d m e t h o d s
Correspondence: Dr. Chen-Tung Yen, Department of Zo01- ogy, National Taiwan University, Taipei, Taiwan 10764. Tel.: (02)-363-0231, ext. 3322; Fax: (02)-363-6837.
A n i m a l preparation
Adult male Wistar rats were used. T h e animals were continuously anesthetized with sodium pen- tobarbital (0.4%, !.7 m l / h , i.v.), paralyzed with
gallamine triethiodide and artificially ventilated. Laminectomy was performed from the L1 to the S I. The spinal roots of the sacral cord were covered with warm liquid paraffin (34 ° C). Dur- ing the experiment, the animals were kept in physiological conditions (mean blood pressure > 90 mm Hg; end tidal CO 2 concentration 3-4.5%; and rectal temperature 38 ° C).
Data acquisition
A piece of isolated dorsal root was mounted on a multi-lead hook electrode made from stain- less steel. Two leads of the electrode were used for stimulation, another 2 leads were used for recording and a middle lead was connected to the ground. The gain of the differential amplifier for the recording of the ACAPs was 50 and that for the recording of the CCAPs was 500. A 12-bit analog-to-digital converter card was used to digi- tize the CAPs. The ACAPs were anti-aliasing, filtered with a 5-pole Butterworth filter (band width: 0.1 H z - 8 kHz) and oversampled at 66.7 kHz. The CCAPs were anti-aliasing, filtered with a 5-pole Butterworth filter (band width: 0.1 H z - 1 kHz) and oversampled at 8 kHz. Usually, several cycles of 512 data points were sampled for signal averaging.
Results
The interactive program
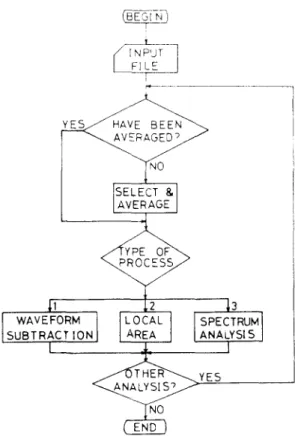
The main flowchart of this program is shown in Fig. 1. Basically, this program has 4 major parts: select-and-average, wave form subtraction, local area, and spectrum analysis procedures.
In the select-and-average procedure, several cycles of CAPs can be averaged to reduce ran- dom noises. Manual intervention is used to reject cycles that are seriously contaminated by large artifacts (e.g., ECG) before signal averaging.
The wave form subtraction 'procedure is essen- tial to correct the baseline wandering of CCAPs. The CAPs from threshold stimulation for C-fiber can be subtracted from the CCAPs of supramaxi- mal stimulation. In this procedure, the user in- puts the filename of the wave form to be sub-
L . . .
I F I L E /
'SELECT & AVERAGE
WAVEFORM SPECTRUM
SUBTRACT ION ANALYSIS
I
~ Y E 5 I
Fig. 1. Flowchart of the interactive program.
tracted and the result of the subtraction can be saved for further processing.
The local area procedure is used to integrate the area of the individual wave forms of CAPs. T h r e e cursors can be displayed and moved on the C R T screen: 1 is the horizontal baseline and the other 2 are vertical lines which set the time range to be integrated. T h e area of the monophasic CAPs is calculated by integrating the wave form in the selected time range with respect to the baseline. For the biphasic CAPs, the area is ob- tained by summing the integrated positive and negative phases of the wave form.
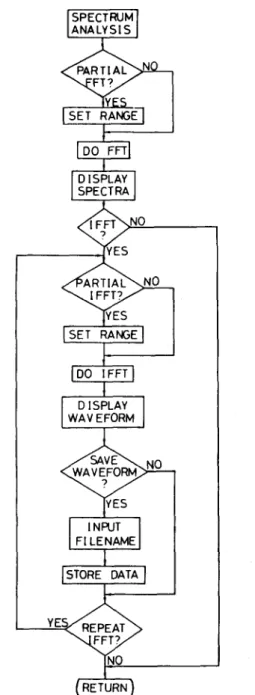
The spectrum analysis procedure shown in Fig. 2 is more complex. The major portion of this procedure is a fast Fourier transform (FFT) sub- routine, which is implemented by the decimation- in-time, radix-2 algorithm. Because there are overlaps between spectral distributions of CCAPs and ACAPs, the partial F F T is usually used. For example, after the baseline wandering has been
SPECTRUM ANALYSIS ] J D I SPLAY SPECTRA J
IYES
[SET RA~E I
Ioo
t
l OISPLAY I
WA V E FORM F[ LENAME1
[S O E DATA I
Fig. 2. Flowchart of the spectrum analysis procedure.
corrected, the wave form of CCAPs can be se- lected by 2 vertical lines..on the screen. The values of the wave form intersected by the 21ines replace the original samples preceding and fol- lowing the CCAPs, respectively. Thus, 512 points of FFT can be performed as usual. The inverse
fast Fourier transform (IFFT) is also imple- mented in this procedure. This procedure is used to filter CAPs in the frequency domain. After the partial IFFT is performed, the filtered wave form can be stored for further processing by the other procedures.
An example of the use of this program is shown in Fig. 3. The filename of the data, fs0, is displayed on the left top corner of the screen and the procedure employed is shown at the top center. The wave form on the screen is adjusted automatically to occupy the maximal vertical space. The user can, nevertheless, change the vertical sensitivities as desires. All the calculated information is displayed on the right side. The instruction keys to command this program are displayed at the bottom. The pixels of the wave form are blanked on the screen if they have the same value as the baseline. This feature guides the determination of the baseline.
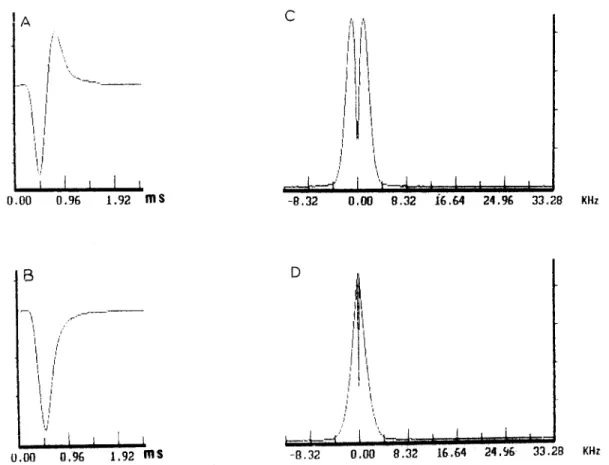
Spectral distribution of ACAPs
Fig. 4 is a representative example of spectral analysis of ACAPs. Both the monophasic and biphasic ACAPs had the highest frequency com- ponent at 4 kHz. The peak in the frequency spectrum of the biphasic ACAPs was at 1 kHz and that of the monophasic ACAPs was at 130 Hz.
fsO
m~
507'I
I
169.0 0 . 0 1 - 169.1! -3'38.1 -507. I -645, l Local area IJ
i
I I ;!J
Line I : 19'5.34 us -lg,21 Line 2 : 1743.02 L~ -7.~ Local Baseline : -6.ZO Aan~@ : 1%.34 us 1743.0~ us P e ~ s : Lower -~30.18 510.88 us U ~ r 534.67 811,40 Us p-p 1464.B4 ~75.32 tkluiFig. 3. An example of t h e u s e of the interactive program. The
Spectral distribution of CCAPs
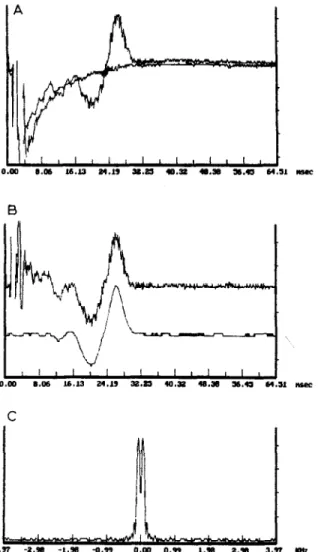
An example of the baseline wandering of CCAPs is shown in Fig. 5A. After wave form subtraction, most of the baseline wandering was corrected (the upper trace in Fig. 5B). The spec- tral distribution of the CCAPs was shown in Fig. 5C. The highest frequency component of the CCAPs was at 200 Hz. This was confirmed by partial IFFT the frequency spectrum below 200 Hz. The resulted wave .form was shown in the lower trace of Fig. 5B. It had the same shape as the upper trace except the high frequency noises. The peak in the frequency spectrum of the CCAPs was at 62 Hz.
Optimal ban@ass of the filter for the recording of
CAPs
Since the high frequency contents of the ACAPs were larger than those of the CCAPs, the
A '11 IIl~ I I 0.00 ~"r C
high-end cutoff frequency (fH) of the filter must be determined by the spectrum of the ACAPs. On the other hand, the low-frequency contents of the CCAPs were larger. Thus, the low-end cutoff frequency (fL) of the filter should be determined by the spectrum of the CCAPs. To determine the fH and
fL,
the spectra in Figs. 4 and 5 were digitally filtered with different cutoff frequencies by using the partial IFFT. Then, the recon- structed wave forms were subtracted from the original wave forms by using the wave form sub- traction procedure. Finally, the differences were integrated by using the local area procedure.When the ACAPs were low-pass filtered at 3.5 kHz, the change in the area of the biphasic ACAPs was 1.5% and that of the monophasic ACAPs was 1.9%. Further reducing the fH to 3 kHz increased the changes to 4.7 and 4.4%, re- spectively. When the frt was reduced to 2.5 kHz
o.96 t.92 ms -8.32 0.00 8.32 J6.64 24196 33.28 KHz B / / D
/II
,l!l
I I [, ~P 'r ) '~o.oo o,% 1.92 ITIS -8.32 0.00 8.32 1 6 , 6 4 24.% 33.29 KHz
Fig. 4. The analysis of ACAPs of a L6 dorsal root. A: biphasic ACAPs. B: monophasic ACAPs. C: spectral distribution of the
biphasic ACAPs. D: spectral distribution of the monophasic ACAPs. Conduction distance: 7.8 ram. Calibration: each vertical scale on the ordinates represents 4.00 mV for (A) and (B), 1.68 mV for (C) and 2.83 mV for (D).
A
,' t , I + 1 , I , I , I , t I
O.O0 0 . 0 6 .16.JLB ~ 1 . 1 9 ,~,.m,t 4 o .cut* M . 3 B ~ . ¢ 1 ~ t ~ l . ~ l
determine the bandpass of the filter. The fH should not be lower than 3 kHz if the acceptable distortion was set at 5%. The change in the area of the CCAPs was 3.5% when high-pass filtered at 15.5 Hz. Further increasing the fL to 31.0 HZ increased the change to 9.7%. Thus, the f L should not be higher than 15.5 Hz. The changes in areas of the ACAPs were too small to be accurately measured when high-pass filtered at 15.5 Hz.
IB ... 1 ' I I I i i I i I i I i I I 0 . 0 0 B , 0 6 X6.J.3 ~ 1 . 1 9 ~ . l l ~ 4 0 . ' ~ , 1 8 . 3 e ~ 6 . 4 ~ 6 , 1 . ~ 4 n s e e C - 3 . 9 7 - i t , M - 1 / 9 6 - 0 . 9 9 O.OO 0 . 9 9 l . g e 2.~16 3 . 9 T
Fig. 5. Analysis of CCAPs of a $2 dorsal root. A: upper trace shows the CCAPs obtained at supramaximal stimulation. The lower trace shows the CAPs obtained at threshold stimulation for C-fiber. B: the upper trace showed the resulted wave form after subtraction. The lower trace was the partial IFFT of the frequency spectrum of the upper trace below 200 Hz. C: spectral distribution of the CCAPs. Conduction distance: 9 ram. Calibration: vertical scales on the ordinates represent 60
/zV for (A) and (B), 50/,~V for (C).
Discussion
The optimal bandpass of the filter for the recording of CAPs was suggested from 10 Hz to 3 kHz. T h e r e are 2 reasons why the cutoff frequen- cies of the filter can be moved down into the spectral distribution of CAPs. First, frequency components outside this band are very small and do not necessarily at the same phase. Therefore, they do not add algebraically in the time domain. Furthermore, analog filters do not have infinite attenuation as the partial I F F T does. Thus, the distortion caused by the analog filters set in this bandpass should be much lower than 5%.
C-fiber of the sensory nerve includes tempera- ture-sensitive and nociceptive fibers (Darian- Smith, 1984; Perl, 1984). T h e program described in this investigation enables the users to measure the CAPs of C-fiber precisely and should, there- fore, be useful in studying the peripheral and central processing of these somatic inputs (Zimmermarin, 1968; Manfredi and Castellucci, 1969; Schouenborg, 1984). Furthermore, by dif- ferent combinations of the procedures in this program, many types of signal processing are possible. For example, the isolation of the CAPs of A-delta fibers from ACAPs can be achieved by the wave form subtraction procedure.
the changes were 11.9 and 9.1%, respectively. In comparison, when the ACAPs were filtered at either 3.5 kHz or 3 kHz, the peak amplitudes decreased 2.0 and 0.8% for the biphasic ACAPs and the monophasic ACAPs, respectively. Conse- quently, the change in the area was used to
Acknowledgment
This work was supported by grants N S C 8 0 - 0404-E002-10 and NSC80-0211-B002-02 from the National Science Council of Taiwan.
References
Darian-Smith, I. (1984) Thermal sensibility. In: I. Darian- Smith (Ed.), Handbook of Physiology, Section 1, Vol. 3, American Physiological Society, Bethesda, MD, pp. 879- 913.
Dong, W.K., Harkins, S.W. and Ashleman, B.T. (1982) Ori- gins of cat somatosensory far-field and early near-field evoked potentials, Electroenceph. clin. Neurophysiol., 53: 143-165.
Favaro, G., Gregorio, F.D., Panozzo, C. and Fiori, M.G. (1988) Ganglioside treatment of vincristine-induced neu- ropathy: an electrophysiologic study, Toxicology, 49: 325- 329.
Jaw, F.-S., Yen, C.-T., Tsao, H.W. and Yu, H.J. (1991) A modified 'triangular pulse' stimulator for C-fibers stimula- tion, J. Neurosci. Methods, 37: 169-172.
Landau, W.M., Clare, M.H. and Bishop, G.H. (19681 Recon- struction of myelinated nerve tract action potentials: an arithmetic method, Exp. Neurol., 22: 480-49(/.
Manfredi, M. and Castellucci, V. (1969) C-fiber responses in the ventrolateral column of the cat spinal cord, Science, 165! 1020-1022.
Perl, E.R. (19841 Pain and nociception. In: I. Darian-Smith (Ed.), Handbook of Physiology, Section 1, Voh 3, Ameri- can Physiological Society, Bethesda, MD, pp. 915-975. Schouenborg, J. (1984) Functional and topographical proper-
ties of field potentials evoked in rat dorsal horn by cuta- neous C-fibre stimulation, J. Physiol., 356: 169-192. Zimmermann, M. (1968) Dorsal root potentials after C-fiber