Improvement on Buffer Management Strategy to Enhance System Performance
5
0
0
全文
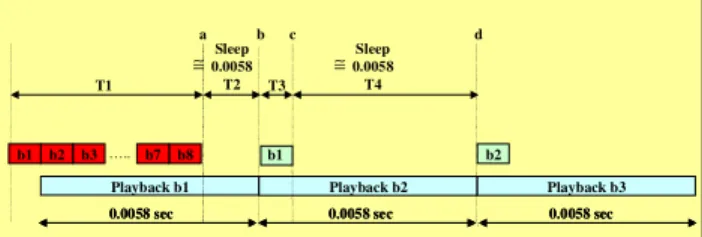
(2) a. ≅ T1. b1. b2. b3 ….. b7. b Sleep 0.0058 T2. b8. c. 2.1 up_trigger Level 3. d. ≅ T3. Sleep 0.0058 T4. b1. b2. Playback b1. Playback b2. Playback b3. 0.0058 sec. 0.0058 sec. 0.0058 sec. Figure2. Audio Playback DMA Buffer Usage. 2.up_trigger Method We hereby propose the “up_trigger Method” to reduce CS for system performance enhancement and to manage DMA buffer more flexibly. Figure 3 shows the “up_trigger Method” will accumulate the numbers and release more Semaphores each time. Task can write data to DMA buffer as same numbers of Semaphores getting after it wakes up. Comparing to the ” Kernel up Method ” , it will decrease the times of CS. For the “up_trigger Method”, there are several parts need to be amended and added in the Linux Kernel. (1) Add two fields for trigger_level and trigger_count in the“struct semaphore”. At first, trigger_level will be setting from 0 to (DMA number-2); trigger_count will be used to accumulate Semaphore when it arrives to (trigger_level+1). Then, task will be waked up and get Semaphores as same numbers of (trigger_level+1). Comparing to the ” Kernel up Method ” , the task can write (trigger_level+1) number of DMA buffer more than one. See Figure 3 for details. (2) Add sema_init_trigger function to set up the requested trigger level and trigger count. (3) Add up_trigger function to replace ”Kernel up Method”.. The “up_trigger Method” trigger_level=3 is submitted to explain the relationship between audio task and DMA buffer when executes audio playback. The testing results are as Table 2 showed. The “up_trigger Method” will accumulate 4 times of Semaphore when the trigger_level=3, the task in sleep will be around 4 times period of “Kernel up Method” (called Long Sleep), and it can write 4 DMA buffer in each Wake up. Figure 4 is the relationship between ” Kernel up Method”and “up_trigger Method” trigger_level=3, it shows the usage of DMA buffer in details. The main difference is “up_trigger Method” can save 3/4 #CS than ”Kernel up Method”to let other task keep going to improve the system performance. Besides, it can lower the power consumption due to the reduction of #CS. For the Power Saving, the efficiency is not good than the popular Shutdown Mechanism [2][3][4] and Kernel Scheduler [1] [5] caused they are based on P ∝V f theory. As to the power saving which “up_trigger Method” proposed is to reduce Task #CS then lower the switch between task’s stack and register. So, the effect of power saving is another benefit except performance improvement.. The #CS (Context Switches) relationships between “up_trigger Method” and ”Kernel up Method”can be defined as Equation (1). CS(up):CS ( up_trigger ) = 1:(trigger_level+1)..(1). 2. Times. Sec. 1. 0.000117000. 2. 0.000049000. 3. 0.000043000. 4. 0.000043000. 5. 0.000041000. 6. 0.000042000. 7. 0.000042000. 8. 0.000045000. 9. 0.022964999. 10. 0.000052000. 11. 0.000048000. 12. 0.000053000. 13. 0.023016000. 14. 0.000049000. Write Buffer Time. Trigger level = 3. Write Buffer Time + Long Sleep Time = (DMA Buffer Write Time + 4*Play 1024 bytes spend Time) ≅ 0.0058 * 4 = 0.0232 Long Sleep = Sleep * 4. Table 2. up_trigger level 3 Audio Playback Timing Audio Task Running. SNDCTL_DSP_SETFRAGMENT. Audio Task Sleep. Audio Write. DMA Interrupt. “Orginal” Method. up_trigger Method up_trigger Method set DMA trigger Level. No. Semaphore Available. up_trigger. Task Sleep. Audio Task Running. DMA Write. b2. DMA Write. b3. DMA Write. b4. up. Start Playback ….. b1 b2. Yes -. DMA Write. b1. up. ++sem->trigger_count> sem->trigger_level. b8. Playback1. Playback2. Playback3. Playback4. Playback5. 0.0058. 0.0058. 0.0058. 0.0058. 0.0058. YES No -. 0.000167 Context Time free for system used. DMA Write. b1. b2. b3. “up_trigger” Method. Task Wake up. Figure 4.Relationship Between “Original Method” and “up_trigger Method Level =3” Mechanism. Figure 3.“up_trigger Method”SDL Flow. - 206 -. b4.
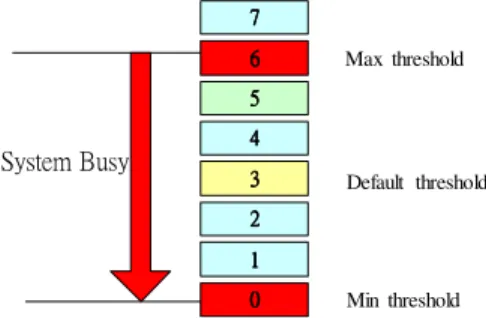
(3) 2.2 Trigger Level and Task Deadline Section 2.1 is a discussion on trigger_level=3 to verify the difference of execution between “up_trigger Method” and “ Kernel up Method ” . In fact, the Trigger level of “up_trigger Method” could be adjusted dynamically. For example, the range of trigger_level is from 0 to (the number of DMA Buffer – 2), as Figure 5 shows the trigger_level is from 0 to 6. When the system is busy, it can lower the trigger_level to prevent any miss deadline if the task cannot wake up on time; vice versa, it can raise the trigger_level to reduce the numbers of CS for performance improvement when the system is not busy.. Master. Child1. FIFO0. Child2. FIFO1. …... FIFO2. …... Figure 6.lat_ctx. 3.2 Context Switching Number. 7 6. The numbers of CS can be got from /proc/stat. We can cat it in console mode as below showed.. Max threshold. 5. System Busy. # cat /proc/stat ctxt xxxxx. 4 3. Default threshold. 2. rq->nr_ sw itche s. 1 0. Min threshold. To open /proc/stat file, read the file context and find out string of “ctxt”, the numbers of System CS will be learned after the string of “ctxt”.. Figure 5. trigger_level and System Status. 3.3 Buffer Copy Latency Cost. 3.Performance Evaluation Method In Section 3, it’s an introduction for the evaluation of system performance cost. The difference of performance and power consumption between “up_trigger Method” and ”Kernel up Method”will be implemented and be verified based on the Omap1710 platform.. 3.1 Context Switching Cost Benchmark. It is not objective enough due to the ”Kernel up Method”only can get the “Buffer Copy Latency“ cost from the first 8th times, as Table 1 showed. So, we defined the “Buffer Copy Latency“ from the average executing numbers of times. As Table 3 shows, it is “up_trigger Method” trigger_level=3 subtracting the timing of task long Sleep, i.e. the result of 45.79us is from the average of 100 times.. We will use the “lat_ctx” of Linux Open Source lmbench to measure the CS Cost. The main working theory is as Figure 6 (refer to (7)).The lat_ctx will fork “N” of child process from parent and combine together through “pipe-ring”. Parent will send “token” via “pipe-ring” to forward it in each process sequentially. All processes are in sleep except it received token. After last child task received token and send to parent, the cost of CS will be calculated by subtracting the needed transaction time. We can run lat_ctx benchmark as under showed. The testing frequency is 192MHz, and it takes 167.32us for CS.. # ./lat_ctx -s 0 2. Process Number Context Switch Cost. "size=0k ovr=14.38 2 167.32 us. Times. Sec. 1. 0.000117000. 2. 0.000049000. 3. 0.000043000. 4. 0.000043000. 5. 0.000041000. 6. 0.000042000. 7. 0.000042000. 8. 0.000045000. 9. 0.022964999. 10. 0.000052000. 11. 0.000048000. 12. 0.000053000. 13. 0.023016000. 14. 0.000049000. Task long Sleep Discard + Task long Sleep Discard. Table 3. Buffer Copy Latency Cost. - 207 -.
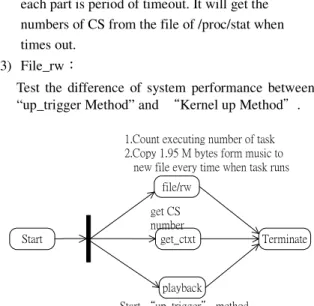
(4) 4.Implementation. 4.2 Power Consumption Testing. Following the test architecture as Figure 7 shows, it can measure the difference of performance and power consumption between “up_trigger Method” and “Kernel up Method”. Program of “Start” will run first and then forks 3 child. The functions of child task are as under: (1) Playback:. Based on Figure 7 test architecture, the testing result of power consumption in different conditions are as Figure 9 ~ Figure 11 show.. 250 mA. Playback Task has the function to start the “up_trigger Method” and “Calculating Buffer Copy Latency”…etc. (2) get_ctx:. Context Switching times Avg: 10251(* 1 minute) 200 mA 150 mA 100 mA. Divide the length of timing into 60 equal parts, each part is period of timeout. It will get the numbers of CS from the file of /proc/stat when times out. (3) File_rw:. 50 mA 0 0. 10 min. 20 min. 30 min. 40 min. 50 min. 1 hr. Current Average: 103.376 mA. Figure 9.File_rw + get_ctxt Power Consumption. Test the difference of system performance between “up_trigger Method” and “Kernel up Method”. 1.Count executing number of task 2.Copy 1.95 M bytes form music to new file every time when task runs. 250 mA. file/rw. Context Switching times Avg: 28628(* 1 minute) 200 mA. get CS number get_ctxt. Start. 150 mA. Terminate. 100 mA. playback. 50 mA. Start “up_trigger” method 0. Figure 7.Testing Architecture. 0. 10 min. 20 min. 30 min. 40 min. 50 min. 1 hr. Current Average: 115.014 mA. Figure 10. Kernel up Method Power Consumption. 4.1 Performance Testing The performance testing divided into 3 different conditions: (1) Pure Kernel Running, (2) Kernel up Method, (3) up_trigger Method Level = 3. The results are as Figure 8 shows. 12 hour Context Switching Number. Kernel Running. AVG CS#:. 250 mA. Context Switching times Avg: 13306(* 1 minute). 10448.2. 200 mA. Original Method(up) AVG CS#: 264774.1 File Copy#: 52465 up_trigger Method Level= 3 AVG CS#: 85794.6 File Copy#: 54139. #CS. 300000. 150 mA. 250000. 100 mA. 200000 150000. 50 mA. 100000 50000. 0. 0 1 3 5 7 9 11 13 15 17 19 21 23 25 27 29 31 33 35 37 39 41 43 45 47 49 51 53 55 57 59 (*12 minute). 0. 10 min. 20 min. Kernel up Method total #CS:16513340 up_trigger Method Level total #CS : 5774571. - 208 -. 40 min. 50 min. 1 hr. Current Average: 114.816 mA. Figure 11. up_trigger. Figure 8.#CS & File Copy testing. 30 min. Method Level =3 Power Consumption.
(5) 4.3 Testing Result. ﹝5﹞. Regarding the performance and power consumption of “up_trigger Method” trigger_level=3 and“Kernel up Method”, it can be discussed as followings. (1) #CS(Context Switching) reduction From Section4.1, it describes the #CS reduce 65% when executes 12 hours testing (see Figure 8) (16513340 – 5774571) / 16513340 = 65 % (2) Performance Enhancement From File Copy#, see Figure 8 up_trigger Method:Kernel up Method= 54139:52465 (times) In the same execution period, the “up_trigger Method” increase 1674 times file copy to improve the system performance: (54139-52465) / 52465 = 3.19 %. October, 2004. Wanghong Yuan, Klara Nahrstedt. “Energy-Efficient Soft Real-Time CPU Scheduling for Mobile Multimedia Systems”, in Proc. of 19th. ﹝6﹞ ﹝7﹞. ﹝8﹞. ACM Symposium on Operating Systems Principles (SOSP'03), Bolton Landing, NY, October, 2003. Understanding the Linux 2.6.8.1 CPU Scheduler. Hyok-Sung Choi, Hee-Chul Yun. “Context Switchinging and IPC Performance Comparison between uClinux and Linux on the ARM9 based Processor” ,http://opensrc.sec.samsung.com/docume nt/uc-linux-04_sait.pdf. Murali Vilayannur , Robert B. Ross, Philip H. Carns , Rajeev Thakur , Anand Sivasubramaniam , Mahmut Kandemir.“On the Performance of the POSIX I/O Interface to PVFS”, in Parallel, Distributed and Network-Based Processing, 2004. Proceedings. 12th Euromicro Conference on, pages 332- 339, 11-13 Feb. 2004.. (3) System Power Saving From Figure 9~ Figure 11 Kernel up Method= (115.014 - 103.376) = 11.664 up_trigger level 3 = (114.816 - 103.376) = 11.44 Power Saving:(11.664 - 11.44)/ 11.664 = 1.92%. ﹝9﹞. SuSE Linux AG, Nuremberg, Germany.“Sound Systems on Linux: From the Past To the Future”, Linux 2003 Conference, Edinburgh, Scotland.. ﹝10﹞. 5.Conclusion The “up_trigger Method” we submitted has outstanding aid for system performance improvement. Even though many researches based on P ∝V f are better than the way we proposed for the power saving. But, “up_trigger Method” doesn’t need any extra effort to get the effect via reducing the quantity of CS. The “up_trigger Method” compares with “Kernel up Method”, it has following advantages: 1. System performance enhancement 2. Power consumption decrease 3. Easy implement for “up_trigger Method” (see Section 2 for details). Selim Gurun , Chandra Krintz.“AutoDVS: An Automatic, General Purpose , Dynamic Clock Scheduling System for HandHeld Devices” , in. 2. ﹝11﹞. ﹝12﹞. ﹝13﹞. References. Proceedings of the Fifth ACM International Conference on Embedded Software (EMSOFT'05), pages 218-226, September 2005. MontaVista Linux Dynamic Power Management for OMAP 161x GSM/GPRS Software Development Platform Dynamic Power Management for Embedded Systems IBM and MontaVista Software, White Paper, November 2002. http://www.mvista.com/ Bishop Brock, Karthick Rajamani.“Dynamic Power Management for Embedded Systems”, in Proceedings of the IEEE Int'l SoC Conference. ﹝1﹞. ﹝2﹞. ﹝3﹞. David Tam,Winnie Tsang,Catalin Drula.“Dynamic. (SoCC 2003), September 2003.. Voltage Scaling in Mobile Devices” , CSC2228. ﹝14﹞. Project Final Report December 15, 2003. Luca Benin, Robin Hodgson, Polly Siege1. “System-level Power Estimation And. ﹝15﹞. Bill Weinberg.“MontaVista Software Building. Optimization” , in Proc. Symp. Low Power. Intelligent Devices with MontaVista Linux. Electronics, pages 173-178, Oct. 1998. Xue Wu.“Dynamic Power Management Technique. http://www.linuxpundit.com/cv/docs/wp_cee.pdf. and Its Application on A Multiprocessor Architecture”. http://www.cs.umd.edu/~wu/paper/DPM_Final.doc ﹝4﹞. Yung-Hsiang Lu, Giovanni De Micheli. “Comparing System-Level Power Management Policies” , IEEE Design Test Computers,2001,18(2):10-19.. Wanghong Yuan,Klara Nahrstedt.“Practical Voltage Scaling for Mobile Multimedia Devices”, in Proc. of ACM Multimedia 2004, New York, NY,. - 209 -. Consumer Electronics Edition”..
(6)
數據
相關文件
Department of Computer Science and Information
Department of Computer Science and Information
Professor of Computer Science and Information Engineering National Chung Cheng University. Chair
2 Department of Materials Science and Engineering, National Chung Hsing University, Taichung, Taiwan.. 3 Department of Materials Science and Engineering, National Tsing Hua
Department of Physics and Institute of nanoscience, NCHU, Taiwan School of Physics and Engineering, Zhengzhou University, Henan.. International Laboratory for Quantum
Assistant Professor, Industrial Engineering and Management Chaoyang University of Technology. Chen Siao Gong JULY 13 , 2009 Chen
● In computer science, a data structure is a data organization, management, and storage format that enables efficient access and
Department of Computer Science and Information Engineering, Chaoyang University of
