A QoS Buffer Mangement for Multiple Class: GREEN
15
0
0
全文
(2) A QoS Buffer Mangement for Multiple Class: GREEN. Lain-Chyr Hwang1 , Cheng-Yuan Ku2 , Huan-Ying Lo3 , Choun-Shin Jie4 1,4. Department of Electrical Engineering, I-Shou University, Taiwan, Email: {lain , m9001022}@isu.edu.tw 2 Department of Information Management, National Chung Cheng University, Taiwan Email: coopercy@ms16.hinet.net 3 Department of Information Engineering, I-Shou University, Taiwan Email: m883301m@isu.edu.tw. Abstract-QoS is eager for the future networking, especially for the multimedia networks. The QoS control algorithm can be implemented in a node of multimedia networks to achieve the QoS. This paper proposes a QoS buffer management algorithm, named as GREEN (Global Random Early Estimation for Nipping) to efficiently control the resource to meet the QoS requirement. Different from other buffer management algorithm, GREEN includes the consideration of QoS parameter. In the numerical, extensive numerical cases are used to show the outperformance and characteristics.. I.. INTRODUCTION. QoS is the necessary trend in the future networks. For example, in the Internet, IntServ [1] and DiffServ [2] have been proposed. Owing the granularity and complexity, IntServ is suit to the intranet and DiffServ to the Internet at current state. Not only in the Internet but also in the other multimedia distribution networks, it is necessary to implement the QoS control mechanism to meet the different QoS requirements of different media sources. This paper studied a QoS buffer management scheme considering multiple QoS requirements. This GREEN [3] algorithm has two special features: one is the consideration of QoS requirement and the other is the multiple QoS consideration. The most innovation over the most popular RED algorithm is the inclusion of QoS requirement [3]. Many researchers have used buffer management schemes to improve the QoS, e.g. Drop tail [4-6], Random Drop [4,5], Early Random Drop (ERD) [4,5], Random Early Detection (RED) [4,7], and so on. For “Early”, ERD used queue length and a threshold, but RED utilized mean queue size and two thresholds. Actually, ERD and RED are quite similar. The different points had been detailedly descried in [4]. The pro and con are not absolute between the usage of queue.
(3) length and the usage of average queue length. The detailed comparison can be found in [3] and [4]. The buffer management algorithms are roughly classified along the following two dimensions [7]: when the packet discard decisions are made and what information is used. On the other hand, the authors think the design issues of buffer management algorithms can be widely and detailedly considered as follows: The principles to execute the buffer management; The judging criteria; The choice of packet; The punishment; and The reaction of end systems. In general cases, the above issues may be considered by integrating some of them. For example, ERD and RED integrated issues 1 and 2, and did not discuss issue 5. According to the popular algorithms in the past and combining our points of view discussed above with the dimensions mentioned in [7], the design issues of a buffer management can be divided into two major classes. One is the consideration of “Early or not.” The other is the consideration of “Random or not” [3]. Combination of “Early” and “Random” is the main stream of buffer management schemes. It started from ERD and was enhanced in RED. In fact, ERD had pointed out the key of the main stream. But, RED enhanced ERD by two new ideas, i.e. non-fixed random probability and marking packets instead of discarding them. GREEN cannot stray off this main stream.. II.. GREEN ALGORITHM. GREEN use Global Random and Early Estimation for Nipping packets. That is, GREEN still uses the combination of "Early" and "Random", but elaborates them to a most complete realm. GREEN extends the random feature to a global random that considers not only the network statuses but also the QoS requirements. The Global Random probability of GREEN is named Nipping probability. Pn .. Furthermore, GREEN extends Early Detection to Early Estimation, which uses the variation of network statuses to estimate the future status. In this way, GREEN can get the information of network status earlier than just detection and can speed up the decision- making. Finally, in order to avoid the misunderstand and to make the acronym elegant, for detailed reasons see [3], GREEN uses "Nipping" replacing the term "Marking" in RED. The system consists of a common buffer with size k and an output link with bandwidth B . There are M QoS classes in the input traffic, described by the loss requirement l[i] and delay requirement d[i], and specified at call setup or by the user/ISP. Assume the maximum packet length of all the input packets is Lmax . The GREEN algorithm used queue length as judging criterion, like ERD, but unlike.
(4) RED. The nipping threshold is the queue length beyond which the arrival packet may be nipped according to the nipping probability Pn . [4] takes the count of unmarked packets into the marking probability. GREEN modified it to make the nipping intensity stronger when the queue length over the threshold and the packets continuously. GREEN as that in RED, where. cp. /( 1 − 2. cp. Pe _ pre ) , in. is the count of un-nipped packets after the last nip,. Pe _ pre is a. entering the buffer. Consequently, there is a similar term, modified as Pe _. pre. pre-calculated entropy probability, which comes from the property of Early Estimation and like the pb in RED. The Global Random property of GREEN is exhibited at the components of nipping probability, which consists of not only network statuses but also QoS requirements. The former resulted in the term Pe _ pre /( 1 − 2. cp. Pe _ pre ) . The latter becomes more important in the future networks. It is natural to nip a. packet, if some of its QoS requirement cannot meet. In this way, the resource will not be wasted for those invalid packets, and the system goodput, i.e. the valid throughput seen by a higher layer, can be increased. Here, GREEN considered two QoS parameters, delay requirement and loss requirement. The delay is estimated by. q/ B ,. where q is the queue length. If the estimated delay is greater than the delay ∧. requirement, the arrival packet will be nipped. Similarly, the estimated loss probability for class-i Pl [i ] , obtained by a weighted moving average and by assuming the arrival packet nipped, is expressed by ∧. Pl [i ] = wl [i ]{ L /( L + cb [i ])} + (1 − wl [i]) Pl [i ] , where. w l [i ]. is the weight of class-i to estimate the loss probability, L is the size of the arrival packet,. cb[i ]. is the count of accumulated amount (in length unit, e.g. byte) of un-nipped class-i packets, and. Pl [i ]. is the actual loss probability of class-i at current time. If the loss requirement is greater than or. equal to the estimated loss probability, i.e., the loss requirement is still satisfied, then the arrival packet can be nipped if necessary. On the contrary, when the loss requirement can not be satisfied, the arrival packet should not be nipped if possible. Consequently, the nipping probability can be expressed by.
(5) Pn = max U ( q / B − d [ i ]), [( Pe _ where. U (x). pre. /(1 − 2. cp. Pe _. ∧ )] U ( l [ i ] − P pre l [i ]) , . (1). is the unit step function defined as. 0 if x < 0, U ( x) = 1 if x ≥ 0. The two unit step functions are arranged to make the nipping probability equal to 1 when the delay requirement is not satisfied or, as far as possible, equal to 0 when the loss requirement is not satisfied. The Early Estimation property of GREEN makes up the entropy probability. Pe ,. which is used to. represent the normalized entropy to which the strength of nipping a packet is correspond ing and is in terms of the buffer occupancy and the link bandwidth occupancy. If queue length variation is denoted by ∆q. and calculated by moving average with a weight. wq ,. then it is expressed by. ∆ q ← w q ( q − q pre ) + (1 − w q ) ∆ q . where q pre is the queue length seen by the previous arrival packet. By using s = k − (q + ∆q) to estimate the left space, a component. 2 min( − s , 0 ). contributes to. Pe. to make the nipping probability of. next arrival packet larger, if the left space is smaller. The increasing rate of this component is exponential, not linear as RED. It performs the urgency better than the linear rate when space is critical, and the exponent of 2 has the easiness of implementation. Furthermore, a component u / B is included to make the entropy probability larger, if the available bandwidth is smaller, where. u. is the used link. bandwidth averaged during a time window T. If the packet arrives at during a busy period, the found by. u. can be.
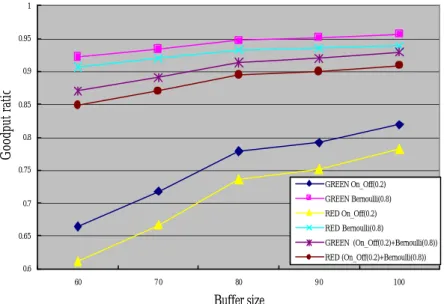
(6) u ←. LT + L − ( T. L )u B ,. where LT is the total packet length of the last time window. On the other hand, when the packet arrives at during an idle period, the u is given by u←. LT + L − (. L + A − I )u B , T. where A is the inter-arrival between this packet and the previous entering packet, and I is the time of min(− s , 0 ) (u / B ) . the idle period. Finally, the entropy probability can be expressed by Pe = 2. One more thing to mention about is the term Pe _ pre /(1 − 2 some large. 2. cp. 2. cp. > (1 − Pe _. cp. Pe _ pre ) in (1). It is possible for. to make the term greater than 1 or negative. Similar to [3], if pre. ) / Pe _. pre. , Pe _ pre /(1 − 2. III.. cp. Pe _ pre ) is assigned to be 1.. NUMERICAL EXAMPLES. Assume there are two traffic types. One type is an on-off process and the other is a Bernoulli process. The load of total traffic is 1, and the ratios of loads of the on-off process to the Bernoulli process are 2:8 and 8:2 that are used to simulate different degree of burstiness. The packet length is modeled as uniform between 1 and. Lmax . The time unit, denoted by tick, is normalized as the. transmission time of one length unit by the link. The k is 100, except Cases 1 and 3. The except Case 2. The. L max. Tn. is 50,. is 19, except Case 3. The parameters in the counterpart RED are the same,. except the maximum threshold, the minimum threshold, the max p and the weight for calculating the average queue length are. Tn ,. Tn / 2 , 0.02, and 0.002 respectively. The weights for calculating the. queue length variation and the estimated loss ratio in every class are both equal to 0.6 [3]. The goodput ratios shown in figures are the total packet size ratios of valid accepted packets to all generated packets..
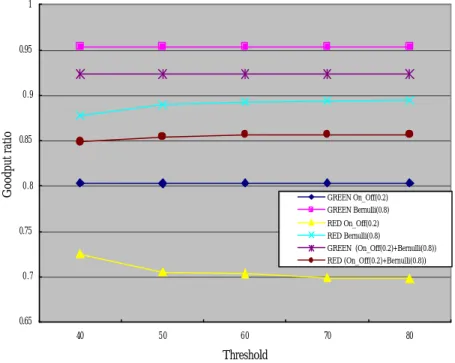
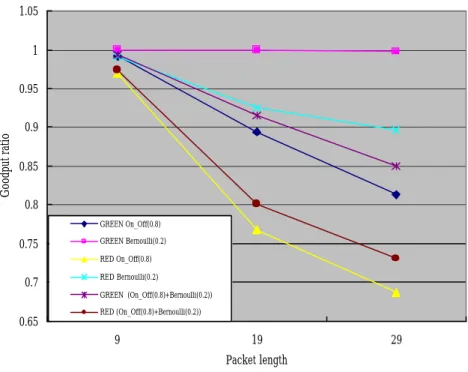
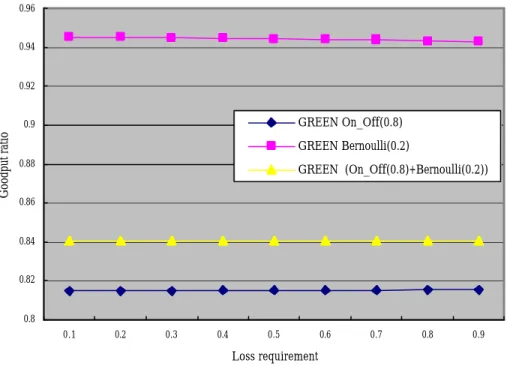
(7) A.. Case 1: Buffer size In this case, the delay requirement equals k-10 and loss requirement is 1. From figures 2-3, it is. obvious that the GREEN outperforms RED and the goodput ratio increases when the buffer size increases. Furthermore, it can be seen the burstiness destroys the performance, so the results of figure 3 is worse than those of figure 2 and the results of on-off is worse than those of Bernoulli.. B.. Case 2: Threshold The delay requirements for both types are 10 and loss requirements are 1. Figures 4-5 also show the. outperformance of GREEN. Besides, GREEN has a good characteristic to keep the goodput ratio when the nipping threshold changes, but RED does not. With this characteristic, the system designer will not worry about how to assign the threshold. This result comes from the exponential increasing rate which makes nipping at critical point, not just by the threshold. As regards the burstiness effect, it is the same as Case 1.. C.. Case 3: Maximum packet length In this case, the buffer size is 200, the delay requirement for on-off is 150 and for Bernoulli is 180,. and loss requirement is 1. From figures 6-7, obviously, GREEN outperforms RED and the performance decays for larger packet size because it enters the buffer with more difficulty. The burstiness effect is the same as that in Case 1.. D.. Case 4: loss requirement This case is used to demostrate a good characterisc of GREEN which can keep the overall goodput.. In this case, the delay requirement for both type are 100 and the loss requirement for on-off is 1. In figure 8, the goodput ratio of Bernoulli decreases as loss requirement becomes looser, but the goodput ratio of on-off increases and that of overall traffic keeps the same level. That is owing to GREEN will differentially treat the traffics with different QoS requirement so as to nip the packets of looser requirement to accomadate the packets of stricter requirement and keeps the buffer utilization.. E.. Case 5: Delay requirement In this case, the loss requirements for two types are both 1. The delay requirement for on-off.
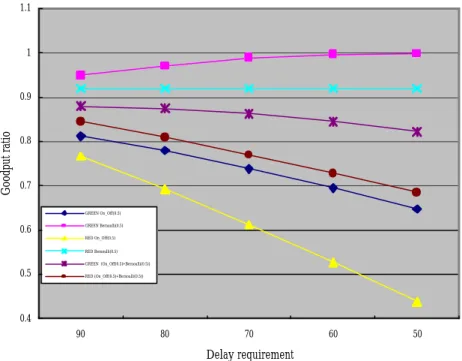
(8) changes and that for Bernoulli is fixed at 90. Again, from figure 9-10, GREEN is better than RED. It also can be seen there is growth and decline of goodput ratios in GREEN, but not in RED, because the GREEN filters out the invalid packets of on-off to leave the buffer for the Bernoulli traffic. Of course, the influence of burstiness is still the same as Case 1. However, the phenomenon of RED is much worse. This phenomenon illustrates that it is sure to have worse performance at more bursty traffic and the GREEN can alleviate the aggravation.. IV. CONCLUSIONS AMD FUTURE WORKS. Owing to the concern of QoS parameter, the GREEN algorithm outperforms over the RED algorithm. Also owing to the concern of the multiple QoS classes, the input type with stricter requirement may have lower goodput ratio and the damage can be made up from the increase of the goodput ratio of the input type with looser requirement. Consequently, the GREEN algorithm for multiple QoS classes can really make full use of the network resources including the buffer and the bandwidth capacity. However, there is something in GREEN needed further study. First, the GREEN algorithm may be improved to make the system performance better and to be more efficient for implementation. Secondly, there still needs more numerical examples to probe the characteristics of the system using GREEN algorithm.. REFERENCES. [1] R. Braden, D. Clark, and S. Shenker, "Integrated services in the Internet architecture: an overview," Internet RFC 1633, June 1994. [2] S. Blake, D. Blake, M. Carlson, E. Davies, Z. Wang, and W. Weiss, "An architecture for differentiated services," Internet RFC 2475, Dec. 1998. [3] Lain-Chyr Hwang, Cheng-Yuan Ku, Steen J. Hsu, and Huan-Ying Lo, "QoS Buffer Management of Multimedia Networking with GREEN algorithm," JCN., vol. 3, no. 4, pp. 334-341, Dec. 2001. [4] S. Floyd and V. Jacobson, ”Random Early Detection Gateways for Congestion Avoidance,” IEEE/ACM trans. networking, vol.1, no.4, pp.397-413, 1993..
(9) [5] E. Hashem, “Analysis of random drop for gateway congestion control”, Rep. LCS TR-465, Lab. for Comput. Sci., M.I.T., p.103, 1989. [6] L. Zhang, “A new architecture for packet switching network protocols”, MIT/LCS/TR-455, Lab. for Comput. Sci., M.I.T., 1998. [7] R. Guerin and V. Peris, ”Quality-of-service in packet network: basic mechanisms and direction”, Computer Networks, vol. 31, 1999, pp.169-189..
(10) Initialization: do while (system up) if (system idle and I_flag=1) I=system time I_flag=0 System++ For each packet arrival i=the class of the arrival A=system time ∆q ← wq (q − q pre ) + (1 − wq )∆q. Pe = 2 min(q +∆q −k,0 ) (u / B ) q pre = q ∧. Pl [i] = wl [i]( L[i ] /(cb [i ] + L[i ])) + (1 − wl [i]) Pl [i ] if (Buffer full ) Drop the packet For all i ∧. Pl [i ] = P l [i ]. cp = 0 c b [ i] = 0. else if ( q > T n ) ∧ C Pn = maxU(q/ Ba −d[i]),[min( Pe _pre /(1−2 p Pe _ pre),1)]U(l[i]−Pl [i]) . Pe _ pre = Pe. if (a random value <. Pn ). Nip the packet For all i ∧. Pl [i ] = P l [i ]. cp = 0 c b [ i] = 0. else accept the packet. u = ( Lt + L − u( L / B)) / T c b [ i] + = L [ i ]. c p [ i] + +. else if queue empty. u = ( Lt + L − u( L / B + A − I )) / T I_flag=1; else Accept the packet. u = ( Lt + L − u( L / B)) / T cp = 0 c b [ i] = 0. Figure1.. The GREEN algorithm.
(11) 1. 0.95. Goodput ratio. 0.9. 0.85. 0.8. 0.75 GREEN On_Off(0.2) GREEN Bernoulli(0.8). 0.7. RED On_Off(0.2) RED Bernoulli(0.8). 0.65. GREEN (On_Off(0.2)+Bernoulli(0.8)) RED (On_Off(0.2)+Bernoulli(0.8)). 0.6 60. 70. 80. 90. 100. Buffer size. Fig. 2 Results as buffer size changes (low-bursty). 1. 0.95. Goodput ratio. 0.9. 0.85. 0.8. 0.75 GREEN On_Off(0.8). 0.7. GREEN Bernoulli(0.2) RED On_Off(0.8) RED Bernoulli(0.2). 0.65. GREEN (On_Off(0.8)+Bernoulli(0.2)) RED (On_Off(0.8)+Bernoulli(0.2)). 0.6 60. 70. 80. 90. 100. Buffer size. Fig. 3 Results as buffer size changes (high- bursty).
(12) 1. 0.95. Goodput ratio. 0.9. 0.85. 0.8 GREEN On_Off(0.2) GREEN Bernulli(0.8) RED On_Off(0.2). 0.75. RED Bernulli(0.8) GREEN (On_Off(0.2)+Bernulli(0.8)) RED (On_Off(0.2)+Bernulli(0.8)). 0.7. 0.65 40. 50. 60. 70. 80. Threshold. Fig. 4 Results as threshold changes (low-bursty) 1. 0.95 GREEN On_Off(0.8) GREEN Bernulli(0.2). 0.9. RED On_Off(0.8) RED Bernulli(0.2). Goodput ratio. GREEN (On_Off(0.8)+Bernulli(0.2)) RED (On_Off(0.8)+Bernulli(0.2)). 0.85. 0.8. 0.75. 0.7. 0.65 40. 50. 60. 70. 80. Threshild. Fig. 5 Results as threshold changes (high-bursty).
(13) 1.05. 1. 0.95. Goodput ratio. 0.9. 0.85. 0.8 GREEN On_Off(0.2). 0.75. GREEN Bernoulli(0.8) RED On_Off(0.2) RED Bernoulli(0.8). 0.7. GREEN (On_Off(0.2)+Bernoulli(0.8)) RED (On_Off(0.2)+Bernoulli(0.8)). 0.65 9. 19. 29. Packet length. Fig. 6 Results as packet length changes (low-bursty). 1.05 1. Goodput ratio. 0.95 0.9 0.85 0.8 GREEN On_Off(0.8). 0.75. GREEN Bernoulli(0.2) RED On_Off(0.8). 0.7. RED Bernoulli(0.2) GREEN (On_Off(0.8)+Bernoulli(0.2)) RED (On_Off(0.8)+Bernoulli(0.2)). 0.65 9. 19. 29. Packet length. Fig. 7 Results as packet length changes (high-bursty).
(14) 0.96. 0.94. 0.92. GREEN On_Off(0.8) GREEN Bernoulli(0.2). 0.88. GREEN (On_Off(0.8)+Bernoulli(0.2)). 0.86. 0.84. 0.82. 0.8 0.1. 0.2. 0.3. 0.4. 0.5. 0.6. 0.7. 0.8. 0.9. Loss requirement. Fig. 8 Results as loss requirement changes. 1.1. 1. 0.9. Goodput ratio. Goodput ratio. 0.9. 0.8. 0.7. 0.6. GREEN On_Off(0.2) GREEN Bernoulli(0.8) RED On_Off(0.2). 0.5. RED Bernoulli(0.8) GREEN (On_Off(0.2)+Bernoulli(0.8)) RED (On_Off(0.2)+Bernoulli(0.8)). 0.4 90. 80. 70. 60. 50. Delay requirement. Fig. 9 Results as delay requirement changes (low-burst).
(15) 1.1. 1. Goodput ratio. 0.9. 0.8. 0.7 GREEN On_Off(0.5). 0.6. GREEN Bernoulli(0.5) RED On_Off(0.5) RED Bernoulli(0.5) GREEN (On_Off(0.5)+Bernoulli(0.5)). 0.5. RED (On_Off(0.5)+Bernoulli(0.5)). 0.4 90. 80. 70. 60. 50. Delay requirement. Fig. 10 Results as delay requirement changes (high-bursty).
(16)
數據
+2
相關文件
Propose eQoS, which serves as a gene ral framework for reasoning about th e energy efficiency trade-off in int eractive mobile Web applications. Demonstrate a working prototype and
• Any node that does not have a local replica of the object periodically creates a QoS-advert message contains (a) its δ i deadline value and (b) depending-on , the ID of the node
In this chapter, we have presented two task rescheduling techniques, which are based on QoS guided Min-Min algorithm, aim to reduce the makespan of grid applications in batch
To improve the quality of reconstructed full-color images from color filter array (CFA) images, the ECDB algorithm first analyzes the neighboring samples around a green missing
In order to improve the aforementioned problems, this research proposes a conceptual cost estimation method that integrates a neuro-fuzzy system with the Principal Items
This research project tries to examine the issues of domestic green hotel service design, integrating QFD and VAHP, as well as to construct green criteria and their
The purpose of this thesis is to propose a model of routes design for the intra-network of fixed-route trucking carriers, named as the Mixed Hub-and-Spoke
This paper aims the international aviation industry as a research object to construct the demand management model in order to raise their managing
