Taipei Medical University.
P
roving
t
hat
n
o
m
atter
w
hat
t
he
b
rands
o
f
b
alanced
n
utritional
f
ormulas
i
s,
i
t
c
an
m
aintain
o
r
i
mprove
t
he
t
ube-fed
p
atient’s
n
utritional
c
ondition.
I
ntroduction
As the number of patients who receive enteral tube feeding is increasing. More and more commercial formula products are available in market..
S
ubjects and Methods
R
results and Discussion
Fong KC, Wu PY, Yang SH
School of Nutrition and Health Sciences, Taipei Medical University
To evaluate that difference between the brands of balanced nutritional formulas for enteral feeding could maintain or improve the patient’s nutritional status.
Subject who have been completely tube-fed for a consecutive of 3 months and must be > 20 year were recruited from 6 nursing home. We conducted those study by time series study design during 3 months period. Observation period (month 0), no change to their original tube feeding formula. Investigators (or the patients’ guardian) will record the patients’ amount of intake, condition of digestion and the condition of stool.
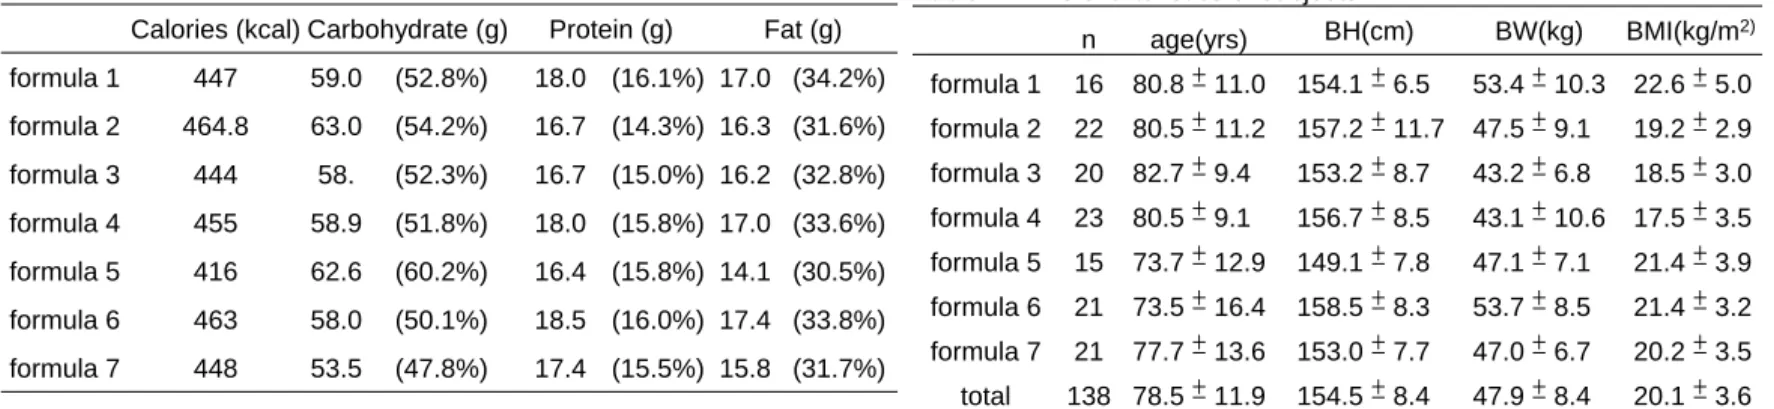
Table 1 is a list of three major nutrients of 100g of tube feeding formula. There were total 138 subjects (55 men and 83 women). The total average of age is 78.5 ± 11.9 years, height is 154.5 ± 8.4cm, weight is 47.9 ± 8.4kg, BMI is 20.1 ± 3.6; Table 2 is the characteristic. Formula 1: Cr, GPT; formula 2: alb, bun, Cr, GPT, GNRI; formula 3: BW, BMI, BUN, HGB; formula 4: BUN, GOT; formula 5: alb, GPT, HGB, GNRI; formula 7: HGB increase significantly. Formula 5: BUN, Cr decrease significantly (Table 3).
There are no significant difference existed among those balanced nutritional formulas and those formula could maintain or improve the patient’s nutritional condition.
P
urpose
Intervention period (month 1), our trial tube feeding formula are assigned to our subjects. The blood sample is examined by Laboratory of TMUH (Taipei Medical University Hospital).
We performed paired t-test and one-way ANOVA by using SAS for Windows 9.01 statistic software. Moreover, we use Scheffe for post-hoc analysis. When p < 0.05 means significant difference in statistic.
Table 1:Three major nutrients of 100g of tube feeding formula1
Calories (kcal) Carbohydrate (g) Protein (g) Fat (g) formula 1 447 59.0 (52.8%) 18.0 (16.1%) 17.0 (34.2%) formula 2 464.8 63.0 (54.2%) 16.7 (14.3%) 16.3 (31.6%) formula 3 444 58. (52.3%) 16.7 (15.0%) 16.2 (32.8%) formula 4 455 58.9 (51.8%) 18.0 (15.8%) 17.0 (33.6%) formula 5 416 62.6 (60.2%) 16.4 (15.8%) 14.1 (30.5%) formula 6 463 58.0 (50.1%) 18.5 (16.0%) 17.4 (33.8%) formula 7 448 53.5 (47.8%) 17.4 (15.5%) 15.8 (31.7%)
1values are expressed as number (%)
Table 2:The charteristics of subjects1,2
n age(yrs) BH(cm) BW(kg) BMI(kg/m2) formula 1 16 80.8 ± 11.0 154.1 ± 6.5 53.4 ± 10.3 22.6 ± 5.0 formula 2 22 80.5 ± 11.2 157.2 ± 11.7 47.5 ± 9.1 19.2 ± 2.9 formula 3 20 82.7 ± 9.4 153.2 ± 8.7 43.2 ± 6.8 18.5 ± 3.0 formula 4 23 80.5 ± 9.1 156.7 ± 8.5 43.1 ± 10.6 17.5 ± 3.5 formula 5 15 73.7 ± 12.9 149.1 ± 7.8 47.1 ± 7.1 21.4 ± 3.9 formula 6 21 73.5 ± 16.4 158.5 ± 8.3 53.7 ± 8.5 21.4 ± 3.2 formula 7 21 77.7 ± 13.6 153.0 ± 7.7 47.0 ± 6.7 20.2 ± 3.5 total 138 78.5 ± 11.9 154.5 ± 8.4 47.9 ± 8.4 20.1 ± 3.6
1values are expressed as mean ± SD; 2BW, Body weight; BH,
Body height; BMI, Body mass index, BW (kg) / BH (m2)
Table 3:Receiving different formulas for tube feeding: before-after difference in weight, BMI, blood biochemical index1,2
BW BMI Alb BUN Cr GOT GPT HGB HCT GNRI
formula 1 0.7 ± 2.3 0.3 ± 1.0 0.1 ± 0.4 0.9 ± 4.9 -0.1 ± 0.1* 1.4 ± 10.9 5.6 ± 8.9* -0.3 ± 1.3 -0.8 ± 3.4 1.8 ± 4.1 formula 2 0.4 ± 3.0 0.2 ± 1.3 0.5 ± 0.4* 6.1 ± 4.6* 0.1 ± 0.1* 18.9 ± 73.8 12.1 ± 26.5* 0.2 ± 1.0 0.1 ± 3.0 7.1 ± 6.1* formula 3 1.8 ± 1.6* 0.8 ± 0.6* 0.1 ± 0.5 6.1 ± 7.0* 0.0 ± 0.1 4.1 ± 7.7* 2.8 ± 8.1 0.5 ± 0.9* 1.2 ± 2.6 3.1 ± 7.1 formula 4 0.2 ± 0.9 0.1 ± 0.4 0.1 ± 0.4 8.6 ± 7.0* 0.0 ± 0.1 4.0 ± 8.0* 3.1 ± 7.6 -0.4 ± 1.2 -1.4 ± 3.6 0.9 ± 6.0 formula 5 -0.4 ± 2.5 -0.2 ± 1.1 0.4 ± 0.3* -1.7 ± 2.0* -0.1 ± 0.1* 4.5 ± 9.0 9.7 ± 10.8* 0.5 ± 0.7* 0.8 ± 1.9 6.0 ± 5.6* formula 6 0.3 ± 2.1 0.1 ± 0.8 -0.1 ± 0.3 -0.2 ± 3.2 0.0 ± 0.1 -2.3 ± 6.3 -3.3 ± 9.1 0.1 ± 1.3 0.5 ± 3.5 -1.4 ± 4.4 formula 7 0.4 ± 2.1 0.1 ± 0.9 0.0 ± 0.3 -1.9 ± 7.6 0.1 ± 0.1 2.2 ± 21.2 -1.2 ± 13.1 0.4 ± 0.9* 0.1 ± 2.5 0.7 ± 4.1
1values are expressed as mean ± SD
2BW, body weight: BMI, body mass index, body weight (kg) / body height (m2);Alb, albumin; BUN, blood urea nitrogen; Cr, creatinine; GOT, glutamate oxaloacetate
transaminase; GPT,glutamic pyruvic transaminase; HGB, hemoglobin; HCT, hematocrit; GNRI, geriatric nutritional risk index, [1.489*albumin (g/L)]+[ 41.7*(body weight/idea body weight)]