行政院國家科學委員會專題研究計畫 成果報告
財務報表舞弊探索與類神經網路(第 2 年)
研究成果報告(完整版)
計 畫 類 別 : 個別型
計 畫 編 號 : NSC 98-2410-H-004-049-MY2
執 行 期 間 : 99 年 08 月 01 日至 100 年 07 月 31 日
執 行 單 位 : 國立政治大學資訊管理學系
計 畫 主 持 人 : 蔡瑞煌
共 同 主 持 人 : 林宛瑩
計畫參與人員: 博士班研究生-兼任助理人員:黃馨瑩
報 告 附 件 : 出席國際會議研究心得報告及發表論文
處 理 方 式 : 本計畫可公開查詢
中 華 民 國 100 年 07 月 29 日
行政院國家科學委員會補助專題研究計畫
■成果報告
□期中進度報告
財務報表舞弊探索與類神經網路
計畫類別:■個別型計畫 □整合型計畫
計畫編號:NSC 98-2410-H-004-049
-MY2
執行期間: 99 年 8 月 1 日至 100 年 7 月 31 日
執行機構及系所:國立政治大學資訊管理學系
計畫主持人:蔡瑞煌
共同主持人:林宛瑩
計畫參與人員:黃馨瑩
成果報告類型(依經費核定清單規定繳交):□精簡報告 ■完整報告
本計畫除繳交成果報告外,另須繳交以下出國心得報告:
□赴國外出差或研習心得報告
□赴大陸地區出差或研習心得報告
■出席國際學術會議心得報告
□國際合作研究計畫國外研究報告
處理方式:
除列管計畫及下列情形者外,得立即公開查詢
□涉及專利或其他智慧財產權,□一年□二年後可公開查詢
中 華 民 國 100 年 7 月 29 日
摘要
財務報表舞弊不僅對股東造成顯著的投資危機,也掀起資本市場的財務風暴。雖然財務報表的舞弊已
經引起許多關注,但大部分相關研究者著重在預測財務危機和破產,而鮮少聚焦在對財報舞弊本身知
識的探討。本研究旨在透過以下四個階段而對財報舞弊有更深的了解。
(1) 從文獻中整理出財務和公司治理方面和財報舞弊相關的所有指標,然後用統計分析方法採擷、獲得
和財報舞弊顯著相關的指標;
(2) 利用 Growing Hierarchical Self-Organizing Map (GHSOM)之人工智慧分群方法來對正常及舞弊的財
報資料分群;
(3) 剖析分群的財報資料以及利用專家之研判,以擷取財報舞弊的相關知識;
(4) 再利用專家來研判所採擷的財報舞弊的相關知識之可信度。
因為人工智慧分群方法可以從龐大的資料中找尋隱藏的階層關聯;所以學理上,這項研究是可行的。
在第一年,這項研究計畫著重於財務和公司治理方面和財報舞弊相關的所有指標之文獻整理,然後利
用統計分析方法採擷、獲得和財報舞弊相關的顯著指標;並且利用
GHSOM 分群方法來對正常及舞弊
的財報資料分群。在第二年,研究計畫套用所得之
GHSOM 來對舞弊的財報之起訴書和判決書做分群,
再利用專家之研判,以對每一群起訴書和判決書擷取財報舞弊的相關知識。
關鍵字:財務報表舞弊,GHSOM 人工智慧分群方法,知識萃取
ABSTRACT
Fraudulent financial reporting (FFR) has drawn much public as well as academic attention. However, the
extant literature review reveals that prior FFR-related research focused on the nature or the prediction of FFR
and that there is no study that extracts FFR features – the delicate but hid-den truths regarding FFR – from
very large quantities of FFR data through tools of artificial intelligence. On the other hand, artificial
intelligence techniques play an important role in accomplishing the task of financial fraud detection. Via
conducting a Growing Hierarchical Self-Organizing Map (GHSOM) application to FFR samples of Taiwan,
this study justifies the theoretical benefits of feature-extracting through GHSOM. Specifically, for each leaf
node of GHSOM, this study uncovers common fraudulent techniques from corresponding FFR indictments
and sentences of clustered samples without referring to the attributes of input variables. The acknowledge that
different leaf nodes have distinctive common fraudulent techniques can confirm the ability of GHSOM in
extracting features in terms of exogenous variables that are more abundant and more informative than
endogenous variables.
THE EXOGENOUS ISSUE OF FEATURE EXTRACTION
Introduction
Fraudulent Financial Reporting (FFR), or financial statement fraud, involves the intentional misstatement
or omission of material information from an organization’s financial reports (Beasley et al. 1999). Although
with the lowest frequency, FFR casts a severe financial impact with median losses of $2 million per scheme
(ACFE 2008). These are cases that often have severe consequences in terms of not only significant risks for
stockholders and creditors but also financial crises for the capital market.
However, the following extant literature review reveals that prior FFR-related research focused on the
nature or the prediction of FFR and that there is no in-depth study that explores FFR features – the delicate
but hidden truths regarding FFR – extracted from very large quantities of FFR data through tools of artificial
intelligence (AI). The nature-related FFR research often uses the case study approach and provides a
descriptive analysis of the characteristics of FFR and techniques commonly used. For instance, the Committee
of Sponsoring Organizations (COSO) and the Association of Certified Fraud Examiners (ACFE) regularly
publish their own analysis on fraudulent financial reporting of U.S. companies. Based on the FFR samples,
COSO examines and summarizes certain key company and management characteristics. ACFE analyzes the
nature of occupational fraud schemes and provides suggestions to create adequate internal control
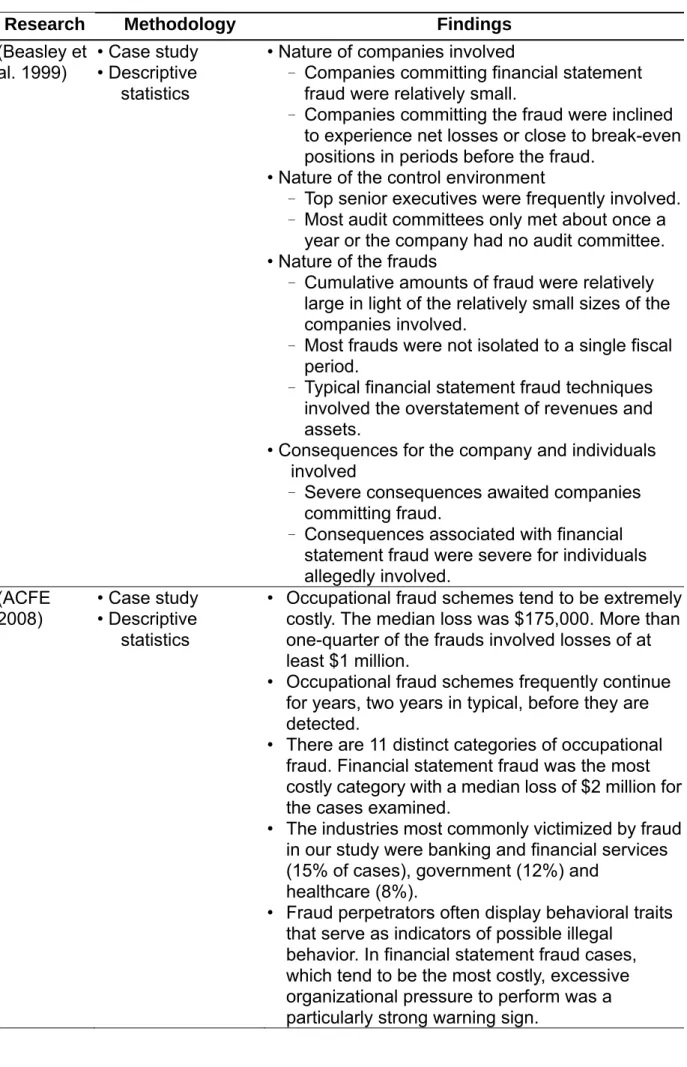
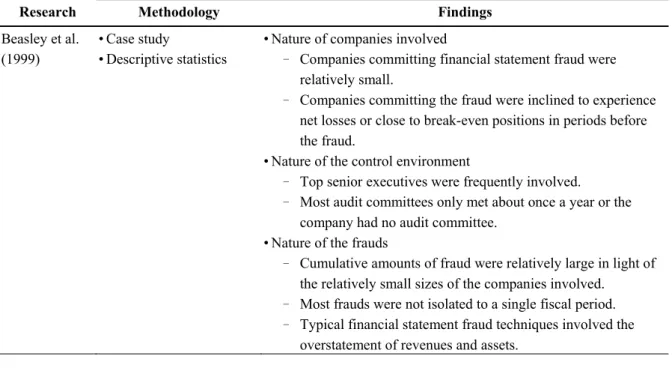
mechanisms. Table 1 summarizes the research methodology and findings in nature-related FFR studies.
<Insert Table 1 here>Other FFR researches often apply the empirical approach to archival data and identify significant variables
that help predict the occurrence of fraudulent reporting. Such research emphasizes the predictability of the
model used. For example, logistic regression and neural networks techniques are used in this line of research
(Bell and Carcello 2000; Fanning and Cogger 1998; Kirkos et al. 2007; Persons 1995; Virdhagriswaran and
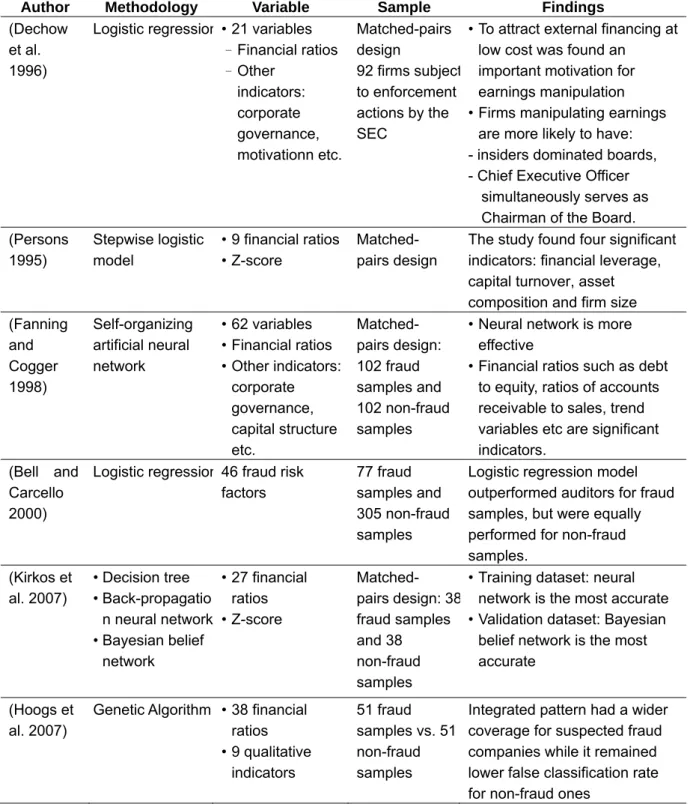
Dakin 2006). Table 2 summarizes the research methodology and findings of prediction-related FFR studies.
<Insert Table 2 here>On the other hand, AI techniques play an important role in accomplishing the task of financial fraud
detection (FFD) that involves distinguishing fraudulent financial data from authentic data, disclosing
fraudulent behavior or activities, and enabling decision makers to develop appropriate strategies to decrease
the impact of fraud (Ngai et al. 2010). One of popular AI techniques is Self-Organizing Map (SOM) proposed
by Kohonen (1982), a Neural Networks tool that conducts an unsupervised learning to produce a
low-dimensional view of high-dimensional data. SOM has been applied to FFD scenarios such as credit card,
automobile insurance and corporate fraud (Severin 2010; Ngai et al. 2010). There are several weaknesses of
SOM, however. For instance, its size (and thus topology) needs to be predefined and fixed and it is unable to
provide hierarchical relations amongst samples.
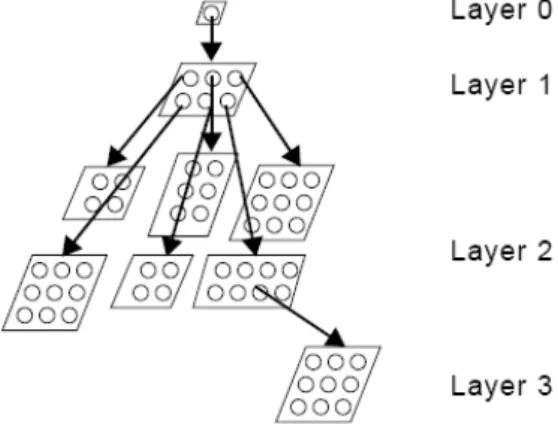
Growing Hierarchical Self-Organizing Map (GHSOM) proposed in (Dittenbach et al. 2000; Rauber et al.
2002) addresses the issue of fixed network architecture of SOM through developing the multilayer
hierarchical network structure, in which, as shown in Figure 1, each layer contains a number of SOMs. The
training process of GHSOM can be summarized in the following four phases (Dittenbach et al. 2000):
(1) Initialize the layer 0 and the layer 1: SOM of layer 0 consists of only a single node (group) whose weight
vector is initialized as the expected value of all imported samples. Then the mean quantization error
(MQE) of layer 0 (MQE
0) is calculated. Hereafter, MQE of a node denotes the mean quantization error
the node. SOM of layer 1 initially has four nodes each of whose weight vectors is initialized randomly.
Then apply the following three phases to the SOM of layer 1 and SOMs of its subsequent layers.
(2) Train every individual SOM: Within the training process of an individual SOM, the sample is imported
one by one. The distances between the imported sample and the weight vectors of all nodes are
calculated. The node with the shortest distance is selected as the winner. Under the competitive learning
principle, only the winner and its neighboring nodes are qualified to adjust their weight vectors. Repeat
the competition and the training until the learning rate decreases to a certain value.
(3) Grow horizontally each individual SOM: Each individual SOM will grow until the mean value of MQEs
of all nodes on the SOM (MQE
m) is smaller than the MQE of the parent node (MQE
p) multiplied by τ
1.
That is, the criterion for the stoppage of growth is MQE
m< τ
1× MQE
p. If the stopping criterion is not
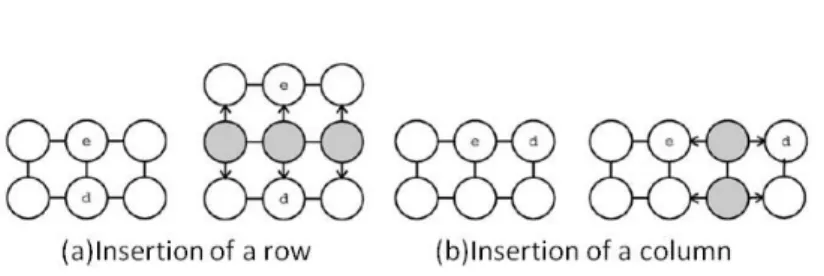
satisfied, identify the error node that owns the largest MQE and then, as shown in Figure 2, insert one
row or one column of new nodes between the error node and its dissimilar neighbor.
(4) Expand or terminate the hierarchical structure: After the horizontal growth phase of individual SOM,
MQE of each node (MQE
i) is compared with the value of MQE
0multiplied by τ
2. The node with an
MQE
iless than τ
2× MQE
0will become a leaf node that does not own a subsequent layer of SOM. The
node with an MQE
igreater than τ
2× MQE
0will develop a subsequent layer of SOM that initially has
four nodes each of whose weight vectors is initialized randomly. In this way, the hierarchy grows until all
leaf nodes satisfy the stopping criterion MQE
i< τ
2× MQE
0.
<Insert Figure 1 here> <Insert Figure 2 here>
2001) (Shih et al. 2008) (Soriano-Asensi et al. 2008). These applications show that GHSOM is a useful tool to
extract relevant features from the vast amount of information or data.
Theoretically, there are several benefits when applying GHSOM to extracting features. First, with the
unsupervised learning nature, there are no predefined categories into which samples are to be classified; rather,
the GHSOM system will develop its own feature representation of the sample with a competitive learning
algorithm. Second, GHSOM classifies the sample into tons of small-sized leaf nodes (subgroups) with
hierarchical relationship such that further and more delicate analyses are feasible. Third, due to a competitive
learning nature GHSOM works as a regularity detector that is supposed to discover statistically salient
features of the sample population (Rumelhart and Zipser 1985). That is, extracted features in different leaf
nodes are distinctive.
Via conducting a GHSOM application to FFR samples of Taiwan, the study wants to justify the theoretical
benefits of feature-extracting mentioned above. Specifically, there are three objectives of the study: First,
based upon certain significant input variables derived from the FFR literature and some statistical tool, FFR
samples are classified into several small-sized leaf nodes of GHSOM. Second, unlike the traditional
approaches that interpret the outcome of a model via its input variables, this study uncovers the (common)
FFR features from the fraud samples clustered in each leaf node without referring to the attributes of input
variables. Suppose the FFR feature that we are interested in is the common fraudulent techniques used by the
fraud samples. Therefore, for each leaf node, the regularity of fraudulent techniques is uncovered from
indictments and sentences issued by the Department of Justice without referring to the attributes of input
variables. Such way of uncovering common fraudulent techniques can avoid the predicament of
examine whether different leaf nodes have distinctive common fraudulent techniques of FFR. Since common
fraudulent techniques are extracted from corresponding FFR indictments and sentences that are concluded
from more information than the values of derived variables, it is arguable whether GHSOM can obtain the
corresponding relation between common fraud techniques and derived variables. With acknowledging that
different leaf nodes have distinctive common fraudulent techniques, the study confirms the corresponding
relation between common fraud techniques and input variables that GHSOM has obtained implicitly.
The study may also contribute to the FFR literature at least as follows. Any FFR feature uncovered in
certain leaf node is applicable to all samples clustered in that leaf node. For each leaf node, this principle and
any pre-warning signals provided by features can result in some FFR audit guideline. Furthermore, with
distinctive FFR features extracted from different leaf nodes and a ton of leaf nodes, a further analysis of
associations between FFR features and corresponding clustered samples can provide insights of FFR.
The remainder of this paper is organized as follows. Section two reports the data preprocessing with the
discriminate analysis. Section three presents the sample and the outcomes of GHSOM. Section four provides
the extracted FFR feature of some subgroups. The last section concludes with a summary of findings,
implications, and suggestions for future works.
Data preprocessing
Sample for data preprocessing
The following sources were used to identify the fraud sample: indictments and sentences for major
securities crimes issued by the Securities and Futures Bureau of the Financial Supervisory Commission, class
action litigation cases initiated by Securities and Futures Investors Protection Center, and the law and
year is confirmed to be fraudulent by indictments and sentences for major securities crimes issued by the
Department of Justice, it is classified into our fraud observations, as to that company’s financial statements
free from fraud allegations they are classified into our non-fraud observations.
The matched-sample design is used to form a sample composite of 116 publicly traded companies,
including 58 fraud and 58 non-fraud ones between the years of 1992 to 2006. For each fraud firm, we match a
non-fraud firm based on industry, total assets, and year. For each fraud company, we first identified the
earliest year in which financial statement fraud was committed. The sample periods cover two years before
and two years after the year of the event. That is, five consecutive annual financial statements were used in
our study. The final observations used in the study consisted of 580 firm-year observations, i.e., 580 annual
financial statements were examined in the research.
For the 58 fraud firms, 113 annual financial statements were confirmed to have committed financial report
fraud (henceforth fraud samples) and 177 annual financial statements were free of allegations of such fraud
(henceforth non-fraud samples). As to the 58 non-fraud firms, 290 non-fraud samples were included. In brief,
our final research samples were comprised of 113 fraud samples and 467 non-fraud samples. The composite
ratio of fraud samples to non-fraud samples was 113:467. On average, approximately two fraudulent financial
statements (1.95 = 113/58) were included for each fraud firm. It is worth noting that of the 113 fraud samples,
there are 78 fraudulent financial statements and 35 restated financial statements. The firms that provided the
35 restated statements were the ones that survived financial scandals and whose restated statements were in
compliance with government regulations. The restated financial statements can be perceived as reflecting the
firms’ true financial positions that lead to the occurrences of the fraudulent financial reporting behavior. Such
mixture of data mimics the environment of information in the real world which prevails with both true and
false data.
Variable measurement and discriminant analysis
Based upon FFR literature, 25 explanatory variables are selected and incorporated into the discriminant
analysis. Table 3 summarizes the definition and measurement of these variables. These are measurement
proxies for attributes of profitability, liquidity, operating ability, financial structure, cash flow ability, financial
difficulty, and corporate governance of a firm. These explanatory variables are collected from the Taiwan
Economic Journal (TEJ) database.
<Insert Table 3 here>
We first test the multi-collinearity issue between explanatory variables. The unreported results indicate that
GIS should be excluded. As a result, 24 independent variables are incorporated in the Canonical Discriminant
Analysis as shown in model (1).
DBCBSCFR DBVRCFR SMLSR SPR Score -Z CFRR CFAR CFR LFTFA DR ITTA ARTTA GARS GI GAR TAT ART QR CR GNI GS ROA OPR GPM RAUD F 24 23 22 21 20 19 18 17 16 15 14 13 12 11 10 9 8 7 6 5 4 3 2 1
(1)
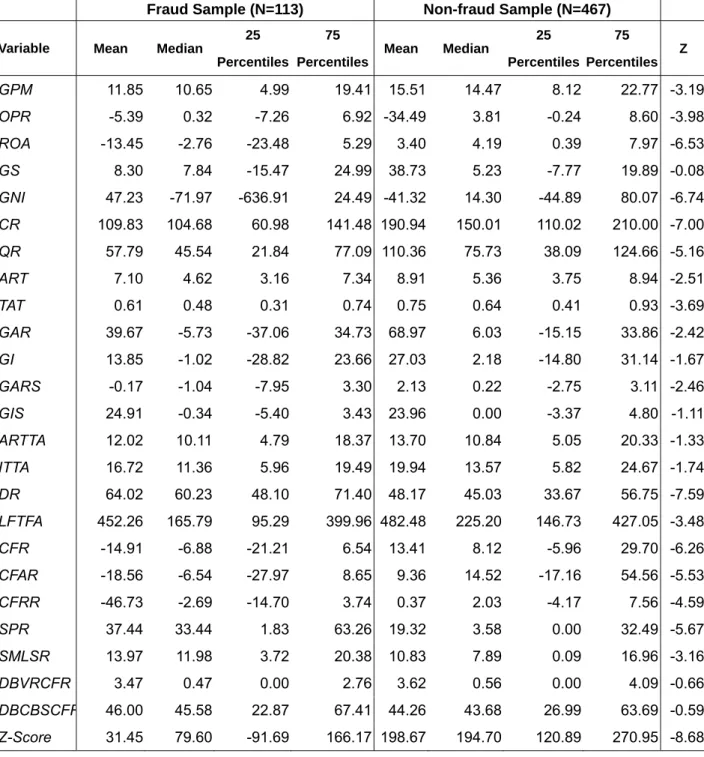
Table 4 shows the descriptive statistics of the variables, including the mean, median, 25 percentiles and 75
percentiles. Column Z means one result of non-parametric test. Except GS, GIS, DBVRCFR, DBCBSCFR,
other variables do have different statistical features between the fraud and non-fraud samples.
<Insert Table 4 here>
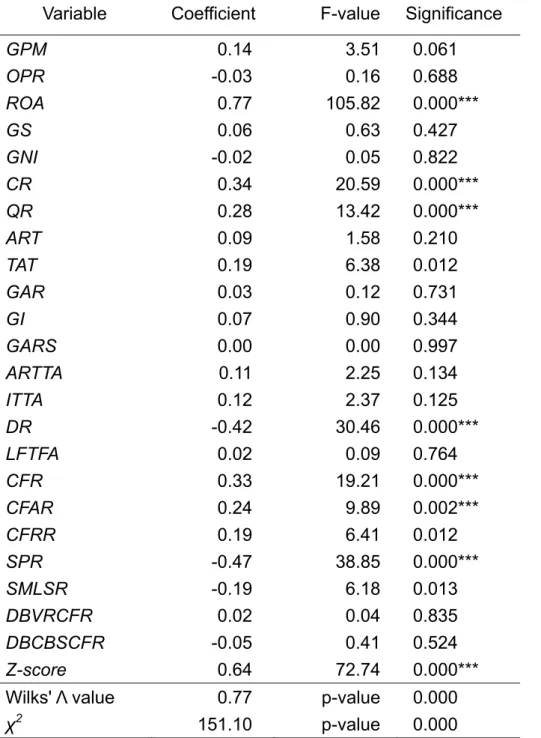
Table 5 shows the empirical results of the discriminant analysis and shows that the Wilks' Λ value equals
0.766 and x
2equals 151.095 (both significant at p-value < 0.01), which indicates that the discriminant model
employed has adequate explanatory power. Table 5 indicates that eight variables, ROA, CR, QR, DR, CFR,
a company’s attributes from the aspects of profitability (ROA), liquidity (CR and QR), financial structure (DR),
cash flow ability (CFR and CFAR), financial difficulty (Z-Score), and corporate governance (SPR).
<Insert Table 5 here>
Sample and Growing Hierarchical Self Organizing Map
These eight variables chosen from discriminant analysis were collected for our 113 fraud samples and used
as the training data for GHSOM. To have the prevention of overly clustering fraud samples, we set up the
following predefined selection criteria to pick a suitable GHSOM:
(1) There is more than one layer of SOM in the GHSOM.
(2) Samples of each mapping should not be overly clustered into any one of child nodes.
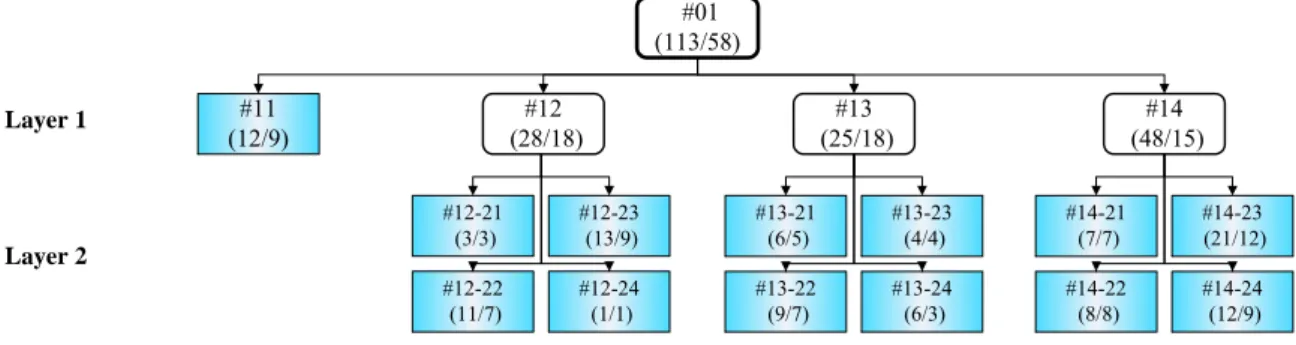
Figure 3 shows the sample distribution of the obtained GHSOM (with τ
1being 0.8 and τ
20.07), in which
leaf nodes are marked in taint. In each node, there is a name given according to its layer number and its node
order in the same SOM as well as its parent’s name. For instance, the node #12-21is node number 1 in layer 2
developed from the node number 2 of layer 1. In each node, the numbers within the parenthesis indicate the
number of fraudulent financial statements and the number of (fraud) firms.
<Insert Figure 3 here>
Common Fraudulent Techniques
To refer to fraudulent techniques that are generally accepted, here the ten fraudulent techniques from
(Beasley et al. 1999) are used. That is, there are three basic types of fraudulent techniques: Improper Revenue
Recognition, Overstatement of Assets, and Others. Improper Revenue Recognition includes recording
fictitious revenues (FT1), recording revenues prematurely (FT2), and no description/overstated revenues
(FT3). Overstatement of Assets includes overstating existing assets (FT4), recording fictitious assets or assets
not owned (FT5), and capitalizing items that should be expensed (FT6). Others includes understatement of
expenses/liabilities (FT7), misappropriation of assets (FT8), inappropriate disclosure (FT9), and other
miscellaneous techniques (FT10).
For demonstration purposes, we take merely the three leaf nodes, #11, #14-21, and #14-24 to illustrate the
parts of uncovering the regularity of fraudulent techniques from the corresponding indictments and sentences
for major securities crimes issued by the Department of Justice. Table 6 summarizes the fraudulent techniques
commonly adopted by companies clustered in these three leaf nodes. The code and year in the first two
column of Table 6 lists the company code and the year of each clustered financial statement.
<Insert Table 6 here>As shown in Table 6, common fraudulent techniques found in leaf node #11 are FT1, FT6 and FT8; in leaf
node #14-24 are FT1, FT4 and FT8; and in leaf node #14-21 are FT4 and FT8. In sum, Table 6 shows that the
observed common fraudulent techniques in different leaf nodes are distinctive even though samples are
clustered based upon corporate financial situations proxied by input variables (i.e., the eight variables
identified from discriminant analysis).
Compared to the traditional fraudulent technique classification scheme, such a contrast demonstrates the
advantage of our approach since our classification outcomes appear to be more delicate. For instance, some
fraud samples in leaf node #11 were found using FT1 via creating fictitious transactions and defrauding export
drawbacks from the Internal Revenue Service by reporting fictitious export sales. Moreover, some fraud
samples used FT8 by processing the receipt and payment in advance. In contrast, some fraud samples in leaf
node #14-24 were found to have been using FT4 through purchasing intangible asset/long-term investment
with high premiums. Some fraud samples used FT8 through related party transactions and merger and
acquisition activities to misappropriate cash.
Conclusion
In the data preprocessing stage, a sample set comprised of 113 fraud samples and 467 non-fraud samples is
used to identify eight significant variables regarding FFR via the discriminant analysis. Based upon the
(identified) variables as inputs, GHSOM clusters 113 fraud samples into 13 (small-sized) leaf nodes.
Distinguishing this study from others of feature extraction is that, for each leaf node, common fraud
techniques are disclosed with the assistance of expert knowledge in examining corresponding FFR
indictments and sentences (exogenous information) of clustered samples without referring to the attributes of
input variables. With acknowledging that different leaf nodes have distinctive common fraudulent techniques,
the study confirms the corresponding relation between common fraud techniques (an exogenous variable) and
input variables that GHSOM has obtained implicitly as well as the abilities of GHSOM in (1) extracting
features from exogenous information that are more abundant and more informative than input variables and (2)
classifying exogenous variables in terms of input variables. To go further to uncover the corresponding
relation between common fraud techniques and input variables is one of future works.
The systematic and integrated approach extended from the study is capable of constructing cause and
effect evidence of FFR. In addition, accumulating FFR features can help investigate as well as detect the
nature and possibility of FFR in future reporting. For instance, based upon the observed regularity of common
fraudulent techniques in each leaf node, we could identify the relevant financial indicators as the signal which
reveals the potential fraudulent activities for any samples clustered into this leaf node by GHSOM. When a
new sample is imported into the obtained GHSOM, if the distance deviation between the input vector and the
weight vector of winner node is less than a predefined threshold
, then the new sample is assigned as the
(fraud) member of that subgroup; otherwise, as the non-fraud. Based upon the assignment, we can develop
another systematic and integrated approach that helps capital providers (including investors and creditors)
make their investment or credit decisions as well as can help auditors perform prudent audit planning and
audit judgment. Such extended approach can also assist individuals such as corporate board members whose
responsibility is to monitor the performance of top management and who may need to play a more proactive
risk reduction role by designing and performing extended procedures as part of the fraud deterrence
engagements.
Other future works are suggested as follows: (1) to refine the GHSOM to get a better classification
mechanism or to identify better ways in extracting FFR features from the outcomes of GHSOM; (2) to
investigate the generality of our approach using data from other countries; and (3) to examine the prediction
ability of each result extended from the study.
References
ACFE. 2008. 2008 Report to the nation on occupational fraud & abuse, Association of Certified Fraud
Examiners, Austin, TX.
Altman, E.I. 1968. "Financial ratios, discriminant analysis and the prediction of corporate bankruptcy,"
Journal of Finance (23:4), pp 589-609.
Beasley, M.S., Carcello, J.V., and Hermanson, D.R. 1999. Fraudulent financial reporting: 1987-1997 COSO,
New York.
Bell , T.B., and Carcello, J.V. 2000. "A decision aid for assessing the likelihood of fraudulent financial
reporting," Auditing: A Journal of Practice & Theory (19), pp 169-184.
Dechow, P.M., Ge, W., Larson, C.R., Sloan, R.G., and Investors, B.G. 2007. "Predicting material accounting
manipulations," AAA 2007 Financial Accounting and Reporting Section (FARS) Paper [Electronic Version]
(1001), December 13, 2007 p48109. Retrieved December 13, 2007 from http://ssrn.com/abstract=997483.
Dechow, P.M., Sloan, R.G., and Sweeney, A.P. 1996. "Causes and Consequences of Earnings Manipulation:
An Analysis of Firms Subject to Enforcement Actions by the SEC," Contemporary accounting research
(13:1), pp 1-36.
Dittenbach, M., Merkl, D., and Rauber, A. 2000. "The growing hierarchical self-organizing map," Proceedings
of the IEEE-INNS-ENNS International Joint Conference on Neural Networks, IJCNN, pp. 15-19.
financial data," Intelligent Systems in Accounting, Finance & Management (7:1), pp 21-41.
Green, B.P., and Choi, J.H. 1997. "Assessing the risk of management fraud through neural network
technology," Auditing (16), pp 14-28.
Hoogs, B., Kiehl, T., Lacomb, C., and Senturk, D. 2007. "A genetic algorithm approach to detecting temporal
patterns indicative of financial statement fraud," Intelligent Systems in Accounting, Finance &
Management (15:1-2), pp 41-56.
Kirkos, E., Spathis, C., and Manolopoulos, Y. 2007. "Data Mining techniques for the detection of fraudulent
financial statements," Expert Systems with Applications (32:4), pp 995-1003.
Kohonen, T. 1982. "Self-organized formation of topologically correct feature maps," Biological cybernetics
(43:1), pp 59-69.
La Porta, R., Lopez-de-Silanes, F., Shleifer, A., and Vishny, R. 1999. "Corporate ownership around the
world," Journal of Finance (54:2), pp 471-517.
Lee, T.S., and Yeh, Y.H. 2004. "Corporate governance and financial distress: evidence from Taiwan,"
Corporate Governance: An International Review (12:3), pp 378-388.
Ngai, E.W.T., Hu, Y. , Wong , Y.H., Chen, Y., and Sun, X. 2010. "The application of data mining techniques in
financial fraud detection: A classification framework and an academic review of literature", Decision
Support Systems, In Press, Accepted Manuscript, Available online 19 August 2010.
Persons, O.S. 1995. "Using financial statement data to identify factors associated with fraudulent financial
reporting," Journal of Applied Business Research (11), pp 38-46.
Rauber, A., Merkl, D., and Dittenbach, M. 2002. "The growing hierarchical self-organizing map: exploratory
analysis of high-dimensional data," IEEE Transactions on Neural Networks (13:6), pp 1331-1341.
Rumelhart, D.E., and Zipser, D. 1985. "Feature discovery by competitive learning*," Cognitive Science (9:1),
pp 75-112.
Schweighofer, E., Rauber, A., and Dittenbach, M. 2001. "Automatic text representation, classification and
labeling in European law," ACM, p. 87.
Séverin, E. 2010. "Self organizing maps in corporate finance: Quantitative and qualitative analysis of debt and
leasing," Neurocomputing (73:10-12), pp. 2061-2067
Shih, J., Chang, Y., and Chen, W. 2008. "Using GHSOM to construct legal maps for Taiwan's securities and
futures markets," Expert Systems with Applications (34:2), pp 850-858.
Soriano-Asensi, A., Martin-Guerrero, J., Soria-Olivas, E., Palomares, A., Magdalena-Benedito, R., and
Serrano-Lopez, A. 2008. "Web mining based on Growing Hierarchical Self-Organizing Maps: Analysis of
a real citizen web portal," Expert Systems with Applications (34:4), pp 2988-2994.
Stice, J.D. 1991. "Using financial and market information to identify pre-engagement factors associated with
lawsuits against auditors," Accounting Review (66:3), pp 516-533.
Summers , S.L., and Sweeney, J.T. 1998. "Fraudulently misstated financial statements and insider trading: An
empirical analysis," Accounting Review (73:1), pp 131-146.
Virdhagriswaran, S., and Dakin, G. 2006. "Camouflaged fraud detection in domains with complex
relationships," ACM, pp. 941-947.
Yeh, Y., Lee, T., and Woidtke, T. 2001. "Family control and corporate governance: Evidence from Taiwan,"
Table 1: Research methodology and findings in nature-related FFR studies.
Research Methodology
Findings
(Beasley et
al. 1999)
• Case study
• Descriptive
statistics
• Nature of companies involved
–
Companies committing financial statement
fraud were relatively small.
–
Companies committing the fraud were inclined
to experience net losses or close to break-even
positions in periods before the fraud.
• Nature of the control environment
–
Top senior executives were frequently involved.
–
Most audit committees only met about once a
year or the company had no audit committee.
• Nature of the frauds
–
Cumulative amounts of fraud were relatively
large in light of the relatively small sizes of the
companies involved.
–
Most frauds were not isolated to a single fiscal
period.
–
Typical financial statement fraud techniques
involved the overstatement of revenues and
assets.
• Consequences for the company and individuals
involved
–
Severe consequences awaited companies
committing fraud.
–
Consequences associated with financial
statement fraud were severe for individuals
allegedly involved.
(ACFE
2008)
• Case study
• Descriptive
statistics
• Occupational fraud schemes tend to be extremely
costly. The median loss was $175,000. More than
one-quarter of the frauds involved losses of at
least $1 million.
• Occupational fraud schemes frequently continue
for years, two years in typical, before they are
detected.
• There are 11 distinct categories of occupational
fraud. Financial statement fraud was the most
costly category with a median loss of $2 million for
the cases examined.
• The industries most commonly victimized by fraud
in our study were banking and financial services
(15% of cases), government (12%) and
healthcare (8%).
• Fraud perpetrators often display behavioral traits
that serve as indicators of possible illegal
behavior. In financial statement fraud cases,
which tend to be the most costly, excessive
organizational pressure to perform was a
particularly strong warning sign.
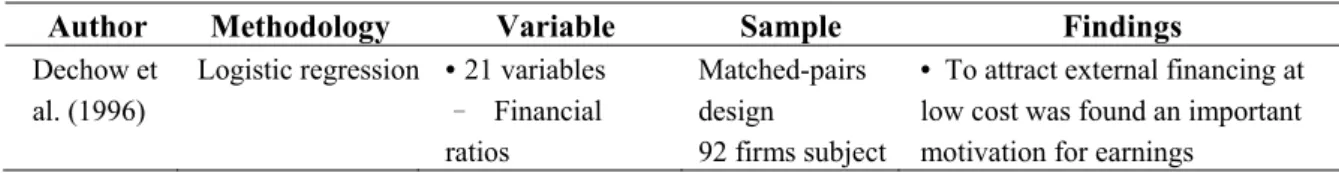
Table 2: Research methodology and findings in FFR empirical studies.
Author Methodology Variable Sample Findings
(Dechow et al. 1996)
Logistic regression • 21 variables – Financial ratios – Other indicators: corporate governance, motivationn etc. Matched-pairs design 92 firms subject to enforcement actions by the SEC
• To attract external financing at low cost was found an
important motivation for earnings manipulation • Firms manipulating earnings
are more likely to have: - insiders dominated boards, - Chief Executive Officer
simultaneously serves as Chairman of the Board. (Persons 1995) Stepwise logistic model • 9 financial ratios • Z-score Matched- pairs design
The study found four significant indicators: financial leverage, capital turnover, asset composition and firm size (Fanning and Cogger 1998) Self-organizing artificial neural network • 62 variables • Financial ratios • Other indicators: corporate governance, capital structure etc. Matched- pairs design: 102 fraud samples and 102 non-fraud samples
• Neural network is more effective
• Financial ratios such as debt to equity, ratios of accounts receivable to sales, trend variables etc are significant indicators.
(Bell and Carcello 2000)
Logistic regression 46 fraud risk factors
77 fraud samples and 305 non-fraud samples
Logistic regression model outperformed auditors for fraud samples, but were equally performed for non-fraud samples. (Kirkos et al. 2007) • Decision tree • Back-propagatio n neural network • Bayesian belief network • 27 financial ratios • Z-score Matched- pairs design: 38 fraud samples and 38 non-fraud samples
• Training dataset: neural network is the most accurate • Validation dataset: Bayesian
belief network is the most accurate
(Hoogs et al. 2007)
Genetic Algorithm • 38 financial ratios • 9 qualitative indicators 51 fraud samples vs. 51 non-fraud samples
Integrated pattern had a wider coverage for suspected fraud companies while it remained lower false classification rate for non-fraud ones
Table 3: Variable definition and measurement
Variable Definition Literature Measurement Dependent variable:
FRAUD (Persons 1995)
If a company’s financial statements for specific years are confirmed to be fraudulent by the indictments and sentences for major securities crimes issued by the Department of Justice, the firm-year data are classified into fraud observations, and the variable FRAUD will be set to 1, 0 otherwise.
Independent variable Profitability
Gross profit margin
(GPM) (Dechow et al. 2007) Sales
costs Operating -Sales Operating profit ratio (OPR)
(Green and Choi 1997)
les expenses Operating costs-Operating les-Sa Sa Return on assets (ROA) (Hoogs et al. 2007;
Persons 1995) Average totalassets
rate) Tax -(1 expenses Interest income Net Growth in sales (GS) (Dechow et al. 2007; Stice 1991; Summers and Sweeney 1998) 1 ) ( year fiscal prior in Sales Sales Growth in net income (GNI) (Dechow et al. 2007; Stice 1991; Summers and Sweeney 1998) 1 ) ( year fiscal prior in income Net income Net Liquidity Current ratio
(CR) (Kirkos et al. 2007) Currentliabilities
assets Current
Quick ratio
(QR) (Kirkos et al. 2007) Currentliabilities
expenses Prepaid -s Inventorie -assets Current Operating ability Accounts receivable turnover (ART)
(Green and Choi 1997)
receivable accounts Average Sales Total asset turnover (TAT) (Kirkos et al. 2007;
Persons 1995) Totalassets
Growth in accounts receivable (GAR) (Dechow et al. 2007) )-1 year fiscal prior in receivable Accounts receivable Accounts ( Growth in inventory
(GI) (Dechow et al. 2007) Inventory in prior fiscalyear)-1
Inventory ( Growth in accounts receivable to sales (GARS) (Summers and Sweeney 1998) t-1 1 -t t t Sales receivable Accounts -Sales receivable Accounts Growth in inventory to sales (GIS) (Summers and Sweeney 1998) t-1 1 -t t t Sales Inventory -Sales Inventory Accounts receivable to total assets (ARTTA)
(Green and Choi 1997; Persons 1995; Stice 1991) Totalassets receivable Accounts Inventory to total assets (ITTA) (Persons 1995; Stice 1991) Totalassets Inventory Financial structure Debt ratio (DR) (Kirkos et al. 2007;
Persons 1995) Totalassets
s liabilitie Total Long-term funds to fixed assets (LFTFA) (Kirkos et al. 2007) assets Fixed s liabilitie Longterm + Equity
Cash flow ability
Cash flow ratio
(CFR) (Dechow et al. 2007) Current liabilities
activities operating from flows Cash Cash flow adequacy ratio (CFAR) (Dechow et al. 2007) dividends) cash and additions inventory es, expenditur capital of sum year (Five activities operating from flows cash of sum year Five Cash flow reinvestment ratio (CFRR) (Dechow et al. 2007) capital) Working + assets Other + s investment term Long + assets fixed (Gross dividends Cash -activities operating from flows Cash Financial difficulty
Z-score
(Altman 1968; Fanning and Cogger 1998; Stice 1991; Summers and Sweeney 1998) ) 1.0 TAT debt total of Book value equity of ue Market val ( 6 . 0 ) assets Total taxes and interest before Earnings ( 3 . 3 ) assets Total earnings Retained ( 4 . 1 ) assets Total capital Working ( 2 . 1 Corporate Governance
Stock Pledge ratio
(SPR)# (Lee and Yeh 2004) largeshareholders'shareholdings pledge in ngs shareholdi rs' shareholde large Sum of percentage of major shareholders’ shareholdings (SMLSR)
(Beasley et al. 1999) Σ (Percentage of shareholdings >10%)
Deviation
between VR and CFR
(DBVRCFR)
(La Porta et al. 1999; Lee
and Yeh 2004) Voting rights (VR) - Cash flow rights (CFR) Deviation
between CBS and CFR
(DBCBSCFR)
(Lee and Yeh 2004; Yeh et al. 2001)
Percentage of board seats controlled (CBS) - Cash flow rights (CFR)
#
: According to the rule issued from the Securities and Futures Commission (SFC) of Taiwan,
directors, supervisors, managers and large shareholders (that own 10 per cent or more of a
company’s outstanding shares) in public companies are obliged to report to the SFC the percentage
of their shareholdings that are pledged for loans and credits. These data matter, since pledging for
loans effectively reduces the personal funds required for shareholding. In other words, the degree of
personal leverage expands and the over-investments in the stock market by the largest shareholder
also create risk for the companies to a certain degree. (Lee and Yeh 2004)
Table 4: Descriptive Statistics of variables
Fraud Sample (N=113) Non-fraud Sample (N=467)
Variable Mean Median
25 Percentiles 75 Percentiles Mean Median 25 Percentiles 75 Percentiles Z GPM 11.85 10.65 4.99 19.41 15.51 14.47 8.12 22.77 -3.19 OPR -5.39 0.32 -7.26 6.92 -34.49 3.81 -0.24 8.60 -3.98 ROA -13.45 -2.76 -23.48 5.29 3.40 4.19 0.39 7.97 -6.53 GS 8.30 7.84 -15.47 24.99 38.73 5.23 -7.77 19.89 -0.08 GNI 47.23 -71.97 -636.91 24.49 -41.32 14.30 -44.89 80.07 -6.74 CR 109.83 104.68 60.98 141.48 190.94 150.01 110.02 210.00 -7.00 QR 57.79 45.54 21.84 77.09 110.36 75.73 38.09 124.66 -5.16 ART 7.10 4.62 3.16 7.34 8.91 5.36 3.75 8.94 -2.51 TAT 0.61 0.48 0.31 0.74 0.75 0.64 0.41 0.93 -3.69 GAR 39.67 -5.73 -37.06 34.73 68.97 6.03 -15.15 33.86 -2.42 GI 13.85 -1.02 -28.82 23.66 27.03 2.18 -14.80 31.14 -1.67 GARS -0.17 -1.04 -7.95 3.30 2.13 0.22 -2.75 3.11 -2.46 GIS 24.91 -0.34 -5.40 3.43 23.96 0.00 -3.37 4.80 -1.11 ARTTA 12.02 10.11 4.79 18.37 13.70 10.84 5.05 20.33 -1.33 ITTA 16.72 11.36 5.96 19.49 19.94 13.57 5.82 24.67 -1.74 DR 64.02 60.23 48.10 71.40 48.17 45.03 33.67 56.75 -7.59 LFTFA 452.26 165.79 95.29 399.96 482.48 225.20 146.73 427.05 -3.48 CFR -14.91 -6.88 -21.21 6.54 13.41 8.12 -5.96 29.70 -6.26 CFAR -18.56 -6.54 -27.97 8.65 9.36 14.52 -17.16 54.56 -5.53 CFRR -46.73 -2.69 -14.70 3.74 0.37 2.03 -4.17 7.56 -4.59 SPR 37.44 33.44 1.83 63.26 19.32 3.58 0.00 32.49 -5.67 SMLSR 13.97 11.98 3.72 20.38 10.83 7.89 0.09 16.96 -3.16 DBVRCFR 3.47 0.47 0.00 2.76 3.62 0.56 0.00 4.09 -0.66 DBCBSCFR 46.00 45.58 22.87 67.41 44.26 43.68 26.99 63.69 -0.59 Z-Score 31.45 79.60 -91.69 166.17 198.67 194.70 120.89 270.95 -8.68
Table 5: Empirical results of discriminant analysis.
Variable Coefficient F-value
Significance
GPM
0.14
3.51
0.061
OPR
-0.03
0.16
0.688
ROA
0.77 105.82
0.000***
GS
0.06
0.63
0.427
GNI
-0.02
0.05
0.822
CR
0.34 20.59
0.000***
QR
0.28 13.42
0.000***
ART
0.09
1.58
0.210
TAT
0.19
6.38
0.012
GAR
0.03
0.12
0.731
GI
0.07
0.90
0.344
GARS
0.00
0.00
0.997
ARTTA
0.11
2.25
0.134
ITTA
0.12
2.37
0.125
DR
-0.42 30.46
0.000***
LFTFA
0.02
0.09
0.764
CFR
0.33 19.21
0.000***
CFAR
0.24 9.89
0.002***
CFRR
0.19
6.41
0.012
SPR
-0.47 38.85
0.000***
SMLSR
-0.19
6.18
0.013
DBVRCFR
0.02
0.04
0.835
DBCBSCFR
-0.05
0.41
0.524
Z-score
0.64 72.74
0.000***
Wilks' Λ value
0.77
p-value
0.000
Table 6: Common fraudulent techniques adopted by fraud firms of leaf nodes of #11, #14-21, and #14-24. The
code and year in the first two columns lists the company code and the year of each clustered financial statement. In each node, the numbers within the parenthesis indicate the number of fraudulent financial statements and the number of (fraud) firms.
Code year FT1 FT2 FT3 FT4 FT5 FT6 FT7 FT8 FT9 FT10 leaf node #11 (12/9) 2505 1998 ● 2529 1998 ● ● 8716 1999 ● ● 2334 1999 ● ● 3039 2004 ● 1601 1998 ● 1221 2002 ● ● ● 1221 2003 ● ● ● 2014 2003 ● ● 5901 1997 ● ● 5901 1998 ● ● 5901 1999 ● ● leaf node #14-24 (12/9) 2206 1999 ● 2350 1998 ● 2407 2002 ● ● ● ● ● ● 2407 2003 ● ● ● ● ● ● 2407 2004 ● ● ● ● ● ● 2490 2000 ● ● 2490 2002 ● ● 8295 1998 ● ● 1221 2001 ● ● 8723 1998 ● ● ● 2017 1997 ● ● 5007 1999 ● ● leaf node #14-21 (7/7/) 5504 1999 ● 2328 1998 ● ● 2334 1998 ● ● 1505 1997 ● 5007 1998 ● ● 2614 1999 ● ● ● ● 1466 1998 ● ●
FT1: recording fictitious revenues; FT2: recording revenues prematurely; FT3: no description/overstated about revenues; FT4: overstating existing assets;
FT5: recording fictitious assets or assets not owned; FT6: capitalizing items that should be expensed; FT7: understatement of expenses/liabilities; FT8: misappropriation of assets;
Figure 2: Horizontal growth of individual SOM. The notation e indicates the error node and d the dissimilar
Figure 3: The sample distribution in the obtained GHSOM, in which leaf nodes are marked in taint. In each
node, the numbers within the parenthesis indicate the number of fraudulent financial statements and the number of (fraud) firms.
#11 (12/9) #12 (28/18) #13 (25/18) #14 (48/15) Layer 1 Layer 2 #12-21 (3/3) #12-23 (13/9) #12-22 (11/7) #12-24 (1/1) #13-21 (6/5) #13-23 (4/4) #13-22 (9/7) #13-24 (6/3) #14-21 (7/7) #14-23 (21/12) #14-22 (8/8) #14-24 (12/9) #01 (113/58)
國科會補助專題研究計畫成果報告自評表
請就研究內容與原計畫相符程度、達成預期目標情況、研究成果之學術或應用價
值(簡要敘述成果所代表之意義、價值、影響或進一步發展之可能性)
、是否適
合在學術期刊發表或申請專利、主要發現或其他有關價值等,作一綜合評估。
1. 請就研究內容與原計畫相符程度、達成預期目標情況作一綜合評估
■
達成目標
□ 未達成目標(請說明,以
100 字為限)
□ 實驗失敗
□ 因故實驗中斷
□ 其他原因
說明:
2. 研究成果在學術期刊發表或申請專利等情形:
論文:□已發表 □未發表之文稿 ■撰寫中 □無
專利:□已獲得 □申請中 □無
技轉:□已技轉 □洽談中 □無
其他:(以
100 字為限)
已將研究成果陸續在
American Accounting Association Annual Conference
2010 以及 American Accounting Association Annual Conference 2011 發表,並
已陸續撰寫成數篇論文投稿到國際期刊,應該會有至少兩篇的
SCI/SSCI 國際期
3. 請依學術成就、技術創新、社會影響等方面,評估研究成果之學術或應用價
值(簡要敘述成果所代表之意義、價值、影響或進一步發展之可能性)(以
500 字為限)
1. 研究所得之結果及研究過程,可供國內學術及研究單位易參考之用。
2. 參與本研究之人員,可獲取下述之研習效果﹕
(1) 參與相關蒐集、理論探討、程式撰寫及報告完成,有助於其日後獨立從
事研究工作。
(2) 藉由參與計畫,引發研究人員對於 GHSOM 和財報舞弊有更深的瞭解,有
助於未來之研究發展。
例如,
計畫參與人員黃馨瑩乃為博士班學生
,
其博士論文乃基於此研究
案之成果
,
而其研究成果
已陸續撰寫成數篇論文投稿到國際期刊,應該會有
至少兩篇的
SCI/SSCI 國際期刊論文發表。
出席國際學術會議心得報告
計畫編號 NSC98-2410-H-004-049-MY2 計畫名稱 財務報表舞弊探索與類神經網路 出國人員姓名 服務機關及職稱 林宛瑩 國立政治大學會計學系 副教授 會議時間地點 2010/7/31-2010/8/4IN SAN FRANCISCO, CA, USA
會議名稱 2010 AMERICAN ACCOUNTING ASSOCIATION ANNUAL MEETING
AND CONFERENCE ON TEACHING AND LEARNING IN ACCOUNTING
發表論文題目 A Neural Networks Tool to Enhance the Understanding of Fraudulent Financial Reporting
一、參加會議經過
我於01/08/2010 晚上到達 San Francisco,於 02/08/2010-04/08/2010 會議期間至會
場聆聽Opening Plenary Session 及每日之 Plenary Session 與當日多篇論文之發表,包
括Determinants of disclosure quality、Information technology impacts on operational
performance、New approaches to accounting research、COSO Panel、Internal auditing、 Internal control、Conservatism、Fraud detection、Fraud case studies 等場次之討論與多
篇論文發表;並於03/08/2010 下午 4:00 的 Concurrent Sessions 發表論文。於 05/08/2010 凌晨離開 San Francisco 回國。本人所發表之論文參見後附之附件。 二、與會心得 Plenary Session 邀請了不少會計學各領域之知名學者參與座談及演講,各場次論 文發表亦使本人受益良多。本人所發表之論文,蒙與會學者提供多項建議,修正後論 文目前已在IMDS 期刊進行審查。
2
A Neural Networks Tool to Enhance the
Understanding of Fraudulent Financial
Reporting
Abstract
Fraudulent financial reporting (FFR) has drawn much public as well as academic attention. However, most literature focuses on predicting the likelihood of financial fraud, financial distress or bankruptcy. Less emphasis has been placed on exploring FFR itself, and FFR techniques and knowledge. The purpose of this research is to explore FFR via Growing Hierarchical Self-Organizing Map (GHSOM), an unsupervised Neural Network tool, to enhance the understanding of FFR. This study addresses the challenge through the following two-stage approach: a classification stage that well trains the GHSOM to cluster the sample into subgroups with hierarchical relationship and a pattern-disclosure stage that uncovers patterns of the common financial reporting fraud techniques and relevant risk indicators to enhance the understanding of FFR. An application is conducted and its results show that the proposed two-stage approach is helpful in enhancing the understanding of FFR.
Key words: Fraudulent Financial Report; Growing Hierarchical Self-Organizing Map; Knowledge Extraction
1. Introduction
This study focuses on exploring financial reporting fraud via Growing Hierarchical Self-Organizing Map (GHSOM), an unsupervised Neural Network tool (Dittenbach et al. 2000; Dittenbach et al. 2002; Rauber et al. 2002), to enhance the understanding of Fraudulent Financial Reporting (FFR). FFR, or financial statement fraud, involves the intentional misstatement or omission of material information from an organization’s financial reports (Beasley et al. 1999). These are cases known as “cooking the books” that often have severe economic consequences and make front page headlines. FFR can lead not only to significant risks for stockholders and creditors, but also financial crises for the capital market. FFR, although with the lowest frequency, casts a severe financial impact (Association of Certified Fraud Examiners, ACFE 2008). According to the ACFE (2008), financial misstatements are the most costly form of occupational fraud, with median losses of $2 million per scheme.
Most prior FFR-related research focused on the nature or the prediction of FFR. The nature-related FFR research often uses the case study approach and provides a descriptive analysis of the characteristics of FFR and techniques commonly used. For example, the Committee of Sponsoring Organizations (COSO) and the Association of Certified Fraud Examiners (ACFE) regularly publish their own analysis on fraudulent financial reporting of U.S. companies. Based on the FFR samples, COSO examines and summarizes certain key company and management characteristics. ACFE analyzes the nature of occupational fraud schemes and provides suggestions to create adequate internal control mechanisms. Table 1 summarizes the research methodology and findings in nature-related FFR studies.
Table 1: Research methodology and findings in nature-related FFR studies.
Research Methodology Findings
Beasley et al. (1999)
•Case study
•Descriptive statistics
•Nature of companies involved
– Companies committing financial statement fraud were
relatively small.
– Companies committing the fraud were inclined to experience
net losses or close to break-even positions in periods before the fraud.
•Nature of the control environment
– Top senior executives were frequently involved.
– Most audit committees only met about once a year or the
company had no audit committee. •Nature of the frauds
– Cumulative amounts of fraud were relatively large in light of the relatively small sizes of the companies involved.
– Most frauds were not isolated to a single fiscal period.
– Typical financial statement fraud techniques involved the
4
•Consequences for the company and individuals involved
– Severe consequences awaited companies committing fraud.
– Consequences associated with financial statement fraud were
severe for individuals allegedly involved. ACFE
(2008)
•Case study
•Descriptive statistics
• Occupational fraud schemes tend to be extremely costly. The
median loss was $175,000. More than one-quarter of the frauds involved losses of at least $1 million.
• Occupational fraud schemes frequently continue for years, two
years in typical, before they are detected.
• There are 11 distinct categories of occupational fraud. Financial statement fraud was the most costly category with a median loss of $2 million for the cases examined.
• The industries most commonly victimized by fraud in our study
were banking and financial services (15% of cases), government (12%) and healthcare (8%).
• Fraud perpetrators often display behavioral traits that serve as indicators of possible illegal behavior. In financial statement fraud cases, which tend to be the most costly, excessive organizational pressure to perform was a particularly strong warning sign.
Another type of FFR research often uses the empirical approach to archival data and identifies significant variables that help predict the occurrence of fraudulent reporting. This line of research also inputs these significant variables into the fraud prediction model. Such research emphasizes the predictability of the model used. For example, logistic regression and neural network techniques are used in this line of research (e.g., Persons 1995; Fanning and Cogger 1998; Bell et al. 2000; Virdhagriswaran 2006; Kirkos et al. 2007). The matched-sample design is typical for traditional FFR empirical studies. That is, a set of samples with fraudulent financial statements confirmed by the Department of Justice is matched with a set of samples without any allegations of fraudulent reporting.
Table 2 summarizes the research methodology and findings of FFR empirical studies most relevant to our study. The research methodology has shown a trend with an emphasis on the classification mechanization which is used as the decision support information for future risk identification (Basens et al. 2003). However, engagements relating to criminal matters typically arise in the aftermath of FFR and an assessment to criminal engagements requires the accumulation of FFR knowledge.
Table 2: Research methodology and findings in FFR empirical studies.
Author Methodology Variable Sample Findings
Dechow et al. (1996)
Logistic regression • 21 variables
– Financial
ratios
Matched-pairs design
92 firms subject
• To attract external financing at low cost was found an important motivation for earnings
– Other indicators: corporate governance, motivationn etc. to enforcement actions by the SEC manipulation
• Firms manipulating earnings are
more likely to have: - insiders dominated boards, - Chief Executive Officer
simultaneously serves as Chairman of the Board. Persons (1995) Stepwise logistic model • 9 financial ratios • Z-score Matched- pairs design
The study found four significant indicators: financial leverage, capital turnover, asset composition and firm size Fanning and Cogger (1998) Self-organizing artificial neural network • 62 variables • Financial ratios • Other indicators: corporate governance, capital structure etc. Matched- pairs design: 102 fraud samples and 102 non-fraud samples
• Neural network is more effective
• Financial ratios such as debt to equity, ratios of accounts
receivable to sales, trend variables etc are significant indicators. Bell and
Carcello (2000)
Logistic regression 46 fraud risk factors
77 fraud samples and 305 non-fraud samples
Logistic regression model outperformed auditors for fraud samples, but were equally performed for non-fraud samples. Kirkos et al. (2007) • Decision tree • Back-propagation neural network • Bayesian belief network • 27 financial ratios • Z-score Matched- pairs design: 38 fraud samples and 38 non-fraud samples
• Training dataset: neural network is the most accurate
• Validation dataset: Bayesian belief network is the most accurate
Hoogs et al. (2007)
Genetic Algorithm • 38 financial ratios • 9 qualitative indicators 51 fraud samples vs. 51 non-fraud samples
Integrated pattern had a wider coverage for suspected fraud companies while it remained lower false classification rate for non-fraud ones
This study explores the financial reporting fraud techniques via applying GHSOM to a research sample of 580 observations between the years of 1992 to 2006. A brief review of GHSOM literature is as follows. GHSOM addresses the issue of fixed network architecture of Self-Organizing Map (SOM) (Kohonen 1982) through developing the multilayer hierarchical network structure, in which, as shown in Figure 1, each layer contains a number of SOMs. The training process of GHSOM consists of the following four phases (Dittenbach et al. 2000):
6
Figure 1: GHSOM structure. (Dittenbach et al. 2000)
(1) Initialize the layer 0: The layer 0 includes single node (mapping) whose weight vector is initialized as the expected value of all input data. Then the mean quantization error of layer 0 (MQE0) is
calculated. Hereafter, MQE of a mapping denotes the mean quantization error that sums up the deviation between the weight vector of the node and every input data mapped to the node.
(2) Train every individual SOM: Within the training process of an individual SOM, the input data is imported one by one. The distances between the imported input data and the weight vector and all mapping are calculated. The mapping with the shortest distance is selected as the winner. Under the competitive learning principle, only the winner and its neighboring mappings are qualified to adjust their weight vectors. Repeat the competition and the training until the learning rate decreases to a certain value.
(3) Grow horizontally each individual SOM: Each individual SOM will grow until the mean value of the MQEs for all of the mappings on the SOM (MQEm) is smaller than the MQE of the parent
mapping (MQEp) multiplied by τ1. That is, the criterion for the stoppage of growth is stated in (1). If
the stopping criterion is not satisfied, find the error mapping that owns the largest MQE and then, as shown in Figure 2, insert one row or one column of new nodes between the error mapping and its dissimilar neighbor.
MQEm < τ1 × MQEp (1)
Figure 2: Horizontal growth of individual SOM. The notation e indicates the error mapping and d
(4) Expand or terminate the hierarchical structure: After the horizontal growth phase of individual SOM, MQE of every mapping (MQEi) is compared with the value of MQE0 multiplied by τ2. The mapping
with an MQEi greater than τ2 × MQE0 will develop a next layer of SOM. In this way, the hierarchy
grows until all of the leaf mappings satisfy the stopping criterion stated in (2). The leaf mapping means the mapping does not own a next layer of SOM.
MQEi < τ2 × MQE0 (2)
For this study a two-stage approach was developed as depicted in Figure 3. In the classification stage, the discriminant analysis is first applied to the research sample to identify the significant variables that help predict the occurrence of FFR. These significant variables are then used in training the GHSOM to obtain leaf mappings that may consist of data from fraud and non-fraud samples. The main purpose is to build up a well-trained GHSOM. With the unsupervised learning nature, the GHSOM treats samples equally without specifying the occurrence of sentence or manipulation, a scenario close to the real world. Due to a competitive learning nature the GHSOM works as a regularity detector that is supposed to discover statistically salient features of the sample population (Rumelhart and Zipser 1985). That is, there are no predefined categories into which samples are to be classified; rather, the GHSOM system must develop its own feature representation of the sample which captures the most salient features of the population of sample. Furthermore, through a set of small-sized mappings, the GHSOM classifies the sample into more subgroups using hierarchical relationships instead of a dichotomous result and therefore further and more delicate analyses are feasible.
Figure 3: The two-stage approach for exploring the financial reporting fraud techniques via GHSOM.
The FFR tendency, also denoted as the degree of risk, can be recognized from each mapping. There are three risk categories for leaf mappings based on the identified degree of risk — high-risk, mixed, and healthy. High-risk mapping contains many fraudulent financial statements and healthy mapping more non-fraudulent financial statements.
In the pattern-disclosure stage, unlike the traditional approaches that interpret the outcome of a model via its input variables, this study uncovers the (common) FFR patterns from the fraud samples clustered in
8
each leaf mapping without referring to the attributes of input variables. The associated FFR knowledge can be applied to all samples clustered in the same leaf mapping.
The two-stage approach used by this study is to further understand corporate behavior through integrating the outcome of the GHSOM model with the output features associated with FFR indictments and/or domain expertise. Our proposed approach focuses on uncovering the common patterns from each mapping without referring to the attributes of input variables resulting from the first stage analysis.
For instance, the patterns of each high-risk mapping that we are interested in are the common fraudulent techniques used by the fraud samples. Therefore, for a high-risk leaf mapping, we extract the regularity of fraudulent techniques from the corresponding indictments and sentences issued by the Department of Justice to the fraud sample. To refer to fraudulent techniques that are generally accepted, here the ten fraudulent techniques from (Beasley et al. 1999) are used. That is, there are three basic types of fraudulent techniques: Improper Revenue Recognition, Overstatement of Assets, and Others. Improper Revenue Recognition includes recording fictitious revenues (FT1), recording revenues prematurely (FT2), and no description/overstated revenues (FT3). Overstatement of Assets includes overstating existing assets (FT4), recording fictitious assets or assets not owned (FT5), and capitalizing items that should be expensed (FT6). Others includes understatement of expenses/liabilities (FT7), misappropriation of assets (FT8), inappropriate disclosure (FT9), and other miscellaneous techniques (FT10).
Based upon the observed regularity of corporate behavior in each leaf mapping, we can further identify the relevant indicators of such regularity for future reporting. For instance, built on the common fraudulent techniques observed in a high-risk mapping, we could identify the relevant financial indicators as the signal which reveals the potential fraudulent activities for any samples clustered into this high-risk leaf mapping by GHSOM. The relevant indicators help accumulate the FFR knowledge, and also help in exploring the financial reporting fraud techniques for future samples.
Our primary research findings include the followings. The results of the classification stage led to a GHSOM with three layers and 41 leaf mappings, each of which preserved its own salient features. The outcomes of the pattern-disclosure stage resulted in certain FFR techniques used by firms in each of the high FFR tendency subgroups as well as the relevant risk indicators that can be used as the FFR audit guideline. As a result, the systematic and integrated approach of this study is capable of constructing evidence to better understand the FFR.
The findings of this research help identify the link between the usages of FFR techniques and FFR drivers (including financial conditions). The FFR knowledge derived from our research methodology can help investors make their investment decisions and can help auditors do their audit planning and make audit judgments. Such knowledge can help someone who wants to play a more proactive risk reduction role by designing and performing extended procedures as a part of the statutory audit, acting as advisers to audit committees, fraud deterrence engagements, and assisting in investment analyst research. In addition, with the unsupervised learning method feature of GHSOM, our methodology is applicable to