國
立 交 通 大 學
電機與控制工程學系
博 士 論 文
以頻帶及小波分析為基礎的強健性
語音偵測系統之研究
A Study of Frequency Band and Wavelet Analysis for
Robust Voice Activity Detection
研 究 生:王坤卿
指導教授:吳炳飛 博士
以頻帶及小波分析為基礎的強健性
語音偵測系統之研究
學生:王坤卿 指導教授:吳炳飛 博士
國立交通大學電機與控制工程學系
摘要
本論文主要是針對語音偵測系統(voice activity detection)在弱的訊號與噪音比 值(the signal-to-noise ratio, SNR)及劇烈性的噪音程度變動下之所面臨的問題作些 探討。迄今,所提出的語音偵測系統都是假定環境噪音程度是穩定的(stationary)。 然而,由於傳統演算法的特徵參數都取決於能量的估測,因此其效能易受到實際 噪音程度的變動所影響。比如在車上,劇烈的噪音變動就可能因為移動、引檠運 轉、車速、煞車及關車門聲而經常地產生。為了要解決這個問題,我們先後提出 兩種具強健性(robust)特徵參數為基礎的語音偵測系統。在第一種方法中,根據 共鳴頻率(formant frequency)造成在聲音光譜圖(voice spectrogram)的帶狀性紋路 (banded line)現象,我們可發現此帶狀性紋路可有效及簡單地表示出具時變特性 (time-varying property)語音的存在。透過頻帶分析,我們提出一個以熵為基礎的 語音偵測系統。首先,將訊號切成三十二個均勻大小的子頻帶以區隔出共振音頻
的分佈。論文中提出一個定義在子頻帶上的帶狀性頻譜熵值(banded spectrum entropy, BSE) 以充分地利用帶狀性紋路在聲音光譜圖上的固有特性。由於所切
出的子頻帶可能被噪音干擾,為了增加 BSE 參數對噪音的抗雜訊能力,我們利
用可適性臨界方式(adaptive threshold method)的技巧,建立一個稱作子頻帶自我 擷取(subband self-extraction)的方法以能立即地擷取有效的子頻帶。但事實上,聲 音光譜圖上帶狀性紋路現像只適合用來特徵有聲的語音訊號。為了要強化語音訊 號的無聲部份,其低頻能量對全頻帶能量的比值(the ratio of low-band to full-band energy, RLF)可用來區隔無聲語音與背景噪音特性的差別。相較於其它方法,實 驗結果可發現用以建立具強健性的語音偵測系統的BSE 及 RLF 特徵參數可成功 地特徵語音特性且不易受噪音程度變動。事實上,語音偵測技術使也在噪音估測 器中扮演非常重要的角色;一般都採用語音偵測系統的技術作為判斷何時追蹤噪 音頻譜變動的指示器。為了針對噪音程度極遽變動情況下,所提出的噪音估測器 加入以熵為基礎的語音偵測技術並以疊代平均的方法及可調適的平滑因子為基 礎。 而在另一種語音偵測系統,我們利用語音的暫態及非穩定性的特性最為擷取語 音訊號的依據,採以小波作為訊號的分析。首先,離散小波轉換將輸入訊號分成 四個不均勻大小的子頻帶,而在每個子頻帶上採用一種非線性(non-linear)的 Teager 能量運算(Teager Energy Operator, TEO)以有效抑制噪音在各子頻帶的影 響,而另一優點就是有助於子頻帶自我相關函示(spectral auto-correlation function,
SACF)之結果。為了量化個子頻帶上的自我相關函示採用 Mean-Delta(MD)運算 以估測各頻帶的週期強度,最後並相加各子頻帶的MDSACF 參數以建立一個以 小波為基礎的強健性特徵參數。為了建立完整的語音偵測系統,我們採用一個可 適性臨界方式作為判斷語音偵測結果的機制。相較於其他方法,實驗結果證實了 以小波為基礎的語音偵測方法可提供在可變噪音程度下的強健性且具高效率及 易實現的方法。
A STUDY OF FREQUENCY BAND AND
WAVELET ANALYSIS FOR ROBUST VOICE
ACTIVITY DETECTION
Student: Kun-Ching Wang Advisor: Dr. Bing-Fei Wu
Department of Electrical and Control Engineering
National Chiao Tung University
ABSTRACT
This dissertation mainly addresses the problem of a voice activity detection (VAD) failed in poor signal-to-noise ratio (SNR) and in dynamically time-varying background. So far, the commonly used VAD algorithms always assume that the background noise level is stationary. Since the feature extractions from conventional algorithms are closely depended on the estimation of energy level, the corresponding performances are easily contaminated by the variable noise-level. For example, may usually exit in car due to movements, engine running, speed change, braking, slam, etc. To solve the problem, the VAD algorithms based on two types of robust feature parameters are proposed in turn. In the first presented approach, it is found that the
nature of banded line is highly efficient, compact representation for the time-varying characteristics of speech signals according to the appearance of banded line on voice spectrogram resulted from formant frequency. For frequency band analysis, an entropy-based VAD is presented herein. First, the input signal is decomposed into 32 uniform subbands to locate the formant frequency bands. A measure of entropy defined in subband domain, regarded as banded spectrum entropy (BSE) parameter, is then proposed to sufficiently exploit the inherent nature of banded lines on voice spectrogram. Due to that the some decomposed subbands can be contaminated by noise, a strategy of subband self-extraction (SSE) based on adaptive threshold skill is presented herein to execute the extraction of useful subbands with time and is further used to let the BSE be robust against to noises. The banded lines on voice spectrogram, in practice, are only suitable for characterizing voiced speech. In order to enhance the part of unvoiced speech, the ratio of low-band energy to full-band
energy (RLF) is presented to discriminating the unvoiced sound from background
noises. Compare to other VAD approaches, experimental results shown that the two BSE and RLF parameters used for determining voice activity successfully exploit the characteristic of speech signal and is nearly robust against variable noise level. A technology of VAD, in practice, plays an essential role in noise spectrum estimator. The VAD scheme is frequently employed into noise spectrum estimator as an
indicator of updating noise spectrum. Enclosed herein the proposed noise spectrum estimation employs an entropy-based VAD above mentioned as an indicator of updating noise spectrum. In addition, a recursive averaging-based formula and an adaptive smoothing factor are then involved herein for quickly adapting to variable level of noise.
In the alternative VAD method, wavelet analysis is used for extracting speech signals to further exploit the transient components and non-stationary property. First, we divide the input signal into four non-uniform subbands via discrete wavelet transform (DWT). In addition, a nonlinear Teager energy operator (TEO) is then utilized into each subband signals. We show that the TEO can decrease the influence of noise on subbands significantly. Besides, the other advantage is suitable for the result of subband auto-correlation function (SACF). To obtain the amount of periodicity, a Mean-Delta (MD) operator is then applied into SACF on each subband. Summing up the all MDSACFs derived from each decomposed subband, a robust wavelet-based feature parameter is then proposed. Finally, we adopt an adaptive threshold method as VAD decision to form a complete VAD. The simulation result shows the wavelet-based VAD is robust against changing noise level and is an efficient and simple approach as comparing with other methods.
ACKNOWLEDGEMENT
回顧博士班研究的過程,在這漫長的的求學中,曾經歷過很多挫折的經驗,更 曾經有過放棄追求博士學位的念頭。幸有指導教授 吳炳飛老師的體諒及支持, 讓學生得以順利完成學位。除了教授的嚴謹教學態度,他對於學生的幫助更是義 不容辭。而教授的求學生涯、成長經歷以及奮鬥過程,更是學生一面鏡子,值得 終身學習。 首先感謝口試委員 王小川教授、王逸如教授、吳俊德教授、張森嘉博士以及 陸儀斌教授,給予學生論文相當寶貴的意見。 特別謝謝彭昭暐 學長,謝謝你在我低潮的時候給予我忠懇的建議及鼓勵,並 感謝CSSP實驗室的所有學長及學弟妹們。 我的內人 陳昱卉女士,謝謝妳辛苦地陪我走過14年求學的生涯,更感謝為我 生個可愛又好動的兒子 王翊丞及乖巧的女兒 王芊涵。在這段時間,讓我回味好 久不曾的家的溫馨。 母親 張秀吻女士,在我的心目中,您一直無怨無悔地的付出。因為有您的付 出,使我可以專注於學業上。 感謝岳父 陳國華先生、岳母 黃月華女士,因為 有您們分擔照顧小孩子,減低我與內人不少的辛勞!! 願將這份榮耀與您們一起分享!! 最後,也獻給已往生將近一年的父親 王文豐先生,希望父親在天有知,與兒 子分享這份喜悅!! 坤卿 於交通大學電機與控制系CSSP實驗室 2005/10/6CONENTS
ABSTRACT (Chinese)………i ABSTRACT (English)...……….iii ACKNOWLEDGEMENT...………v TABLE OF CONTENTS.……….………..vi LIST OF TABLES.………...……….………..ix LIST OF FIGURES.………...…….………xii 1 INTRODUCTION………1 1.1 Motivation………...11.2 The Classification of Speech Signal………..2
1.3 The Categories of Background Acoustical Noises……….3
1.4 Prior Art……….5
1.5 Objectives………..8
1.5.1 Frequency Band Analysis for Voice Activity Detection Using A Measure of Banded Spectral Entropy………8
1.5.2 Recursive Noise Estimation with A VAD for Highly Non-stationary Environments………9
1.5.3 Voice Activity Detection Based on Wavelet Analysis Using a Measure
of Auto-Correlation Function and Teager Energy Operator………….10
1.6 Organization of This Dissertation………12
2 FREQUENCY BAND ANALYSIS FOR VOICE ACTIVITY DETECTION USING A MEASURE OF BANDED SPECTRAL ENTROPY………...13
2.1 Introduction………..14
2.2 The Robust Feature Parameter……….18
2.2.1 Motivation………...18
2.2.2 A Measure of Conventional Spectral Entropy (SE)………20
2.2.3 A Measure of The Presented Banded Spectral Entropy (BSE)……...21
2.2.4 The Ratio of Low-band Energy to Full-band Energy (RLF)………..26
2.3 The Proposed Entropy-based VAD Algorithm……….27
2.3.1 An Adaptive Threshold Method……….29
2.3.2 The Strategy of Subband Self-Extraction (SSE)……….30
2.3.3 The Block Diagram……….32
2.4 Evaluation………34
2.4.1 Artificially Added Noise……….35
2.4.2 Recordings in a Car……….37
3 A SINGLE CHANNEL NOISE ESTIMATOR WITH RAPID ADAPTATION
IN VARIABLE-LEVEL OF NOISY ENVIRONMENTS………55
3.1 Introduction………..56
3.2 Proposed Noise Estimation Algorithm……….59
3.2.1 A modified entropy-based VAD………59
3.2.2 Update of noise spectrum during voice absent frames……….60
3.2.3 Update of noise spectrum during voice active frames………..60
3.2.3.1 Tracking the local minimum………...61
3.2.3.2 The calculation of time-frequency dependent smoothing factor………61
3.3 Experimental Results………...62
3.4 Discussion………64
4 VOICE ACTIVITY DETECTION BASED ON WAVELET ANALYSIS USING A MEASURE OF AUTO-CORRELATION FUNCTION AND TEAGER ENERGY OPERATOR……….70
4.1 Introduction……….71
4.2 Wavelet Transform………..74
4.3 Teager Energy Operator (TEO)………...76
4.5 Proposed Voice Activity Detection (VAD) Algorithm……….80
4.6 EXPERIMENTAL RESULTS……….84
4.6.1 Test Environment and Noisy Speech Database………84
4.6.2 Evaluation in Stationary Noise……….85
4.6.3 Evaluation in Non-stationary Noise………..87
4.7 Discussion & Future Work………...88
4.7.1 Comparison………...89 4.7.2 Future Work………..92 5 CONCLUSIONS………100 BIBLIOGRAPHY………...103 VITA………...111 PUBLICATION LIST………..112
LIST OF TABLES
TABLE 2-I COMPARISON BETWEEN THE PROPOSED ENTROPY-BASED
VAD AND ATF-BASED VAD [7] UNDER VARIOUS NOISE CONDITIONS ... 41 TABLE 2-II COMPARISON BETWEEN THE PROPOSED ENTROPY-BASED
VAD AND ATF-BASED VAD [7] UNDER VARIOUS NOISE CONDITIONS ... 41
TABLE 3-I SEGERR FOR FOUR NOISE TYPES AND LEVELS... 65
TABLE 4-I COMPARISON BETWEEN THE THREE VAD ALGORITHMS
TESTING IN VARIOUS NOISE CONDITIONS ... 93 TABLE 4-II SUBJECTIVE EVALUATION OF LISTENING TEST ... 93 TABLE 4-III ILLUSTRATION OF EFFICIENCY FOR THE FOUR VAD... 93 TABLE 5-I COMPARISON BETWEEN PROPOSED ENTROPY-BASED VAD
LIST OF FIGURES
Fig. 2-1 Inherent characteristic of banded lines (formant traces) only appears on voice-active spectrogram ... 42 Fig. 2-2 Illustration of the banded lines existing in various types of noises ... 43 Fig. 2-3 Nature of banded lines on voice-active spectrogram... 44 Fig. 2-4 Power distributions of all 32 uniform subbands with the same entropy
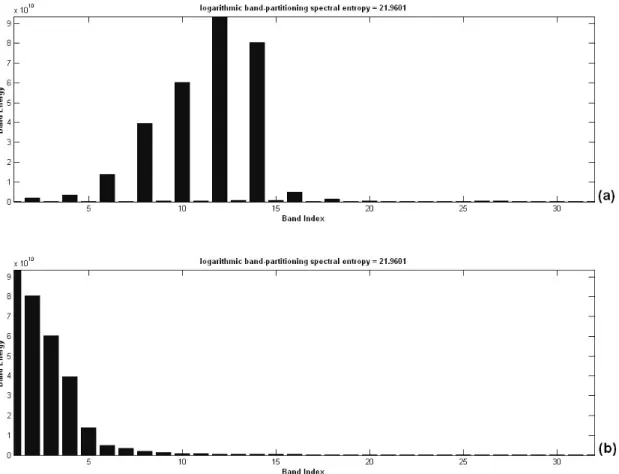
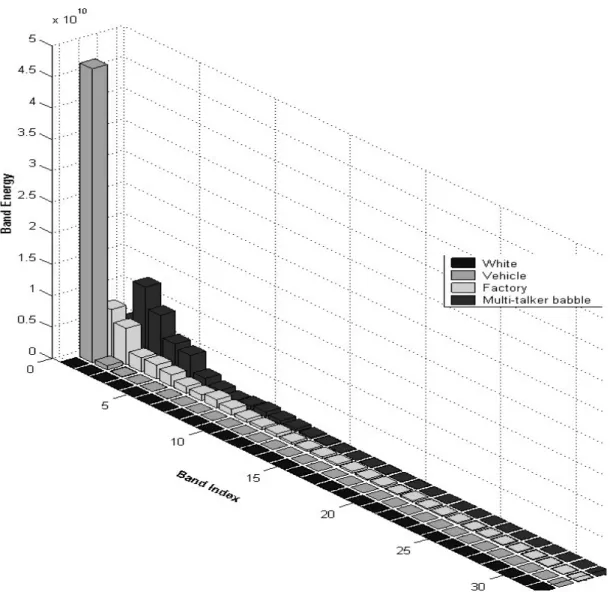
(logarithmic BSE=21.9601)... 45 Fig. 2-5 Illustration of characterizing speech signals by using entropy-based feature parameter... 46 Fig. 2-6 Different types of noises focusing on different frequency bands ... 47
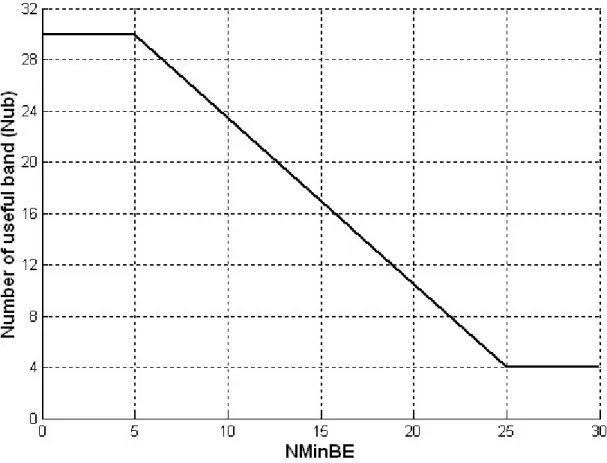
Fig. 2-7 Relation between the number of useful subbands and NMinBE parameter
... 48 Fig. 2-8 Illustration of the efficiency of NMinBE parameter for applying in BSE
parameter... 49 Fig. 2-9 An adaptive threshold method for VAD decision ... 50 Fig. 2-10 Flowchart of SSE strategy for automatically extracting the useful subbands
Fig. 2-11 Block diagram of the proposed entropy-based VAD algorithm... 51
Fig. 2-12 Result of RLF measure tested in recorded speech sentence /start/ ... 52
Fig. 2-13 Measurement of the two BSE and RLF parameters... 53
Fig. 2-14 Comparison between different feature parameters for VAD algorithm testing an utterance with musical background noise inside a car ... 54
Fig. 3-1 Flow diagram of the proposed algorithm for updating noise estimate ... 66
Fig. 3-2 Flow diagram of a modified entropy-based VAD... 67
Fig. 3-3 Sigmoid function for computing a time-frequency smoothing factor ... 68
Fig. 3-4 Tracking capability of the noise estimator tested in noisy speech with a sudden increase in the level of factory noise ... 68
Fig. 3-5 S/N ratio in each frequency subband ... 69
Fig. 4-1 Discrete wavelet transform (DWT) using filter banks... 94
Fig. 4-2 18-tap Daubechies Wavelets ... 94
Fig. 4-3 Structure of three-level wavelet decomposition... 95
Fig. 4-4 Enhancement of formant information by using TEO... 95
Fig. 4-5 Illustration of TEO applying into wavelet coefficients derived from each subband ... 96
Fig. 4-6 Examples of normalized SACF for voiced sound, unvoiced sound and white noise on each subband... 96
Fig. 4-7 Examples of the SAE parameters without band-decomposition and derived from four subbands ... 97 Fig. 4-8 Block diagram of proposed wavelet-based VAD... 97 Fig. 4-9 Adaptive thresholding strategy for extracting the boundary of voice
activity... 98 Fig. 4-10 Comparisons among VAS, MD and proposed SAE feature parameters ... 98 Fig. 4-11 Illustration of performance for Stegmann’s VAD [53] containing four
energy-based parameter and VAD decision ... 99 Fig. 4-12 Effects of a variable noise-level on proposed SAE and Chen’s VAS
CHAPTER 1
INTRODUCTION
1.1 Motivation
The purpose of voice activity detection (VAD) is the determination of the presence or absence of a voice component in a given signal, especially the determination of the beginnings and endings of voice segments, and it is also called speech detection, endpoints detection, and speech/non-speech segmentation. Such a technique is one of the essential parts for entire speech processing and required in many applications such as mobile telecommunication for discontinuous transmission (DTX) mode [1], noise reduction for speech enhancement [2], speech coding [3], [50], and speech recognition [4]. In GSM (Global System for Mobil communication cellular) system, a VAD scheme for DTX is required to determine whether a slice of speech waveform is voice or silence. After that, only the “voice” slices are transmitted by DTX to lengthen the battery life of the terminals by suppressing the overall transmitting data [5], [6].
Similarly, in speech recognition system a VAD strategy used as front-end process can improve the recognition ratio and reduce the computing power waste induced by incorrect speech detection even in the presence of noise. Besides, a good use of VAD can be used in speech coding system to control the average bit rate and the overall coding quality of speech in a variable bit rate [3].
1.2 The Classification of Speech Signal
Speech sounds can be classified into three distinct classes, voice sounds, unvoiced sounds, and silences which are resulted from their mechanism of speech production [8]. Voiced sounds are generated by forcing air through the glottis or an opening between the vocal folds. The tension of the vocal cords is adjusted so that they vibrate in oscillatory fashion. Thus, voiced sounds show periodicity. All the vowels including the semivowels and the diphthongs are voiced sounds. Unvoiced sounds are produced by forming a construction at some point in the vocal tract, and forcing air through the formed construction at a high velocity to generate turbulence. Unlike voiced sounds, unvoiced sounds do not have any prominent periodic components. Silences are the parts of the speech sequence during which no sound is produced by the human speech production mechanism. In many ordinary environments, silences in the speech sequence are dominated by the background noise which varies dynamically in energy
level and spectral characteristics.
1.3 The Categories of Background Acoustical Noises
In general, the speech signal is corrupted by additive background acoustical noises that we can divide into two categories based on the environment. The first category is background noise from an office-type environment. The office-type environment contains some, but not a lot of, background noise. Office-type background noise varies slowly both in terms of volume and statistical characteristics. The second category is dynamic background noise from outside office environment. This category can be frequently occurred and be significantly less controlled; the background noise exhibits a wide dynamic range and varies rapidly and unpredictably. Besides, impulse noise may perturb the waveform of speech signals. The above-mentioned categories are illustrated as below:
a. Office-type background noise i. also called fixed-level noise ii. short-term quasi-stationary noise
iii. strictly speaking, background noise is present throughout the entire signal, although it is mostly embedded in the voice signal
v. can be considered as low-energy, white noise
vi. is subject to a statistical characterization in two steps on the basis of its mean energy, the standard deviation of the energy, and mean zero-crossings. b. Dynamic background noise
i. also called variable-level noise or non-stationary noise ii. sporadic noise from a multitude of sources
iii. may appear at any moment in record iv. duration is very variable
v. energy is variable too, although generally lower in comparison with that of the section of speech with most energy
c. Impulse noise
i. perturbations of the waveform, primarily in the last part of the speech signal, due to exhalation
ii. noises made by the tough and/or lips in preparation for speech iii. does not always appear
iv. energy is variable: may be confused with other sporadic noises, or even speech
v. can be dealt with by using time duration
background noise. However, the so-called non-stationary noises frequently exist in recordings. So, the detection of voice activity in dynamical noise environment is a challenging task.
1.4 Prior Art
The accurate determination of speech in the presence of background noise plays a significant role in many areas of speech processing. Over the past decade numerous studies have been proposed for the developments of the robust VAD algorithms operating in adverse acoustic noisy environments. In general, for the establishment of a complete VAD algorithm it mainly comprises two parts shown as bellows:
¾ Parameter extraction: Relevant parameters are extracted from the speech signal. In order to allow a good detection of the speech signal regions, the chosen parameters have to show a discriminability between speech and non-speech segments.
¾ Thresholding: A threshold is applied to the extracted parameter in order to divide the speech signal between speech and non-speech segments. This threshold can be fixed or adaptive. In general, the adaptive threshold is used to adapt to variable noise level.
energy [10], zero-crossing rate (ZCR) [12], [13], timing, pitch information [11] and the LPC coefficients [9]. Cepstral features [14], adaptive noise modeling of voice signals [15] and the periodicity measure [16] are some of the recent ideas in VAD designs. Unfortunately, these algorithms have some problems at low signal-to-noise ratios (SNRs), especially when the noise is non-stationary. For example, the energy-based estimate and ZCR are inadequate for distinguishing speech from noise at low SNRs. The performances of energy-based VADs degrade significantly when the speech level is smaller than the noise level. Moreover, the ZCR is highly sensitive to various types of noise. Additionally, the reliability of the LPC coefficients have been observed to depend strongly on the noise in adverse environment and not particularly suitable for nasal sound, fricative, etc. Although pitch information can help to detect speech, extracting the correct pitch in noisy environments is difficult. Some of the algorithms perform well in adverse environments; even so, the algorithms
must be required more computing complexity. Various procedures for speech
detection have been described in the literature so far. Sohn et al. [17] presented a VAD algorithm that uses a novel noise spectrum adaptation applying soft decision techniques. The decision rule drew from the generalized likelihood ratio test by assuming the noise statistics to be known a prior estimate. Cho et al. [18] presented improved version of the algorithm designed by Sohn. Specifically, Cho presented a
smoothed likelihood ratio test to reduce the detection errors. Furthermore, Beritelli et
al. [19] developed a fuzzy VAD using a pattern matching block comprising a set of six
fuzzy rules. Nemer et al. [20] designed a robust algorithm based on higher order statistics (HOS) in the residual domain of the linear prediction coding coefficients (LPC). The International Telecommunication Union-Telecommunications Sector (ITU-T) designed G.729B VAD [21] comprising a set of metrics including line spectral frequencies (LSFs), low band energy, ZCR and full-band energy.
Besides, Chen et al. [22] proposed speech detection algorithm using microphone array in a noisy environments. However, the assumption of stationary may result in estimation errors from the above method due to the non-stationary nature of speech signals, the limited length of observed data and the size of the microphone array. To determine the presence or absence of speech, the observed signal statistics in the current frame are compared with the estimated noise statistics according to some decision rules. In [23], using the assumption that the Discrete Fourier Transform (DFT) coefficients of speech and noise are asymptotically independent Gaussian random variable, a statistical model-based VAD has been successfully proposed. Recently, S. Gazor et al. [24] proposed a VAD that uses a Laplacian distribution model for speech and outperforms the previous VADs that use a Gaussian model. Those algorithms, however, require extensive training of a Hidden Markov Model with the set of speech
prototypes to be encountered. In general, different applications need different algorithms to meet their specific requirements in terms of computational accuracy, complexity, robustness or sensitivity, response time, etc.
1.5 Objectives
Even if the noise is generated from a computer, an air conditioning system, or an automobile are not perfectly stationary. In practice, the background noise level usually varies with time. In this dissertation we mainly focus to propose a set of robust feature parameter for sufficiently characterizing speech signal even in variable noise level and/or in low SNRs. In addition to feature extraction, the adaptive threshold strategy is also considered as a VAD decision to adapt to the changes of the noise conditions. Enclosed herein we suggest a recursive-averaging based noise estimator containing the above-mentioned VAD to estimate noise spectrum continuously, quickly and accurately when existing a rapidly increasing noise level.
1.5.1 Frequency band analysis for voice activity detection using a measure of banded spectral entropy
The nature of banded lines on voice spectrogram generated from formant frequency band is a highly efficient, compact representation of the time-varying characteristics
of speech, especially for voiced sounds. Making good use of the representation, we can determine the detection of voice activity. In fact, the darkness of the corresponding spectrogram reacts where high powers concentrate. Through frequency band analysis, the input signal is firstly decomposed into 32 uniform subbands. The representation of peak and valley within subband power indicates the existence and absence of banded lines. Comparing with other feature parameter given from energy level, a measure of entropy defined in subband domain, regarded as banded spectrum
entropy (BSE), is then presented to exploit the inherent nature. In practice, the BSE
can be invalid when some subbands can be corrupted by noise. To avoid considering the harmful information resulting in erroneous detection of voice activity, an automatic band-selection method is appropriate to perform well in on-line, called
subband self-extraction (SSE). In addition, the ratio of low-band energy to full-band energy (RLF) is presented to discriminating the unvoiced sound from background
noises for compensating the limitation of entropy-based measure for modeling unvoiced sounds. Finally, the first approach for determining voice activity is regarded as entropy-based VAD algorithm.
1.5.2 A Noise Estimator with Rapid Adaptation in Variable-Level of Noisy Environments
Enclosed herein we propose a method for tracking the noise spectrum quickly, even when the noise levels suddenly increase. An explicit use of speech/silence detection is needed for estimating noise spectrum. So, the entropy-based VAD mentioned-above is used to continuously classify each frame of speech into the voice active/absent frames, and the noise spectrum estimate is updated using constant smoothing factor for voice absent frames and a time-frequency dependent smoothing factor for voice active frames. The time-frequency dependent smoothing factor is chosen as a Sigmoid function that changes with the voice present probabilities in frequency bins. The voice present probability is determined by computing the ratio of the noisy speech power spectrum to its local minimum. To speed up the minimum tracking, a fast method for tracking the minimum of the noisy speech power spectrum is presented. Additionally, to allow detection with entropy-based VAD under colored noise conditions, we propose to subtract the current spectrum by the estimated noise spectrum iteratively from the previous frame.
1.5.3 Voice activity detection based on wavelet analysis using a measure of auto-correlation function and Teager energy operator
To further exploit the transient components and non-stationary property for extracting speech signals, the alternative VAD approach is based on wavelet analysis.
In this method, the structure of three-layer wavelet decomposition is utilized to decompose speech signal into four non-uniform subbands here. In general, the well-known “Auto-Correlation Function (ACF)” is commonly used to detect periodicity of speech. Herein the ACF is defined in subband domain and then called as “subband auto-correlation function (SACF)”. In fact, the voiced sound has more significant periodicity than unvoiced sound and noise signal and the periodicity almost concentrates low frequency bands. So, we let the low frequency bands have high resolution to enhance the periodic property by decomposing only low band on each level. In addition, a nonlinear Teager energy operator (TEO) is then utilized into each subband signals. We show that the TEO can enhance the discrimination between speech and noise, and TEO is beneficial for the result of auto-correlation function (ACF) since it can provide a better representation of formant information.
Finally, to count accurately the intensity of periodicity on the envelope of the SACF on each subband, a Mean-Delta (MD) method [47] is utilized on each subband. So, the sum of Mean-Delta values of Subband Auto-Correlation Function (MDSACF) derived from the wavelet coefficients of three detailed scales and one appropriated scale is defined as a new robust feature parameter and called as “speech activity envelope (SAE)”. Comprising an adaptive threshold strategy, a robust wavelet-based VAD approach is further presented for extracting the boundary of voice activity
especially in variable noise level and low SNRs.
1.6 Organization of This Dissertation
The dissertation is organized as follows. In Chapter 2, we would illustrate the derivation of the two measures of BSE and RLF. In addition, a subband
self-extraction (SSE) strategy is shown to automatically select useful information on
some subband for compensate a complete measure of BSE. Afterwards, Chapter 3 would state a noise spectrum estimator with rapid adaptation algorithm for highly non-stationary noises. The above-mentioned VAD will be modified to employ into a noise spectrum estimator as an indicator of updating noise. Continuously, Chapter 4 presents the alternative VAD approach based on wavelet analysis for detecting voice activity. The Teager energy and mean-delta (MD) operators are respectively employed into auto-correlation function (ACF) of each subband to form a new SMDSACF (sum
of mean delta of subband auto-correlation function) parameter. Ultimately, Chapter 5
CHAPTER 2
FREQUENCY BAND ANALYSIS FOR VOICE
ACTIVITY DETECTION USING A MEASURE
OF BANDED SPECTRAL ENTROPY
The formant frequency representation is a highly efficient, compact representation of the time-varying characteristics of speech, especially for voiced sounds. In addition, the magnitude arrangement of spectral response during formant frequency is relatively important for characterizing speech signals. The so-called Banded Spectral Entropy (BSE), which is a measure of spectral entropy defined in subband domain, is then presented for extracting voice activity. In fact, noises can focus on some subbands to contaminate the useful information that results in error decision of detecting voice activity with BSE. In order to compensate this finds, a method of automatically selecting subband is then presented to meet the requirement, which is regarding as
energy (RLF) is presented to discriminating the unvoiced sound from background
noises since entropy-based measure can provide only for detection of unvoiced sounds.
2.1 Introduction
A feature parameter that can sufficiently characterize speech signals or be robust against the highly noisy environments is relatively required. So far, the current algorithms are based on short-time or spectral energy, zero-crossing rate (ZCR) and duration parameters [25]-[27]. All of these parameters, however, are rather sensitive to noise and cannot fully specify the characteristics of a speech signal. For example, the energy-based parameter and ZCR are not sufficient to distinguish a speech from a noise at low SNRs. In particular, the ZCR is very sensitive to various types of noise. Several other parameters have also been proposed, including linear prediction coefficients (LPCs), Cepstral coefficients and pitch [9], [11], [14]. Although these parameters are quite effective in expressing the characteristics of speech signals, the performance of VAD using such parameters remains poor in adverse environments. The reliability of the LPCs has been observed to depend strongly on the noise in adverse environment. Pitch information can help to detect speech; even so, extracting the correct pitch in noisy environments is difficult. Additionally, some algorithms
cannot be implemented for practical applications due to their high computational complexity, even though they perform well [28]. Among such approaches, however, Junqua et al. [29] proposed a time-frequency (TF) parameter to detect speech, which assumes that frequency information in the frequency ranges 250-3500 Hz is less contaminated by noise. The TF parameter is composed of both frequency energy in the fixed frequency bands and time energy. Based on the motivation that the frequency energies of various types of noise are concentrated in different frequency bands, Wu et al. [7] used the multi-band technique to analyze noisy speech signals, and then proposed an adaptive band-selection (ABS) method to cancel noise effectively by selecting useful bands. An adaptive time-frequency (ATF) parameter extended from TF parameter was proposed by them.
Although the ATF-based algorithm outperforms several algorithms commonly used for detecting voice activity in the presence of various types of noise, it cannot be reliably implemented in practical environments. It is found that the selection of useful bands depends on the information of an entire recorded signal. Additionally, the ATF parameter is also energy-based parameter and therefore less reliable in the presence of non-stationary noise or in a changing noise level. J. L. Shen et al. [30] firstly used the entropy-based parameter to detect speech signals. Their study indicated that the spectral entropy of a speech segment differed significantly from that of a noise
segment. In fact, the result of spectral entropy relies on the variance of spectral magnitude to distinguish a speech signal from a noise signal, but the variance of spectral magnitude depends strongly on the noisy environments. L. S. Huang [31] integrated both the time energy and spectral entropy to form a new feature parameter (EE-feature), since the spectral entropy failed under multi-talker babble and background music, but the energy performed well because of its additive property: the energy of the sum of speech plus noise always exceed the energy of noise. Although the EE-feature parameter proposed by L. S. Huang improved the endpoint detection under babble noise, it is unreliable when the noise level greatly exceeds the speech level.
The appearance of banded line on voice spectrogram resulted from formant frequency is a highly efficient, compact representation of the time-varying characteristics of speech, especially for voiced sounds. Since the locations of banded lines reveal that high powers concentrate on the some frequency bands, the band decomposition is used for locating formant frequency components by obtaining peaks while non-formant frequency components are characterized by obtaining valleys. It has been sufficient to display the location of power of formant frequency when the bandwidth of each subband is approximately 125 Hz [8]. A measure of entropy is defined in subband domain and is regarded as banded spectrum entropy (BSE)
parameter. In fact, the magnitude arrangement of spectral response during formant frequency is alternative relatively important factor for characterizing speech signals. So, a set of weighting factors among those subbands are also employed into BSE measure to discriminate the magnitude arrangement between speech signals and noise. According to the experimental result from Wu et al. [7], some subbands contaminated by noise can provide harmful information resulting in error decision of voice activity detection (VAD) with BSE. So, an automatic band-selection method derived from the refined version of the adaptive band selection (ABS) method proposed by Wu et al. is preferable to perform well in on-line, called subband self-extraction (SSE). In order to compensate the limitation of BSE measure for modeling unvoiced sounds, the ratio of
low-band energy to full-band energy (RLF) is presented to discriminating the
unvoiced sound from background noises.
This Chapter 2 is organized as the followings. Section 2.2 will introduce the theory of entropy. What is the motivation of using the entropy measure to describe the nature of banded lines on voice spectrogram? Additionally, the proposed feature parameters are stated, respectively. In Section 2.3, we derive the so-called subband self-extraction (SSE) method, which is extended from ABS and can adaptively select useful bands in on-line. And then, the procedure for implementing the proposed entropy-based VAD algorithm based on the measures of BSE and RLF and the strategy of SSE is outlined.
Section 2.4 discusses the performance of the proposed VAD algorithm under various noise conditions and compares its performance with that of ATF-based one. Finally, Section 2.5 summarizes the findings and discusses possible directions for future work.
2.2 The Robust Feature Parameters
This section introduces the theory of entropy and further shows the motivation of using the entropy for detecting speech. In addition, the robust feature parameters will be illustrated herein in detail.
2.2.1 Motivation
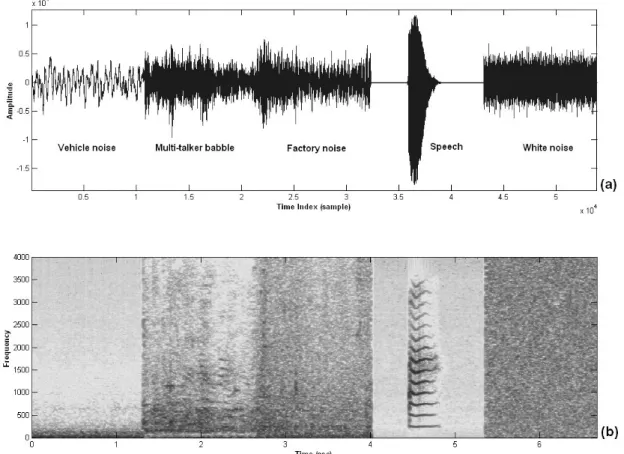
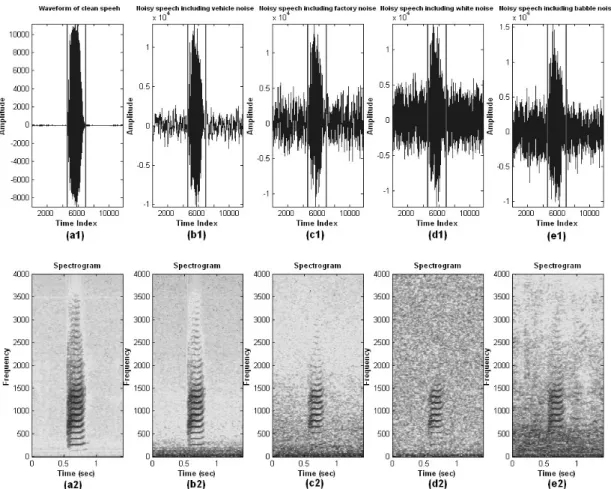
Fig. 2-1 displays that the waveform of a mixed signal comprising vehicle noise, multi-talker babble noise, factory noise, speech, and white noise and the corresponding spectrogram. Regarding to Fig. 2-1 (b), the voice-active spectrogram is dominated by the inherent nature of banded lines (or called formant traces). It is found that the nature is able to sufficiently discriminate speech signal from background noise. Fig. 2-2 displays the spectrograms of clean speech and noisy speech with four kinds of noise at 0 dB. In this figure, the nature of banded lines on voice spectrogram is seen to be existed against various types of additive noise. So, the formant frequency representation is a highly efficient, compact representation of the
time-varying characteristics of speech. The following statements will show how to use the representation of banded lines to detect voice activity by using a measure of entropy.
Entropy, firstly used in information theory by C. Shannon [32], is regarded as the amount of information that must be provided about a random signal x in order to specify it uniquely. It measures the degree of organization (uncertainty) of the signal and is defined by
( ) ( ) log[1 ( )],k k
k
H x =
∑
P x ⋅ P x (2-1)where x=
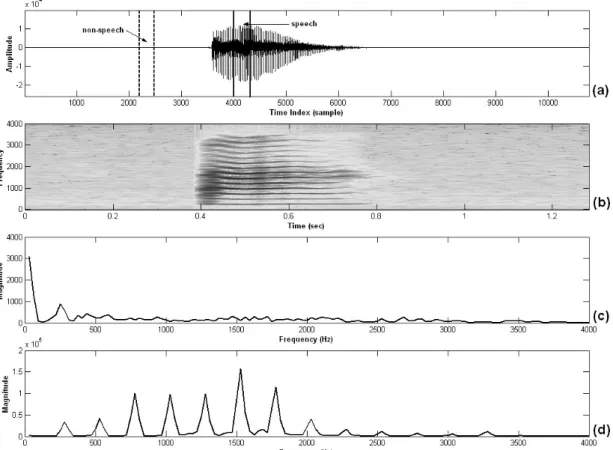
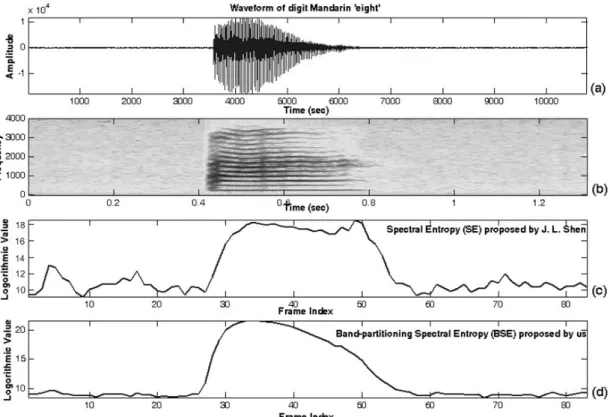
{ }
xk 0≤ ≤ −k N 1 and ( )P x is the probability of k x . kHow to use the definition of entropy for characterizing speech signal? Regarding to Fig. 2-3, the waveform of a Mandarin digit “eight” uttered by native speaker and the corresponding spectrogram are shown in Fig. 2-3(a)-(b), respectively. Since the pitch varies continuously within a speech segment for speech production, the banded lines on voice-active spectrogram are also continuous. When such a clear set of banded lines exist in some frequency bands for a long enough time, the voice activity can be quite certainly presented [33]. Fig. 2-2(c)–(d) show the spectrum magnitude of voice activity obtained by the short-time Fourier transform (STFT) over a solid-line region in Fig. 2-3(a) and that of voice inactivity obtained segment by STFT over a dashed-line region in Fig. 2-3(a), respectively. Inspecting the difference between the
spectrum magnitude of voice activity and that of voice inactivity, we can regard that the amount of variance (uncertainty) from the spectral magnitude during voice activity indeed exceeds that during voice-inactivity. Consequently, a measure of spectral entropy can be used for discriminating the spectral difference between during voice activity and during voice inactivity even if noise level is greater than speech level.
2.2.2 A Measure of Conventional Spectral Entropy (SE)
J. L. Shen et al. [30] firstly used a measure of entropy for detecting speech segments under adverse conditions. The measure was defined in spectral domain and named as spectral entropy (SE). Their experimental results have been revealed that the result of SE during voice activity differs from that during voice-inactivity. The deviation for calculating SE parameter is described as follows.
The STFT of a given time frame s n l is accomplished by ( , )
1 0 ( , ) w ( ) ( , ) exp( 2 / ), 0 1, N w w n X ω l W n s n l j πωn N ω N − = =
∑
⋅ ⋅ − ≤ ≤ − (2-2)where ( , )X ω l represents the spectral magnitude of the ωth frequency bin of the
th
l frame. N is the total number of frequency bins in STFT for each frequency w
frame. ( )W n is a Hamming window. The spectral energy of each frame,
( , ) energy X ω l , is described as follows. 2 ( , ) ( , ) , 0 2 1. energy w X ω l = X ω l ≤ ≤ω N − (2-3)
Then, the probability associated with each spectral energy component, ( , )P i l , can be estimated by normalizing: 2 1 1 ( , ) ( , ) , 0 2 1. ( , ) w energy w N energy X k l P k l k N X l ω ω − = = ≤ ≤ −
∑
(2-4)Following normalization, the corresponding SE, H l , is defined as follows. ( )
2 1 1 ( ) w ( , ) log[1/ ( , )]. N H l P l P l ω ω ω − = =
∑
⋅ (2-5)2.2.3 A Measure of The Proposed Banded Spectrum Entropy (BSE)
In fact, the SE measure performs well in white or quasi-white noise, but fails in colored noise. The magnitude associated with each frequency bin is easily contaminated by noise. This results in degradation of the efficiency of VAD performing in seriously low SNRs. So, frequency band analysis is employed into a measure of SE for improving the robustness.
Next, we decompose the input signals into 32 uniform subbands. The subband energy, ( , )E m l , is given by b / 2 / 2 ( 1) 1 / 2 ( 1) ( , ) ( , ), 1 , w w b b w b N N m N N b energy b N m N E m l X l m N ω ω ⎛ ⎞ − × +⎜ −⎟ ⎝ ⎠ = − × =
∑
≤ ≤ (2-6)where N is the number of total decomposed subband on each frame. The limits of b
the summation denote the boundary of each subband. For example, if m= , the 1th boundary of the first subband means that k is 0 to 3.
Consequently, we modify (2-4) as (2-7) shown as below: 1 ( , ) ( , ) b ( , ), 1 . N b b b b k P m l E m l E k l m N = =
∑
≤ ≤ (2-7)where ( , )Pb ω l is the probability associated with band energy.
Then, the measure of banded spectral entropy (BSE), H l , is given by b( )
1 ( ) b ( , ) log[1/ ( , )]. N b b b m H l P m l P m l = =
∑
⋅ (2-8)In fact, the magnitude arrangement of spectral response during formant frequency is alternative relatively important factor for characterizing speech signals. So, the order of subband power must be considered for describing the magnitude arrangement. The well-known measure of entropy, however, cannot indicate a distribution (spatial information) of the data sequence. Fig. 2-4 denotes the power distribution of all decomposed 32 subband during voice-active frames and voice-absent frames. It illustrates that the classical spectral entropy is not able to discriminate the difference between the duration of speech and the duration of non-speech for the distribution of subband energy. The distribution of subband energy during a speech segment and that during a non-speech segment are shown in Fig. 2-4(a) and Fig. 2-4(b). Measuring on the two kinds of distributions of subband energy by spectral entropy, we can get the same logarithmic BSE value (H=21.9601). Major cause is resulted form the invalid description in the nature of banded lines on voice-active spectrogram.
are employed into BSE measure to discriminate the magnitude arrangement between speech signals and noise.
1 1 2 1 1 1 1 ( , ) ( ) , , 3 3 m m i i i m i m W m l + e µ µ + e = − = − =
∑
− =∑
(2-9) 1 1 min[ ( )] , ( 1, ) min[ ( )] , ( , ) min[ ( )] , ( 1, ) b m b b m b b m b P l e P m l P l e P m l P l e P m l − + = − = = + (2-10)where e means the biased energy of subbands. m W m l represents the variance ( , ) amount among the three biased energy of subbands. min[ ( )]P l is the minimal b
spectral energy among all 32 subbands and regarded as a normalized factor. If ( , )
W m l on the m subband is great, this implies that the banded line may be th located around these subbands from the (m−1)th subband to the (m+1)th subband.
Conversely, if the ( , )W m l value is low, it indicates that the banded line is not
located on these subbands. By using the set of weighting factors ( , )W m l , the
magnitude arrangement of spectral response can be explicated the nature of banded lines on voice-active spectrogram and (2-8) is modified as (2-11) as follows:
1 ( ) b ( , ) ( , ) log[1/ ( , )]. N b b b m H l W m l P m l P m l = =
∑
⋅ ⋅ (2-11)Fig. 2-5 clearly indicates that the proposed BSE parameter, using the method of band decomposition and a set of weighting factors ( , )W m l , more sufficiently
parameter proposed J. L. Shen et al. [30].
In fact, the frequency energies of difference types of noise are concentrated on different frequency bands [7], as shown in Fig. 2-6. This observation demonstrates that the subbands with larger noisy energy more contaminate the useful frequency information than do the other bands. The bands with larger noisy energy can be regarded as harmful subbands afterworld and must be discarded accurately to yield more accurate frequency information. Although the BSE remains a good feature parameter, the detection sometimes fails at seriously low SNRs, especially when relatively harmful bands are involved. How to discard the harmful subbands or preserve the useful subbands becomes a serious task. The number of harmful bands (or useful subbands) is relatively related to the background noise level [7]. To easily estimate the background noise level, we extend the MiMSB parameter [34] to adaptively choose one subband with minimum energy for estimating the varying noise level roughly. Regardless of changing level of noise, a normalized minimum band
energy (NMinBE) parameter is proposed to estimate the background noise level for
precisely deciding the number of useful subbands. The NMinBE parameter is determined as follow:
{
}
1 NMinBE( ) log[min ( , ) / b ( , )], N b b m l E m l E m l = = −∑
(2-12)energies for a given frame, and log
[ ]
⋅ is the logarithmic operation. The number of useful subbands, N l , required to yield reliable information. Fig. 2-7 displays the ub( ) relation between N lub( ) and NMinBE( )l .30 NMinBE( ) 5; NMinBE( ) ( ) [36.5 (4 30)] 5<NMinBE( )<25; (25 5) 4 otherwise. ub l l N l l ⎧ < ⎪ ⎪ =⎨ + × − − ⎪ ⎪⎩ (2-13)
It is observed that a large N l should be used at a low noise level ub( )
(corresponding to a high SNR), and a small N lub( ) should be used at a high noise level (corresponding to a low SNR). According to (2-13), for the lth frame the first
(32−N lub( )) frequency bands with larger energies are adaptively selected to remove noise component. Finally, the measure of BSE parameter with a strategy of extracting the useful subband is achieved by the follows:
( ) 1 ( ) ub ( , ) ( , ) log[1/ ( , )]. N l b b b m H l W m l P m l P m l = =
∑
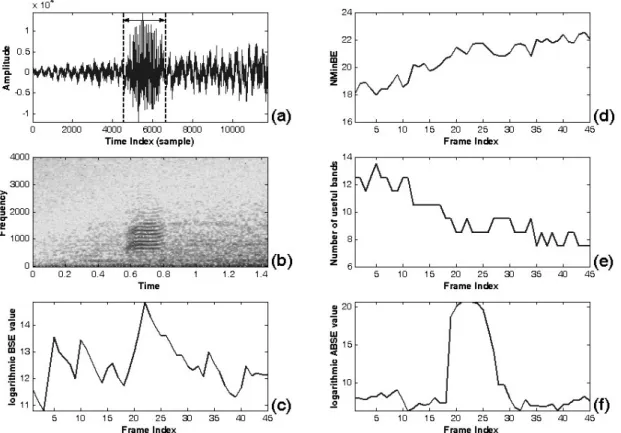
⋅ ⋅ (2-14)The variable noise level and the varying statistics of noise, in general, results in a varying ( )N l over an entire signal. According to the relationship between ub N l ub( ) and noise level described in (2-13), we can evaluate the efficiency of a strategy of extracting the useful subband on a measure of BSE. Fig. 2-8(a) and 2-8(b) plots the waveform of someone’s saying the Mandarin digit “eight” with increasing-level of factory noise and the corresponding spectrogram, respectively. The voice activity is not easily detected in an adverse environment due to a measure of BSE involving
some harmful subbands, as shown in Fig. 2-8(c). Regarding to the Fig. 2-8(d), it is shown that the proposed NMinBE parameter can reflect the variation of noise level. According to the relation in Fig. 2-7, the number of useful subbands can be determined as shown in Fig. 2-8(e). Fig. 2-8(f) displays that a measure of BSE with a manual extraction of useful subbands can greatly improve the performance of detecting voice activity, especially at variable level of noise. Consequently, how to automatically extract useful subbands with time is crucial and discussed in next section.
2.2.4 The Ratio of Low-band Energy to Full-band Energy (RLF)
Unlike voiced sounds, unvoiced sounds do not have any component of formant frequency. By measuring the energy level, the unvoiced sound is difficultly discriminated from background noise. The majority of unvoiced sounds, however, display string spectral concentration in higher frequency range. The background noise display uniform spectral distribution, It is possible to distinguish between speech-active and background noise by examining the distribution of energy along the frequencies. Low-band energy, Elow( )l , measured on the below 1000 Hz, is computed
as follows:
(
4)
0 ˆ ( ) 10 log ( , ) , low energy E l = ×∑
ω πω== X ω l (2-15)where ˆXenergy is obtained by ignoring the harmful subbands.
Similarly, full-band energy, Efull( )l , measured on entire frequency bandwidth
(0~4000 Hz), is given by
(
0 ˆ)
( ) 10 log ( , ) .
full energy
E l = ×
∑
ω πω== X ω l (2-16)So, the ratio of low-band energy to full-band energy, R llf( ), is given by
( ) ( ) . ( ) low lf full E l R l E l = (2-17)
2.3 The Proposed Entropy-based VAD Algorithm
According to [26], the required characteristics of an ideal voice activity detector are reliability, robustness, accuracy, adaptation, simplicity and real-time processing. Although some existing VAD algorithms are extremely accurate, they all depend on complicated computation and are not reliable in real applications. For example, Wang
et al. [28] proposed a robust algorithm based on wavelet analysis, but it indeed
performs in off-line. E. Nemer et al. [20] used higher-order-statistics (HOS) parameter to detect speech, but the calculation of this parameter required too much computing time. Wu et al. [7] suggested an adaptive band-selection (ABS) method, which can select useful bands automatically, as noise cancellation to perform ATF parameter well. However, the execution of ABS method depends on the obtainment of all information from the entire recorded signals. Although those algorithms are
inappropriate for practical implementation, some ideas related to those algorithms are adopted herein. The ABS method proposed by Wu et al. [7] is strong with respect to noise cancellation. The ABS was used to preserve the useful bands (or discard the harmful bands) for each frame, but the execution of band selection depends on entire recorded signal. The drawbacks of ABS are thus as the following:
-- Firstly, the decision of band selection is not immediately determined. Since the method is an off-line strategy, its decision must be determined by analyzing an entire recorded signal.
-- Secondly, the indexes associated with the harmful bands vary with time for entire recorded signals in practice. However, Wu et al. assumed that the indexes of harmful bands were fixed. This assumption does not hold.
So, how to detect whenever the index of harmful bands vary with time is relatively required. Regarding to the Fig. 2-8(f) again, we observe that the selected subbands are not contaminated by noise. The corresponding BSE value in voice absence is small and smoothly and slightly varies with time as comparing with Fig. 2-8(c). Conversely, regarding to Fig. 2-8(c), the selected bands are contaminated by background factory noise. However, the entropy value in voice absence is large and its variation is also violent. In the conclusion, it reveals that the determined entropy value is quite large and violently varying whenever the considered subbands include harmful subbands;
the determined entropy value is small and its variation is very smooth if the considered subbands do not include harmful subbands. This finding provides a hint about how to detect whenever the indexes of harmful bands vary with time.
2.3.1 An Adaptive Threshold Method
In order to extract the harmful subbands automatically, an adaptive thresholding not only provides a decision of VAD, but also determines what time is execution of selecting the useful subbands. Herein, an adaptive threshold with minimal processing delay [35] is employed to on-line work. The work of adaptive threshold method used for a VAD decision is illustrated as below. To adapt to time-varying characteristic of noise, the detection method must sets an adaptive threshold to classify voice-active frames or voice-absent frames. During a short period of initialization, the mean and variance of the logarithmic value of BSE measure is estimated over voice-absence after manual extracting useful subbands. The adaptive speech threshold, Ts, is initially computed from the local noise statistics shown as below
, s
T = + ⋅ µ α σ (2-18)
where µ and σ are the mean and variance of the logarithmic value of BSE
respectively, and α is an adjustment coefficient determined in experiment.
frame. Whenever the difference surpasses a specified threshold, voice-active frame is detected. If a given frame is detected to fall in a non-speech period, the speech threshold T is updated. s
During voice activity, we remain the speech threshold until voice absence. The mean and variance of the logarithmic value of BSE measure are updated as follows.
(1 ) ( )
new H lb
µ = ⋅ + −β µ β ⋅ , (2-19)
2 2
, ( )
new Hb mean l new
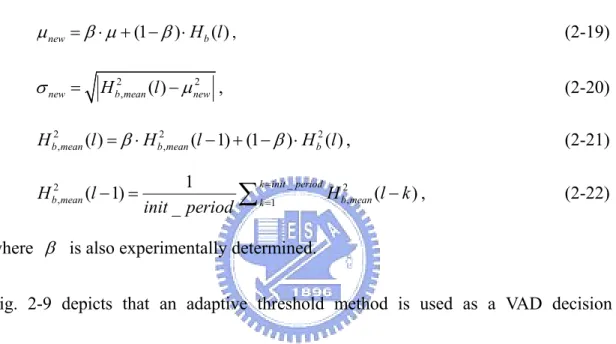
σ = −µ , (2-20) 2 2 2 , ( ) , ( 1) (1 ) ( ) b mean b mean b H l = ⋅β H l− + −β ⋅H l , (2-21) _ 2 2 , 1 , 1 ( 1) ( ) _ k init period b mean k b mean H l H l k init period = = − =
∑
− , (2-22)where β is also experimentally determined.
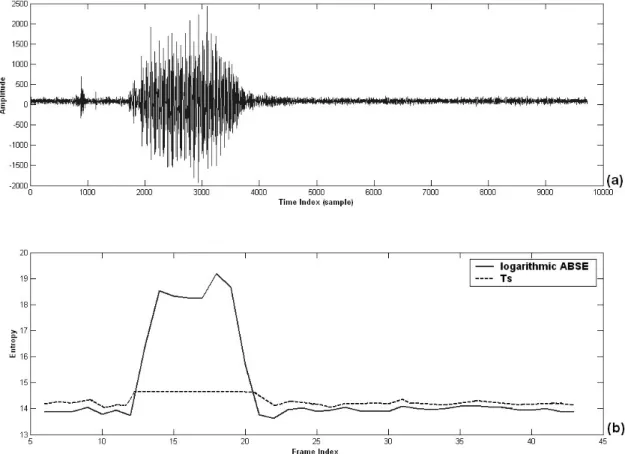
Fig. 2-9 depicts that an adaptive threshold method is used as a VAD decision performing in on-line. In this figure, an utterance of the Mandarin word for “one” is together with the logarithmic value of BSE measure and adaptive speech threshold T . s
The results indicate clearly that the speech threshold T is updated in voice absence s
and maintained in voice activity. In addition, it is found that the value of adaptive threshold is indeed adaptive to time-varying noisy environment.
2.3.2 The Strategy of Subband Self-Extraction (SSE)
strategy of subband self-extraction (SSE) used for automatically extracting the useful subbands would be illustrated in detail. The execution of SSE depends on the fact that whenever the value of logarithmic BSE exceeds the adaptive threshold. If the value of logarithmic BSE exceeds the adaptive threshold, it means two kinds of probabilistic results. One is that the voice activity is detected. Other is error of VAD detection resulted from the consideration of harmful subbands when computing a measure of BSE.
An indicator for execution of band extraction (EOBE) parameter is used to stand for binary decision of performing band selection on each frame. The EOBE is defined as follows. high ( ) ; EOBE low otherwise. b s H l >T ⎧ = ⎨ ⎩ (2-23)
If indicator of EOBE is low for a given frame, it implies that the considered subbands do not include any harmful subbands and the indexes of harmful subbands within noise power do not vary violently with time. In general, the indexes can be maintained from the previous frame to the current frame until EOBE is high so that the task of harmful subbands detection cannot be executed which results in significant decrease of computing complexity. Similarly, if indicator of EOBE is high for a given frame, it implies that the considered subbands maybe include some harmful subbands resulting in an abrupt change in contour of BSE. The indexes of harmful subbands
maybe vary violently with time so that the task of harmful bands detection is performed right now.
Fig 2-10 illustrates the SSE strategy in detail. When the current BSE value with the previous estimated useful subbands exceeds the adaptive threshold T , one of two s
possibilities obtains: one implies that the voice activity is detected, and another means that the BSE value in error due to the inclusion of harmful subbands so that the harmful bands must be detected again. If the re-detected BSE value remains greater than T , the voice-active frame is detected and s T is not updated. Conversely, if the s
re-detected BSE value is indeed less than T , it mean that the voice-absent frame is s
detected and T must be updated. In addition, we further assume that the subbands s
where noise is concentrated are the same as in the previous frame.
2.3.3 The Block Diagram
The proposed entropy-based VAD algorithm is diagramed in Fig. 2-11 and each of VAD is illustrated in detail.
1) Decomposition of 32-uniform subband:
For the frequency band analysis, the input noisy speech is decomposed into 32 uniform subbands as preprocessing of developing a robust feature parameter.
When formulating a measure of BSE, we exploit the magnitude arrangement to discriminate the ambiguity between the short-time spectral magnitude during voice activity and that during voice-inactivity
3) The strategy of subband self-extraction (SSE):
In fact, some subbands can be contaminated by noise to result in the harmful information for detecting voice activity. So, automatically extracting useful subbands via the result of adaptive thresholding (AT) would avoid the occurrence of error BSE value.
4) The computation of BSE measure:
After the computation of a set of weighting factors and excitation of SSE strategy on each frame, a measure of entropy is defined in the selected subbands.
5) The computation of RLF measure:
By ignoring the estimated harmful subbands, the robust RLF measure can be reached. Regarding to Fig. 2-12, it illustrates more detail for the configuration of proposed entropy-based VAD.
6) An adaptive thresholding (AT):
Performing AT strategy to adapt the two thresholds to time-varying statistics of noise, the boundaries of voiced and unvoiced sounds are detected.
1, if ( ) , 0, otherwise. s v H l T f = ⎨⎧ > ⎩ (2-24)
In addition, a unvoiced sound flag, f , is set according to following equation uv
1 2 0, if ( ) 1, otherwise lf lf lf uv T R l T f = ⎨⎧ ≤ ≤ ⎩ (2-25)
where T and lf1 T are the adaptive thresholds for unvoiced and voiced speech, lf2
respectively.
Fig. 2-12 shows the result of RLF measure tested in recorded speech sentence /start/. It is can be seen that the existence of the unvoiced sound in phoneme /s/. Fig. 2-13 states the process of developing the two feature parameters more clearly.
7) The VAD Decision:
Using (2-24) and (2-25) the VAD result of the proposed method is now given by
( )VAD l = f lv( )∪ f luv( ) (2-26)
The zero and non-zero of VAD result mean the voice-inactive frame and voice-active frame, respectively.
2.4 Evaluation
To evaluate the proposed VAD algorithm comprising the two measures of BSE and RLF, the recorded signal is tested in four kinds of noise including vehicle, multi-talker babble, factory, and white noises taken from the NOISEX-92 database [49] at various
SNRs. In addition, the probabilities of correct and false detection are used as objective measurement and defined as bellows:
--Probability of correctly detecting speech frames, P : computed as the ratio of cS
correct speech detections to the total number of hand-labeled speech frames.
--Probability of falsely detecting speech frames, P : computed as the ratio of falsely fS
classified speech frames to the total number of hand-labeled speech frames.
In the following experiment, the speech corpora are collected from MAT (Mandarin across Taiwan) database including a set of isolated utterances of the ten digits in Mandarin. The sampling rate was 8 kHz and the speech was stored as 16-bit integers. The decomposed band size N = 32, window size b N = 256, and overlap size = w
2 w
N . The recordings are also tested in a real car environment with musical
background noise.
2.4.1 Artificially Added Noise
The four noise signals were added to the recorded speech signals with different SNRs (the SNRs is herein defined as the ratio of the power of the entire recordings containing silence and voice parts to the power of additive noise) including -5 dB, 0dB, 10 dB, and 40 dB to generate noisy speech signals. Using these various types of noise and different SNRs, the P and cS P of proposed algorithm were compared fS
with those of the ATF-based algorithm. TABLE 2-I displays the comparisons between the presented entropy-based and ATF-based VADs. It is clearly found that the proposed entropy-based VAD algorithm is superior to the ATF-based algorithm, especially at low SNRs. At high SNRs the ATF-based algorithm performs as well as the RABS-BSE-based one; however, at low SNRs the ATF parameter related to pure energy-based feature is no longer valid. Although ABS associated with ATF-based algorithm claims that it can extract useful subbands, the claim cannot reflex the correct information within the selected subbands. In addition, the indexes of the harmful subbands from ATF-based VAD are assumed to be fixed with time, and this assumption is incorrect so that the performance of ATF-based VAD is seriously degraded under adverse conditions. Using the measure of spectrum entropy defined in subbands, the nature of banded lines on voice spectrogram can be exploited and further classified voice-active frame or voice-absent frame. For vehicle and white noises, whose frequencies are spread simply over the spectrum, the proposed algorithm is superior to the ATF-based one. Especially for white noise, it is proved that the VAD based on spectral entropy performs well in this case. Besides, the two types of noises have no any prominent banded lines on the corresponding voice spectrograms. The factory noise is also same as described above. The babble noise is pronounced by multi-talker, but the nature of banded lines of babble noise is weaker
than that in speech signal. Our experimental result shows that the proposed entropy-based VAD algorithm still successfully outperforms the ATF-based algorithm under babble noise. For the average probability of correct detection of speech frames,
cS
P , the proposed algorithm exceeds the ATF-based algorithm by around 8.73%.
Similarly, for the average probability of false detection speech frames, P , the fS
proposed algorithm is less than the ATF-based algorithm by around 7.08%.
2.4.2 Recordings in a Car
To evaluate the effectiveness of the proposed feature parameter in a real environment, the musical noise is generated around the recordings in a real car. Fig. 2-14 shows the comparison between various types of feature parameter under musical background noise inside a car. Fig. 2-14(a) displays an utterance in Chinese, “Guo Li Chiao Tung Da Xue” made with musical background noise in a car. The corresponding spectrogram also shows in Fig. 2-14(b) and clearly displays that the banded nature appears only in voice-active spectrogram. Fig. 2-14(c) and 2-14(d) demonstrate that the short-time energy and ZCR both fail in a car environment. Fig. 2-14(e) shows that the ATF parameter outperforms the other two due to that the ATF parameter can extract useful frequency information by selecting proper subbands; however, it is still a purely energy-based parameter so that the ATF parameter fails in
a rapid increase of noise. Fig. 2-14(f) indicates that the BSE parameter is superior to the other parameters, especially in a rapid increase of noise since BSE parameter catches only the profiles of banded lines not their energy levels. In TABLE 2-II, the proposed entropy-based VAD is compared with the ATF-based VAD [7] testing in musical background noise within a car. The speech database used in the experiments contains ten isolated controlled-commands in Mandarin Chinese produced by 15 native speakers. The employed speech recognizer is based on a DTW-based recognizer. During the entire process, the car was moving and its radio was on. It is observed that the total probability of correct detection of the proposed algorithm is greater than that of the ATF-based one by about 10.6%, and the total probability of false detection of the proposed VAD algorithm is smaller than that of the ATF-based one by about 5.9%.
2.5 Discussion & Future Work
In Chapter 2, the objective mainly exploits the nature of the banded lines (or called formant traces) on voice-active spectrogram to regard as a robust feature. Via frequency band analysis, the inherent nature can be characterized by a measure of entropy defined subband domain. In fact, some subbands can be contaminated by noise to result in error of BSE value. Consequently, an on-line SSE strategy is used to