國
立
交
通
大
學
材料科學及工程研究所
博 士
論
文
低溫化銀電極膏製備與高頻應用之研究
Preparation and High-frequency Application of
Low-temperature-curing Silver Paste
研 究 生:林鴻欽
指導教授:林 鵬 教授
王錫福 教授
低溫化銀電極膏製備與高頻應用之研究
Preparation and High-frequency Application of
Low-temperature-curing Silver Paste
研 究 生:林鴻欽 Student:Hong-Ching Lin 指導教授:林 鵬 Advisor:Pang Lin 王錫福 Sea-Fue Wang 國 立 交 通 大 學 材 料 科 學 及 工 程 研 究 所 博 士 論 文 A Thesis
Submitted to Department of Materials Science and Engineering College of Engineering
National Chiao Tung University in partial Fulfillment of the Requirements
for the Degree of Doctor of Philosophy
in
Materials Science and Engineering Science
July 2008
Hsinchu, Taiwan, Republic of China
i 低溫化銀電極膏製備與高頻應用之研究 學生:林鴻欽 指導教授:林 鵬 王錫福 國立交通大學材料科學及工程研究所 博士班 摘 要 本論文研究分別以草酸銀和氧化銀做為誘發金屬有機銀鹽類 ( Metallo- Organic Decomposition, MOD ) 的反應劑,以高速混合機及三軸滾輪進行混 合及分散等來製備金屬銀膏。銀膏之燒附條件可藉由草酸銀和氧化銀的添 加 而 降 低 金 屬 有 機 銀 鹽 類 產 生 熱 裂 解 反 應 ( Thermal Decomposition Reaction )的溫度,並使金屬有機銀鹽類與添加劑還原形成奈米金屬銀後形 成金屬膜。
本 研 究 針 對 所 製 備 出 之 金 屬 膜 層 進 行 分 析 與 研 究 , 藉 由 熱 重 分 析 ( Thermogravimetric analysis, TGA)、熱差分析 ( Differential thermal analysis, DTA) 與 ( Derivative thermogravimetry, DTG)等,探討不同反應劑對金屬有 機銀鹽類之熱裂解反應,並藉由掃瞄式電子顯微鏡 ( SEM )分析金屬膜之微 結構及燒附現象,透過動態流變儀( Stress and Strain Rheometers ) 量測之黏 彈性行為 ( Viscoelasticity ) 探討不同反應劑於膏體中之各項流變特性等。 針對其中分布均勻性與觸媒反應特性最好之氧化銀反應劑進行成份及熱裂 解反應等深入之探討與研究,找尋出最佳之組合量。研究中更針對高溫、 低溫燒附行為之金屬膜層的高頻阻抗特性進行深入研究與比較。並初步完 成濾波器元件特性,後續將針對低溫高頻元件進行研究。
iii
Preparation and High-frequency Application of Low-temperature-curing Silver Paste
Student:Hong-Ching Lin Advisors:Dr. Pang Lin Dr. Sea-Fue Wang
Department of Materials Science and Engineering National Chiao Tung University
ABSTRACT
In this study, at first, focus on the effect of silver oxalate addition on physical characteristics of metallo-organic-decomposition (MOD) silver screen-printable paste for thick film technology. The addition of silver oxalate in the paste not only produces fresh fine silver particles after curing, but also reduces the decomposition temperature of the lubricant coated on the silver flakes. This is an effective route to provide fine silver particles to the paste without significantly changing the rheological behavior.
Then, the next study focus on paste formulations containing silver oxide coated with MOD (metallo-organic decomposition) agent of silver stearate were prepared without the use of any silver powders or silver flakes. The lowest electrical resistivity of 13.2x10⁻⁶ Ω-cm was obtained for the film prepared from paste with the Ag2O/silver stearate ratio of 100:5 at a solid loading of 80wt% in solvent α-terpineol, after being cured at 160°C for 5min, which meets the requirements of low-temperature and high speed manufacturing for practical applications. Co-existence of the Ag2O and silver stearate induces their simultaneous transformation to the silver form at temperatures below 160°C.
The electrical properties of silver films, prepared using a low-curing-temperature metallo-organic-decomposition (MOD) paste and a high-temperature silver paste
iv
screen-printed on polished and nonpolished alumina substrates, at microwave frequency were characterized in this study. At last, to evaluate RF electrical properties between low-temperature-curing and high-temperature silver paste, multilayered structure and the low-temperature co-fired ceramic technology are employed to design and fabricate the filter.
i
誌 謝
由衷感謝我的指導教授-林鵬 博士和王錫福 博士,在這段時間對我辛勤 的教導。在實驗嚴謹性的要求和論文撰寫的指導上讓我獲益良多,在此致 上最深的謝意。 再來要感謝的是工研院材化所讓我有進修的機會,在此要謝謝我的長官 們,尤其是洪英彰副組長無論是在實驗上和生活態度上都毫不吝嗇的提供 建議。另外特別要感謝盧俊安學弟在實驗和論文資料整理的大力幫忙。也 要感謝研究室的其他同仁: 啟仁、信賢、麗琳、宏達、穎容、炯雄和俊璋, 在工作上的鼎力協助讓我能順利完成學業。因為論文完成的時間太長,如 果有遺漏的同仁請不要介意。 特別要感謝我的家人,感謝父母在我成長路上的栽培。 感謝我的內人 如惠在這一段漫長的日子裡對我的幫助與包容,還有老天賜給我三個可愛 的小孩長盟、長楙和長鈺,他們帶給我的精神力量。 最後要感謝在已經在天上的紀財叔公和紀備叔父的鼓勵。iv
Contents
Abstract (in Chinese) i
Abstract (in English) ii
Contents iv
Table Caption vii
Figures Caption ix
Chapter 1 Overview
1
1-1 General Background 1
1-2 Silver paste 5
1-3 Analyses and Measurement Techniques 7
1-3-1 Thermogravimetric analysis, TGA 7 1-3-2 Differential thermal analysis, DTA 12 1-3-3 Stress and Strain Rheometers 15
References 21
Chapter 2 Experiment
27
2-1 Mixing Process of Paste 27
2-2 Printing Process 27
2-3 Thermal Analyses 28
2-4 Electrical Measurement 28
References 30
Chapter 3
Effects of Silver Oxalate Additions on the
Physical Characteristics of
Low-Temperature-Curing MOD Silver Paste for
Thick Film Applications
37
v
3-2 Experiment Procedure 41
3-3 Results and Discussion 43
3-4 Summary 47
References 48
Chapter 4
Microstructure and Electrical Resistivity of
Low-Temperature-Cured Silver Films Prepared
with Silver Oxide and Silver Stearate Pastes
56
4-1 Introduction 57
4-2 Experiment Procedure 60
4-3 Results and Discussion 62
4-4 Summary 67
References 68
Chapter 5
Thermal Behavior and Transformation Kinetics
of Titanium Dioxide Nanocrystallites Prepared
by Coupling Agents
82
5-1 Introduction 83
5-2 Experiment Procedure 85
5-2-1 Powder and coupling agent characterization 85
5-2-2 Thermal analysis 85
5-2-3 Characterization of calcined coupling agent 86
5-3 Results and Discussion 87
5-3-1 Thermal decomposition of coupling agents 87 5-3-2 Crystallization kinetics of coupling agents 87
5-4 Summary 91
vi
Chapter 6
High-Frequency Electrical Properties of Silver
Thick Films Measured by Dielectric Resonator
Method
104
6-1 Introduction 106
6-2 Theoretical Consideration of Surface Resistivity Measurement 107
6-3 Experiment Procedure 109
6-3-1 Sample preparation 109
6-3-2 Characterizations 110
6-4 Results and Discussion 112
6-5 Summary 117
References 119
Chapter 7
A Compact Cascade Quadruplet Bandpass Filter
With Low Temperature Co-fired Ceramic
Technology
130
7-1 Introduction 131
7-2 Theory of Filter 132
7-3 Fabrication and Measurement 134
7-4 Summary 132
References 136
Chapter 8
Conclusion and Suggestion of Future Work
145
8-1 Conclusion 145
vii
Table Caption
Chapter 1
Table 1-1 Metal electrical conductivity and thermal conductivity
properties 23
Table 1-2 Kinetic equations of heterogenous decomposition of solids 24
Chapter 3
Table 3-1 Formulations of the pastes prepared in this study 55
Chapter 4
Table 4-1 Formulations of low-curing-temperature silver pastes
prepared in this study 81
Chapter 6
Table 6-1
Long-term and short-term surface roughness values of silver films prepared using MOD silver paste as well as high-temperature silver paste screen-printed on polished and nonpolished alumina.
126
Table 6-2
DC resistivities of silver films prepared using MOD silver paste as well as high-temperature silver paste screen-printed on polished and nonpolished alumina, measured using the four-point probe method.
127
Table 6-3
Surface resistance and effective conductivity of silver films prepared using MOD silver paste as well as high-temperature silver paste screen-printed on polished and nonpolished alumina, measured at microwave frequency range.
128
Table 6-4
Simulated and measured Q-values and resonance frequency values of T-type resonators prepared from the films using both low-curing-temperature MOD silver paste and high-temperature silver paste.
129
viii
ix
Figures Caption
Chapter 1
Figure 1-1 A typical RFID System 25
Figure 1-2 The diagram of Parelec Inc innovative 2-step low curing
and roll-to-roll printing metal ink process
26
Chapter 2
Figure 2-1 The high speed mixer structure 31
Figure 2-2 The mechanism of triple roller grinding structures 32
Figure 2-3 The structure chart of screen-printing 33
Figure 2-4 The chart of spiral line structure for resistivity
measurement
34
Figure 2-5 The photo of spiral line structure printing results 35
Figure 2-6 Schematic of dielectric resonator 36
Chapter 3
Figure 3-1 DTA curves for pure silver 2-ethylhexanoate and pure silver oxalate.
49
Figure 3-2 TGA curves for the pastes with 0 and 3wt% silver oxalate additions.
50
Figure 3-3(a) Rheological properties of the pastes with various amounts of silver oxalate added.
51
Figure 3-3(b) Rheological properties of the pastes with various amounts of silver oxalate added.
52
x
pastes with (a) 0 wt%, (b) 3 wt%, and (c) 10 wt% silver oxalate added and cured at 225°C for 5 min.
Figure 3-5 Resistivity of silver films prepared from the pastes with various amounts of silver oxalate added and cured at various temperatures for 5 min.
54
Chapter 4
Figure 4-1 TGA results of pastes prepared from various alpha -terpineol/Ag2O/silver stearate ratios.
70
Figure 4-2 TGA results of the pure silver oxide, pure silver stearate, and silver-stearate-coated Ag2O (100:5).
71
Figure 4-3 TGA results of the coated powder of Ag2O with silver
stearate at various ratios.
72
Figure 4-4(a) Rheological behaviors of pastes with various ratios of Ag2O and silver stearate at a solid loading of (a) 70wt%
and (b) 80wt%.
73
Figure 4-4(b) Rheological behaviors of pastes with various ratios of Ag2O and silver stearate at a solid loading of (a) 70wt%
and (b) 80wt%.
74
Figure 4-5(a) The electrical resistivity of silver films prepared from the pastes with various Ag2O/silver stearate ratios and solid
loadings, after being cured at 160°C for (a) 5 min and (b) 10min.
75
Figure 4-5(b) The electrical resistivity of silver films prepared from the pastes with various Ag2O/silver stearate ratios and solid
loadings, after being cured at 160°C for (a) 5 min and (b) 10min.
xi
Figure 4-6 XRD results of the film with the Ag2O/silver stearate
ratio of 100:4, after being cured at 160°C for 10 min.
77
Figure 4-7 SEM micrographs of the films, prepared from the pastes with the Ag2O/silver stearate ratio of (a) 100:4, (b) 100:5,
and (c) 100:6, at a solid loading of 80wt% and after being cured at 160°C for 10 min.
78
Figure 4-8 SEM cross-section micrographs of the film, prepared from the paste with the Ag2O/silver stearate ratio of
100:5 at a solid loading of 80wt% and after being cured at 160°C for 10 min.
79
Figure 4-9 TEM microstructure of film prepared from the pastes with the Ag2O/silver stearate ratio of 100:3, at a solid
loading of 80wt% and after being cured at 160°C for 10 min. amounts of 2-ethylheanoate and cured at 2500C for 10min for wide binding energy. (b) for C-C binding
80
Chapter 5
Figure 5-1 DTA analyses for pure Ag and Ag powders coated with coupling agents of (a) Zr (b) Al (c) Ti at a heating rate of 10℃ in air.
93
Figure 5-2 Weight loss of pure coupling agents of (a) Zr (b) Al (c) Ti at a heating rate of 10℃in air.
94
Figure 5-3 DTA analyses for Ag powder coated with (a) Zr, (b) Al (c) Ti coupling agents at a heating rate of 10℃ in O2
95
Figure 5-4 DTA analyses for Ag powder coated with Ti coupling agents at a heating rate of 20℃ in (a) Air and (b) N2.
96
xii
calcined at (a) 350℃ (b) 400℃ (c) 500℃ (d) 600℃ for 2 h.
Figure 5-6 Variation of volume fraction of Anatase crystal wth time. In isothermal crystallization of isopropyl tri(N-ethylenediamino) ethyl titanate precursor powders.
98
Figure 5-7 Temperature dependence of the time at which volume fraction of anatase crystal is 50% in an isothermal crystallization of titanate precursor powders.
99
Figure 5-8 Determination of the growth morphology parameter (n) in the crystallization process for titanate precursor powders.
100
Figure 5-9 Activation energy for crystallization of Ti-base coupling agents.
101
Figure 5-10 TEM images of the of the Ti-base coupling agent calcined at 375℃ for 60min (a) primary size of about 10nm (b) lattice image showing the lattice spacing of (1 0 1) is 3.61Ao .
102
Figure 5-11 TEM BF images and ED pattern of the Ti-base coupling agent calcined at 375℃ for 60min (a) BF images (b) ED pattern.
103
Chapter 6
Figure 6-1 Schematic of dielectric resonator 120
Figure 6-2 Test patterns of “T-type” microstrip resonator for silver film printed on (a) polished alumina substrate and (b) non-polished alumina substrate, resonated at 4.32 GHz.
121
Figure 6-3 SEM surface images of films prepared using low-curing-temperature MOD silver paste screen-printed
xiii
on polished substrate and fired at 250°C for (a) 10 and (c) 30 min, as well as on non-polished substrates and fired at 250°C for (b) 10 and (d) 30 min.
Figure 6-4 SEM images of cross-sections of the films shown in Fig. 6-3.
123
Figure 6-5 SEM surface images of films prepared using high-temperature silver paste screen-printed on (a) polished and (b) non-polished substrate and fired at 800°C for 10 min
124
Figure 6-6 SEM images of the cross-sections of the films shown in Fig. 6-5
125
Chapter 7
Figure 7-1 Equivalent circuit of four-ordered quasi-elliptic bandpass filter with cross coupling.
138
Figure 7-2 Simulated results of four ordered bandpass filters. 139
Figure 7-3 Four ordered bandpass filter, which has considered the impedance matching in the inverters J01 and J45.
140
Figure 7-4 Compare the responses of modified four ordered bandpass filter with the original filter with cross-coupling J14.
141
Figure 7-5(a) Fabricated cross-coupled four ordered LTCC bandpass filter. (a) 3-D structure and (b) measured and EM simulated results.
142
Figure 7-5(b) Fabricated cross-coupled four ordered LTCC bandpass filter. (a) 3-D structure and (b) measured and EM simulated results.
- 1 -
Chapter 1
Overview
Flexible electronics is emerging as a multidisciplinary research topic with far-reaching impact in a number of research areas, including flat-panel displays, organic electronics and distributed macro electronic systems and architectures. Furthermore, for the requirements of high performance, multiple functions and high production efficiency, to do the best to decrease the processing temperature and processing time and to retain the desired functional properties are essential for the development of flexible electronics.
Well conductors, such as gold, silver, copper and aluminum etc., are extensively applied in electronic devices, due to the low resistivity property. In order to process compatibly with the flexible polymer substrate, it is the grand challenge to develop the low-curing-temperature and high conductivity metal paste.
1-1. General Background
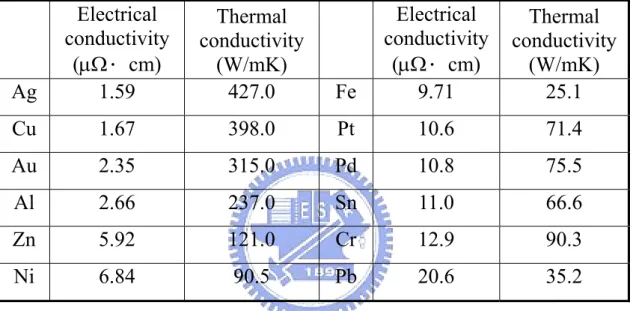
Metals are widely used because of their properties: strength, ductility, toughness, high melting point, thermal and electrical conductivity. Metal conductors (gold, silver, copper and aluminum) have good conductivity with excellent electron transmission ability for electronics industry. The pure bulk metal electrical conductivity and thermal conductivity properties were shown at Table 1-1. The metal excellent electrical conductivity can make use of any electron transmission for electronics
- 2 -
devices, such as, metal circuit, antenna pattern, inner interconnect, terminal electrode of passive component and front-end module etc. For popularity applications were inner circuit electrode and terminal electrode of capacitor, inductance and ceramic module, surface circuit of IC, and circuit pattern of antenna. Flexible electronics become the new devices tendency and direction. Products can be flexibility for collection and application were promoted the life handling convenient. For popularity products, like as, Flexible full color display, polysilicon thin film transistor, Organic filed effect transistors, organic light emitting diodes, amorphous silicon solar cell, and low cost RFID (Radio Frequency Identification).
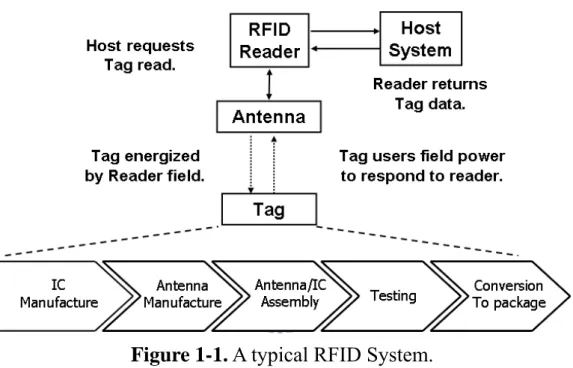
Recently, the real application of flexible electronics is RFID tags. Tags consist of antenna, IC chip and substrate. Typical dielectric substrate choices for RFID applications include polyester (PET), FR4, paper, high permittivity dielectrics, etc. For conducting materials, several choices are available, including silver paste, copper, aluminum and others. For ultra-high frequency (UHF) application, the antenna is typically a dipole design as shown in the figure. RFID tags will be used for comparison with current methodologies to elucidate the advantage of high speed roll to roll printing presses in the manufacture of electrical interconnects[1]. The low cost RFID tags are applied to logistic application by Wal-Mart, since they expect to replace UPC barcodes on consumer products, ushering in an era of enhanced consumer convenience and warehousing efficiency, though a realization of real-time price and product controls, automated inventory processes, and automated checked[2]. RFID is hitting the mainstream now for a number of reasons. There are three parts
- 3 -
of the RFID system. The tag is affixed to the item being tracked. The reader is the device that reads the tag. The third part of the system is the antennas, an important of communication between the tag and reader[3]. The system figure was shown at Figure 1-1.
An important performance criterion for RFID tag is its read range – the maximum distance at which tag can be detected. Theoretical read range can be calculated as:
th r t t P G G P D τ π λ 4 = (1.1)
where λ is the wavelength ,
Pt is the power transmitted by the reader,
Gt is the gain of the transmitting reader antenna,
τ = Re(Zc)Re(Za)/∣Zc+Za∣2 is the power transmission
coefficient (Zc is chip impedance)
Pth is the minimum threshold power necessary to power up the
chip.
It can be concluded that the tag performance depends both on material and on the shape of the antenna[4]. Silver paste is not as conductivity of copper but is inexpensive and can be printed in affordable way on flexible substrate. That is a challenge how to develop printed conductive paste to suit to high throughput for RFID tags.
Some previously investigated such as a technology, based on metallic nanoparticles. Small-diameter nanoparticles have reduced melting points relative to their bulk material counterparts. Some technology investigated such as a technology, based on polymer additions.
- 4 -
Used polymer low temperature curing to consolidate the structure and used flake metal powder to connect each other were form electrons conductivity and flexibility. The DuPont were developed the polymeric think film (PTF) for RFID tags and smart labels application. The paste has been specially developed for the printing of coils for RFID tags and for contactless smart cards and has the following key properties. This produces has 10-20 mΩ/sq at 25mm after drying and 4-8 mΩ/sq at 25μm after lamination. And can substrate compatibility at polyester, ABS, polycarbonate and paper [5].
Another conductive process way, punched aluminum offers a cheaper alternative but as it is a subtractive process it is only possible to maintain the high level of waste by the relatively low cost of aluminum. And aluminum does not offer the same conductivity as silver and products made by this technique offer interior performance.
However, materials development of metal conductivity ink was important factor for low-cost roll-to-roll process and other low temperature process of low cost technology. The Parelec Inc[6,7], innovative process provides a high yield and two-step process which printing and curing. The system that is adaptable to sheet fed or roll-to-roll printing processes. The materials are comprised of metal particles and a reactive organic medium (MOD) that volatilizes during the heating process and can cure very quickly to give a very thin highly conductive film[show at Figure 1-2]. The films can cure in 25 seconds to 5 minutes at temperature as low as 135℃ in a box oven or roll-to-roll continuous print and cure production line.
- 5 -
Technology advances in the fields of materials, printing, and electronics have led to the evolution of the field of printable electronics. Direct printing of electronic features may eliminate complex procedures employed in traditional electronics manufacturing, leading to low cost devices.
1-2. Silver paste
Metal pastes are currently used for the production of various electrical and electronic components such as solar cells, multilayer ceramic capacitors, single and multichip modules and hybrids for the automotive and aerospace industries. All these applications require finely structured conductive layers, which are usually produced with screen printing technologies, using metal powders containing print paste.
For multilayer ceramic devices, high conductivity of the internal metallization is important to reduce the dissipation factor, especially at high frequencies[8, 9]. Ag powder has a problem of shrinkage mismatch with the dielectric during co-firing because the metal film starts to sinter at lower temperatures and it rapidly becomes very dense. This shrinkage mismatch can potentially create tensile stress in the region which sinters faster and shrinks more.
It is a method for minimizing shrinkage mismatch by coating the Ag powder surface with Ti organometallic compounds. It was found that the formation of nanocrystallized titania accompanied the combustion of the organometallic compounds and was found to inhibit the densification of silver at low temperature, thus retarding sintering of the silver to a higher
- 6 -
temperature[10].
Conventionally, on the substrate, the terminal electrode by the conductive paste and the dielectric layer by the dielectric print a printing ceramic condenser in the shape of sandwiches, and it is formed. Generally this conductive paste makes powder, such as Ag, Au, Pd, Pt, Cu and Ni., the shape of paste by the glass frit and the organic vehicle, and used. Sometime the conductive paste of Ag system has added Pd, in order to lessen the solder foods crack at the time of soldering of the terminal electrode of this printing ceramic condenser product and to prevent it. The purity of metals powders that is now typically required for the production of metal pastes is not at all well-defined. In most cases, only the main metal content is analyzed, whereas the presence of trace elements is normally neglected. But trace element content, in particular, can significantly influence rheological properties and long-term storage stability of pastes. For metal powder, some parameters must be select for different applications, such as, particles size distribution, tap density, fisher sub sieve sizer, surface area, sintering losses conditions, degree of deagglomerated, and powder shape (coarse, general or flake) etc,. All of the foregoing parameters were effect the paste rheology for printing of other process conditions and phenomenon of after sintering for microstructure and physical characteristic.
The typical pastes used today are based on organic solvents such as butyl carbitol acetates, terpineol, hydrated castor oils in combination with rheological additives such as pine or fish oils. Most experts agree that in the long-term use of such solvents is inconsistent with aims to protect the environment and with the concept that ecological aspects should be
- 7 -
integrated into production procedures. Some solvent used today are based on water solvents, but general are used at low temperature or quickly curing paste, some low viscosity paste application and requirement of environmental.
Low-curing-temperature conductor technology with metallo-organic decomposition (MOD) compound additions was investigated to form a three dimensional metal network. MOD compounds are generally synthetic metallo-organic salts that can decompose completely at low temperatures to precipitate metal or oxide, depending on the metal and atmosphere[11,12].
MOD silver pastes with silver flakes substituted by Ag2O and AgO
to modify the curing conditions while retaining good electrical conductivity were analyzed. Results indicate that the silver oxides effectively catalyze the organic species. The reduced silver and the remaining Ag2O enhance the connectivity of the silver flake and thus
increase the electric conductivity of the films[11].
1-3. Analyses and Measurement Techniques
1-3-1 Thermogravimetric analysis, TGA[13]
Thermogravimetric analysis (TGA) was the study of weight changes of a specimen as a function of temperature. The technique is useful strictly for transformations involving the absorption or evolution of gases from a specimen consisting of a condensed phase. Typical TG specimen powder or liquid was placed on a refractory pan, often porcelain or
- 8 -
platinum. The pan, in the hot zone of the furnace, is suspened from a high precision balance. A thermocouple is in close proximity to the specimen but not to interface with the free float of the balance. The balance was electronically compensated so that the specimen pan does not move when the specimen gain or loss weight.
If reactive gases are passed through the specimen chamber or gases are released by the specimen, the chamber containing the balance is often maintained at a slightly more positive pressure via compressed air or inert gas; this is in order to protect the balance chamber and its associated electronic components from exposure to corrosive gases.
Sometime were shown the figure is the numerical derivative TG trace (DTG), which is a smoothed plot of the instantaneous slope of the specimen mass with respect to time. DTG does not contain any new information, however it clearly identifies the temperature at which mass loss is at maximum “the DTG peak”. Superimposed transformations, which are seen only as subtle slope changes in a TG trace appear more clearly shown as DTG peaks. Comparison of DTG data with DTA data of the same material shows striking similarity for those transformations with an associated weight change. Thus, combining DTA and DTG traces is useful for differentiating the types of transformations depicted by the DTA trace.
Thermogravimetric analysis that provide for a spell of constant temperature of a specimen once the non-steady heating is over give the most correct results. They are used to determine key physical and chemical properties of individual substances. The percentage difference was calculated as:
- 9 - % 100 ] / ) [( − ⋅ = Tf Tsp Tf p (1.2)
The results of thermogravimetric analysis cast doubts over the validity of a number of experimental investigations in which the reference temperature for the data obtained was that of the furnace space rather than the specimen temperature. Note than an intensification of heating did not lead to a proportional increase in the temperature of specimens Tsp which
leveled out at an ultimate value peculiar to every substance.
Dynamic thermal analysis of thermal decomposition was investigated by thermogravimetric analysis. Depending on the importance and goals of investigation, one may call upon various types of heaters: convective heaters, lasers, plasma gun and a whole range of burners and furnaces. The derivatographs manufactured produce TG and DTG curves, which make it possible to determine the thermal effects of decomposition, complete with the decomposition rate records ω& =ω(t).
The most common approach to describing the kinetics of isothermal decomposition is to consider it as a homogeneous one-stage chemical reaction: n k dt dω ω − = (1.3) Where, n is the reaction order; w is the weight per unit of a reacting substance; k is reaction rate constant at a given temperature; w=M/M0. By
integrating blow equation one can obtain an analytical expression describing the kinetic curves of decomposition. At n = 1:
) ( 0exp kt − =ω ω (1.4) The constant of integration, w0, is determined by the initial condition,
- 10 -
0
0 ω
ωt= = . It is not much more difficult to obtain solutions at n≠1.
One-stage chemical reaction between gases and solutions sometimes follow fairly well the empirical Arrhenius equation in relatively narrow ranges of temperature: ) / ( 0exp RT E k k = − (1.5) Where, k0 is pre-exponential factor; E is activation energy.
The equation includes the Boltzmann constant e−E/RT which has a physical meaning in rate calculations for gas-phase reactions, according to the theonection that a more elaborate temperature dependence of the rate of chemical reactions was derived from this theory [14]:
) / ( 0exp ) / ( E RT BT h k k k = − (1.6)
Where, the k0 coefficient takes account of changes in entropy and in
the number of particles produced when an activated complex is being formed which has great bearing on polymer systems.
The physical irrelevance of apparent characteristics is evident in activation energy changing with temperature and depending on the extent of conversion, pre-exponential factor is, in turn, often time-dependent and differeing from its theoretical value of 1012 s-1.
The theory of absolute rates of chemical reactions forms the groundwork of blow equation within the strict framework of rigorous limitations the most important of which are:
1. the reaction should be homogenous and occur in a gas medium;
2. the starting compound should be in equilibrium with its activated complex;
- 11 -
4. the reaction does not alter the Maxwell-Boltzmann equilibrium distribution;
Non-isothermal decomposition of solid substances fails to meet these requirements to a lesser or greater extent. It is a heterogeneous process developing at phase boundaries. This equilibrium between an initial substance and its activated complex is broken by the loss of vibration stability of oscillators in three-dimensional and liner crystals. Kinetic equations of heterogenous decomposition of solids were shown at
Table 1-2. The equations cited may describe intricate kinetic curves more
than exponential equations, yet they fall short of taking into account certain factors of nonisothermal heating such as homogeneous nucleation. The thermodynamic feasibility of such nucleation is well established and experimentally verified for metastable liquids[15].
Responding to the practical need to have simple analytical relationships for TG curves, many researchers are determined to apply equations derived for isothermal conditions to the kinetics of decomposition during monotonic heating. The KEKAM equation, which incorporated the Arrhenius law, will then become:
] ) 1 ( 1 )[ 1 )( / exp( 11/ / 1 0 n E nRT In n nk dt dα = − −α − −α − (1.7)
At constant heating rate:
) / exp( ] / [ )] 1 ( [ 1/ 2 0 / 1 nk RT bE E nRT In − n ≅ n − − α (1.8)
To describe the non-isothermal kinetics of decomposition of condensed substances, many also adopt the One-stage chemical reaction equation:
- 12 - n RT E b k dT dω ω ) / exp( ) / (− 0 − = (1.9)
The TG curves of linear polymers while quantitatively different from calculated curves are qualitatively the same at low heating rates. More complex substances such as coals and thermosets do not evince even a qualitative agreement with calculated plots at high heating rates.
1-3-2 Differential thermal analysis, DTA[13]
Differential Thermal Analysis DTA, can provide the some material information during thermal processing. The temperatures of transformations as well as the thermodynamics and kinetics of a process may be determined using DTA. The DTA information of material were glass transition, crystallization temperature, melting temperature, and any reaction about exothermic and endothermic during thermal processing.
The Differential Thermal Analysis (DTA), measures the difference in temperature between a sample and reference which are exposed to the same heating schedule via symmetric placement with respect to the furnace. The reference material is any substance, with about the same thermal mass as the sample, which undergoes no transformations in the temperature range of interest. The temperature difference between sample and reference is measured by the differential thermocouple in which one junction is in contact with the underside of the reference crucible. The sample temperature is measured via the voltage across the appropriate screw terminals and similarly for the reference temperature; generally only one or the other is recorded.
- 13 -
The material sample undergoes a transformation, the single will either absorb, means endothermic, or release, means exothermic, heat. Usually the melting of solid material will absorb heat, where that thermal energy is used to promote the phase transformation. The DTA will detect that the sample is cooler than the reference, and will indicate the transformation as the endothermic on the plot of differential temperature (∆T) versus time.
In order to analyze the differential heating curve, it is convenient to write down a formal expression for the rate at which heat is transferred into and out of the sample or reference cell.
) ( ) ( ) ( w s r s 0 s s s K T T T T T T dt dq = − +σ − +α − (1.10) ) ( ) ( ) ( w r s r r 0 r r r K T T T T T T dt dq = − +σ − +α − (1.11)
Here dq/dt is the rate at which heat is received by the reference material and sample material, respectively. Kr and Ks are heat transfer coefficients between the materials and the furnace wall. They are made as nearly identical as possible by choice of reference material and design of cell and furnace. Sigma is the heat transfer coefficient between the cells, and alpha is the heat loss to the outside environment. Tw, Tr, Ts and T0 are
the temperature of the furnace wall, reference and sample materials, and external environment, respectively.
Next use can be made of the identity
dt dT dt dH dt dH dt dq = = (1.12) For the sample it is convenient to segregate the portion of the increased heat content arising from phase change, writing
- 14 - dt df H dt dT C dt dq s s s = +Δ (1.13) Here Cs is the heat capacity of the cell plus its contents, while ∆H is
the heat of the transformation and df/dt is its time rate of occurrence under the conditions of the experiment, f being the fraction of the sample transformed at any time t.
For reaction kinetics in DTA, the temperature distribution in the differential thermal analysis specimen holders obeys the general heat flow equation. dt dq c T c k t T ρ ρ 1 2 = ∇ − ∂ ∂ (1.14)
Where T is the temperature, t the time, k the thermal conductivity, σ the density, c the specific heat, and dq/dt the rate of heat generation due to a chemical reaction per unit volume of sample. No heat effects occur in the reference sample, so the temperature distribution in the reference is given by: T c k t T = ∇2 ∂ ∂ ρ (1.15) The differential temperature is the difference in temperature of the centers of the two samples. The differential temperature, θ, is then given by reference sample k ca dt dq f ) 4 ( ) ( φρ 2 θ = − (1.16)
This equation it is seen that when d2q/dt2, the derivative of the rate of heat absorption, is zero, dθ/dt is also zero. Since the rate of heat absorption is proportional to the rate of reaction, the equation states that the peak differential deflection occurs when the reaction rate is a maximum. So the results of the differential thermal study agree with
- 15 -
results obtained isothermally except in some specific cases.
1-3-3 Stress and Strain Rheometers[16]
Rheology is the science of deformation and flow. It is a branch of physic since the most important variables come from the field of mechances: forces, deflections and velocities. All forms of shear behavior, which can be described rheologically in a scientific way, can be viewed as lying in between two extremes: the flow of idealviscous liquids on one hand and the deformation of idealelastic solids on the other. The behavior of all real materials is based on the combination of both the viscous and the elastic portion and therefore, it is called viselastic.
Rheometry is the measuring technology used to determine rheological data. The emphasis here is on measuring system, instruments and analysis methods. Both liquids and solids can be investigated using rotational and oscillatory rheometers. Viscosity curves are usually plotted with γ& on the x-axis and η on the y-axis. When measuring at shear rates
γ& < 1 1/s, it is important to ensure that the measuring point duration is long enough. This is especially true for high-viscosity samples which are tested at very low shear rates. Otherwise start effects or time-dependent transition effects are obtained, this means the transient viscosity instead of the desired steady-state viscosity is measured. When γ& >1 1/s,
transient effects only influence samples with pronounced viscoelastic properties. Therefore, for liquids with low or medium viscosities the duration of t=5 s is sufficient in most cases for each measuring point.
- 16 -
However, transient effects should always be expected for polymers at shear rates γ& < 1 1/s.
Rotational tests are performed to characterize viscous behavior and evaluated viscoeleastic behavior, creep tests, relaxation tests and oscillatory tests are performed. In all fluids, there are frictional forces between the molecules and, therefore, they display a certain flow resistance which can be measured as viscosity. The dynamic viscosity is sometimes used for η. However, many rheologists also use this term to describe either the complex viscosity measured in oscillatory tests or the real part of the complex viscosity. The inverse value of viscosity is referred to as fluidity ψ and following as:
η
ϕ[1/pas]=1/ (1.17) For rotational tests, the different types of flow behavior were presented and their rheological background was explained using, for example, Newton’s law or other viscosity functions which depend on the structure of the sample. A normal test for shear rate tests, the speed or shear rate is set and controlled. This tests method with controlled shear rate is usually selected when specific flow velocities of technical processes have to be simulated. The viscosity curves are usually poltted with γ& on the x-axis and η on the y-axis.
To know the structure decomposition and regeneration were measured by thixotropy and rheopexy which are shear rate step function test. For measurements like this, three test intervals are preset:
- 17 -
t0 and t1. The aim is to achieve a fairly constant η value for the
whole first interval, since it is then used as the reference value for the third interval;
2. Load phase under high-shear condition during the time period between t1 and t2 in order to decompose the structure of the sample;
3. Phase after removing the load under low-shear conditions during the time period between t2 and t3, under the same shear conditions as in
the first interval to facilitate regeneration of the structure.
The extent of thixotropy is given as the change in viscosity Δη, which is calculated as the difference between the maximum viscosity. Here, ηmin is taken at the time point t2 and ηmax at the point t3. The
formula were Δη=ηmax−ηmin. And the total thixotropy time is the time difference between the end of the structural decomposition phase and the time point at which the maximum value ηmax is reached after structural
regeneration. The total thixotropy time were analyzed as the period of time required for the structure to reach the state of complete regeneration in the third test interval. The testing and analysis method that flow curve with hysteresis area for determining thixotropic and rheopectic behavior were now outdated, although it is still used for QC tests in some industrial laboratories. The hysteresis area was determined by taking the difference between the following two areas: the area between the upward curve and the γ axis, and the area between the downward curve and the γ& axis. Sample with positive area value were referred to as thixotropic and those with negative values as rheopectic.
- 18 -
For viscoelastic behavior, a viscoelastic material shows viscous and elastic behavior simultaneously. For viscous portion behaves accorded to Newton’s law, and elastic portion behaves accorded to Hooke’s law. The behavior of viscoelastic liquid can be illustrated using the combination of a spring and a dashpot in serial connection. Both components can be deflected independently of each other. The extent of the reformation represents the elastic portion, and the extent of permanently remaining deformation corresponds to the viscous portion. So the deformation process is irreversible, as the sample has changed its form at the end of the process because its reformation is not complete. Therefore, the material behaves essentially as a liquid and is referred to as a viscoelastic or Maxwell liquid due to the above-mentioned properties.
For an elastic deformation you apply the Hook’s law to rheology: Shear Stress
A F =
τ , and the deformation τ =G*γ . The reasons of viscoelasticity were entanglement in polymers and structure or network of an emulsion. Always used the oscillation test to give the extension of the measuring range, non destructive methode, and analyses data of the material structure and monitoring of time or temperature-depending changes. The oscillation were used the change of direction for input shear stress τ then give the elastic reaction for deformation γ and 00 phase shift for elastic response or 900 viscous response. Separation in elastic and viscous components was:
] sin ) cos( cos ) [sin( ) sin( 0 0 ω δ γ ω δ ω δ γ γ = t− = t − t (1.18)
- 19 - " ' * G iG G = = + γ τ (1.19) The G’ is storage modulus to define:
δ
cos ' G*
G = (1.20) And G” is loss modulus to define:
δ
sin " G*
G = (1.21) The oscillatory test included some methods as simple oscillation, time curve for ageing, curing and gelation, and sweep experiment for frequency, amplitude and temperature, and preshear oscillation for structure recovery, and multiwave for monitoring material changes. The stress sweep test was determination of the linear-visco-elastic range for material stability and yield point. The G’ and G” are independent from stress or deformation. All stress sweeps can be presented either as function of stress or strain. For material stability, the critical stress from the stress sweep is used as characteristic value. The frequency sweep was investigated materials response to impact or gradual load and usually applied at material condition, impact resistance, damping properties and mouth feeling. The frequency sweep was obtained the material characterization of gel, paste and liquid material structure. Usually the behaviors were obtained the viscous at low frequency and elastic at high frequency.
Moreover, the time temperature sweeps were observed of change of material properties due to different initiators for material aging, gelation, fusion, curing, crosslinking and degradation. The multiple creep tests were see the slope value deviating from zero and applied for leveling, sagging and stability. Modeling test was described the material functions
- 20 -
as mathematical equation. Relaxation test was known the non linear equations incorporate coefficients, which are known as relaxation times.
- 21 -
Reference
1. D. Lochun, E. Zeira and R. Menize., Electronic Components and Technology Conference., (2002).
2. S. Molesa, D. R. Redinger, D. C. Huang, and V. Subramanian., Mat. Res. Soc. Symp. Proc., 769, (2003).
3. J. Kabachinski., Biomedical Instrumentation and Technology., March/April, (2005).
4. Pavel V. Nikitin et al “Low cost silver ink RFID Tag Antennas” IEEE 2005,p.353~356.
5. DuPont’s registered trademark.
6. P. H. Kydd: PCT pattern WO 98/37133 (1998). 7. P. H. Kydd: U. S. Patent 6036889 (2000).
8. Herbert J M 1985 Ceramic Dielectrics and Capacitors (Electrocomponent Science Monographs vol 6) (New York: Gordon and Breach)
9. NoorlanderW 1978 Some aspects of multilayer ceramic chip capacitors for hybrid circuits Electrocomponent Sci. Technol.5 33–40 10. Chi-Jen Shih, Shao-Ju Shih, Hong-Ching Lin, Hsin-Hsien Yeh and
Ying-Chang Hung “Thermal-decomposition and crystallization behaviour of coupling agents for silver paste application” Nanotechnology 14 (2003) 1014–1018
11. C. A. Lu, P. Lin, H. C. Lin, and S. F. Wang: Jpn. J. Appl. Phys. 45 (2006) 6987.
12. C. A. Lu, P. Lin, H. C. Lin, and S. F. Wang: Jpn. J. Appl. Phys. 46 (2007) 251.
- 22 -
Component. Package. Manuf. Tech. B., 19(2) (1996).
14. S. Glasstone, K. Leidler, and G. Ecring., The Theory of Rate Processes., IL, Moscow., 1948.
15. V. P. Skripov, E. N. Sinitsyn., Termophysical properties of liquids in a metastable state., Moscow, Atomizdat, 1980, 208p.
- 23 -
Table 1-1. Metal electrical conductivity and thermal conductivity
properties Electrical conductivity (μΩ∙cm) Thermal conductivity (W/mK) Electrical conductivity (μΩ∙cm) Thermal conductivity (W/mK) Ag 1.59 427.0 Fe 9.71 25.1 Cu 1.67 398.0 Pt 10.6 71.4 Au 2.35 315.0 Pd 10.8 75.5 Al 2.66 237.0 Sn 11.0 66.6 Zn 5.92 121.0 Cr 12.9 90.3 Ni 6.84 90.5 Pb 20.6 35.2
- 24 -
Table 1-2. Kinetic equations of heterogenous decomposition of solids
Basic Factors Function
Two-dimensional motion of an interface Three-dimensional motion of an interface Linear diffusion
Three-dimensional diffusion Prout-Tompkins’ mechanism Avrami-Erofeev’s mechanism
Ultimate decomposition temperature Tu1
2 / 1 ) 1 ( −α 3 / 2 ) 1 ( −α 1/2α ] ) 1 ( 1 [ 2 / ) 1 ( 3 −α 2/3 − −α 1/3 ) 1 ( α α − ] ) 1 ( )[ 1 ( −α −In −α 1−1/n )] / 1 / 1 /( exp[ ) 1 ( −α A T − Tu1+Δ
- 25 -
- 26 -
Figure 1-2. The diagram of Parelec Inc innovative 2-step low curing and
- 27 -
Chapter 2
Experiment
2-1. Mixing Process of Paste
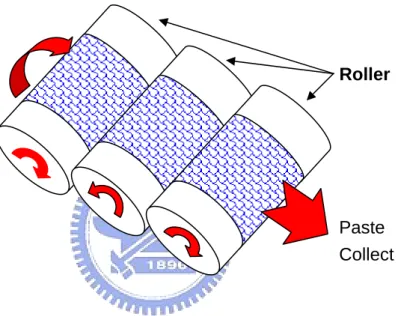
The various pastes mixtures, solvent, metal powder and Metallo-organic were mixed by high speed mixer (Thinky Mixer, Japan) for 3 min and then de-bubbled for 1min. The high speed mixer structures were shown at Figure 2-1. Subsequently, uniform pastes were formed through a triple roller grinding (EXERT, Germany), which causes breaking down of the pigment agglomerates. The triple roller grinding structures were shown at Figure 2-2.
2-2. Printing Process
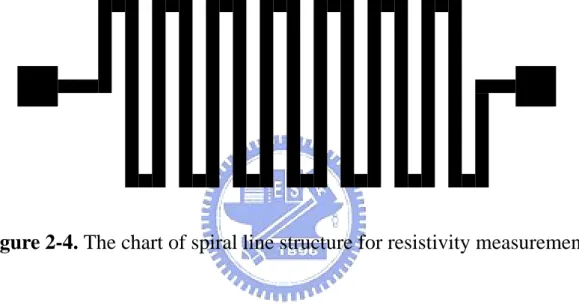
The paste were screen-printed on alumina substrate as spiral lines and then thermally treated at a range of temperatures, according to the results of thermal study described above. The chart of screen-printing was shown at Figure 2-3. The dimension of screen-printed spiral silver metal lines are specifically controlled at the length of 216 cm, the line wide of 0.8mm and the line thickness of 20~40μm to promote the accuracy of the electrical measurement. The spiral line structure and printing results photo was shown at Figure 2-4 and Figure 2-5.
- 28 -
2-3. Thermal Analyses
The TG trace were derivatively calculated to identify the thermal decompose temperatures at which the mass loss of the paste is at a maximum. In this research, Termo-gravimetry analyzer (TGA) from Perkin-Elmer was used. Also, the TGA were performed at different heating rates including 2°C /min, 5°C /min, 10°C /min, 20°C /min and 40°C /min, in order to evaluate the activation energy. The decomposition activation energy Ea was calculated using the following formula form
Doyle-Ozawa [1]: constant ) ( 4567 . 0 log − = − m a RT E
φ
(2.1)φ is the heating rates (dt/dT) of the measurement and Tm is the thermal
decompose temperature of the paste measured.
2-4. Electrical Measurement
Keithely 2400 multimeter with a four-point probe was used to measure the bulk resistance of curing silver paste. The resistivity of the silver conducting line curied at the different temperature was calculated using the relationship of:
l
d
w
R
)
/
(
⋅
⋅
=
ρ
. (2.2)R is the silver conducting line bulk resistance measured
- 29 -
line
And the high-frequency surface resistances were determined using the TE011-mode dielectric resonator, which was designed by Krupka2) and
manufactured by QWED (QWED Inc., Poland), as indicated in Figure
2-6. To evaluate the Q-factor due to parasitic losses, the dielectric loss
tangents of the substrate and dielectric resonator have to be known. The dielectric loss tangent of the substrate was measured by the split-post dielectric resonator method [3]. A BZT dielectric resonator of 17 mm diameter and of 8 mm height was used in this study. The measurement frequency ranged between 4 and 5 GHz. The electric energy filling factor and geometric factor were rigorously computed using the Rayleigh-Ritz method [4].
- 30 -
Reference
1. C. D. Doyle, “Kinetic Analysis of Thermogravimetric Data,” J. Appl.
Polym. Sci., 285 (1961).
2. J. Krupka, IEEE MTT-S Int. Symp. Dig., 2007, p. 515.
3. J. Krupka, R. G. Geyer, J. B. Jarvis, and J. Ceremuga: DMMA’ 96
Conf., Bath, U.K. 23-26 Sept. 1996, p. 21.
4. J. Barker-Jarvis, M. D. Janezic, B. Riddle, C. Holloway, N. G. Paulter,
- 31 -
- 32 -
Figure 2-2. The mechanism of triple roller grinding structures. Roller
Paste Collect
- 33 -
- 34 -
- 35 -
- 36 -
Figure 2-6Schematic of dielectric resonator
Metal Film
BZT Dielectric Resonator Al2O3 Substrate
Cu Cavity
- 37 -
Chapter 3
Effects of Silver Oxalate Additions on the Physical
Characteristics of Low-Temperature-Curing MOD Silver Paste
for Thick Film Applications
In this Chapter, the effect of silver oxalate addition on physical characteristics of metallo-organic-decomposition (MOD) silver screen-printable paste for thick film technology was investigated. The addition of silver oxalate in the paste not only produces fresh fine silver particles after curing, but also reduces the decomposition temperature of the lubricant coated on the silver flakes. This is an effective route to provide fine silver particles to the paste without significantly changing the rheological behavior. At the curing temperature of 225
°
C, the resistivity decreases from 180.1 to 31.9μΩ
-cm, as the silver oxalate content increases from 0 to 10 wt%. This is due to the fact that active silver catalysts produced increase the packing density of silver flakes, and also the removal of lubricant from the surface of silver flakes enhances the electron conduction, thereby decreasing the resistivity of film.38
-3-1 Introduction
Recently, technologies of common electrical appliances have been tremendously interested in the development of low-cost disposable microelectronic devices on flexible substrates, such as radio frequency identification (RFID) tags, smart cards, and other similar items. In the field of material science, metallizations used for the bonding of devices to the substrate and the interconnections between devices are an important part of the material applications, because they have to provide necessary electrical conduction, wetting on the substrate and structure support. Materials with a high electrical conductivity and a low-temperature and high-speed process were generally required for many flexible electronic applications [1,2]. Among various processing methods, screen printing, electro-photographic printing and ink-jet printing have commonly been used to form precise electrically-conductive patterns by depositing metal particles onto an insulating substrate surface.
Typically, fabricating a conductive layer on substrates requires temperatures less than 350°C for polyimide substrates, 290°C for printed circuit boards (PCBs), and 200°C for other plastics, to prevent any softening or wrapping. Conventional low temperature electrically conductive adhesives (ECA) have several limitations such as relatively low electrical conductivity and unstable contact resistance. Resistivity of the conductive layer such as silver on the substrate is usually 10-50 times that of pure silver, due to the presence of binding organics, which results in more power consumption and signal loss and thus decreasing
39
-transmission distance during signal -transmission. These shortcomings can be resolved by the use of metallo-organic decomposition (MOD) technology. High conductivity can be achieved at a low temperature by decomposing metallo-organic compounds on various substrates, where the molecular nature of the compounds allows low temperature of conversion to the metal. The MOD-metal flake mixtures have been applied by screen printing [3,4,5] and ink-jet printing process [6,7]. R.W. Vest and coworkers successfully applied ink jet printing system with silver neodecanoate MOD ink for hybrid microcircuits [8]. Recently, very low curing temperature silver inks for used in ink-jet printing were reported [6,7]. The resistivity values of the printed conductive films composed of nano-silver particles were found to have dropped to two or three times the theoretical resisitivity of the bulk silver after heat-treatment at 150°C. The ink-jet printable inks usually have a solid loading of less than 20 wt%, binder content of less than 3 wt% and viscosity of less than 10 cps.
Also, patent literatures have further revealed the technology of MOD combined with metal flake in screen-printable thick film metallizations and terminations, which are then built up with solder or electroplating [3,4]. These techniques have used silver metallo-organic compounds, such as silver neodecanoate MOD compound, with the addition of silver flakes to immobilize it during melting and decomposition. The MOD-metal flake mixture maintains its configuration during heating, and will decompose to form a well-bonded, well-resolved conductor at a temperature compatible to polymer based circuit board substrates. The electrical conductivity is equal to that obtained by conventional thick film
40
-conductors sintered at high temperatures (>700°C).
A previous study [5] indicated that silver 2-ethylhexanoate (C8H15O2Ag) possesses a very low decomposition temperature (190.3°C)
among the MOD agents, and it forms silver particles to promote linking among silver flake particles. A low-curing-temperature silver paste with 5 wt% silver 2-ethylhexanoate addition for thick-film applications possesses shear-thinning and thixotropic properties. A resistivity of 7.8x10⁻⁶ Ω-cm for screen-printed films was obtained after being cured at 250°C for 30 min, which is close to the bulk resistivity of silver [9]. In this study, attempts to modify the curing conditions of MOD silver screen-printable pastes through the addition of silver flakes by silver oxalate (Ag2C2O4) were made. The effect of silver oxalate addition on the
thermal properties, rheological behavior and curing conditions of the MOD silver paste were investigated. The microstructure and resistivities of screen-printed films on alumina substrate after being thermally treated were characterized and discussed.
41
-3-2 Experiment Procedure
The low-temperature-curing silver pastes used in this study were prepared from silver flake (Ferro, U.S.A.), silver oxalate (Ag2C2O4, Rose
Scientific Ltd., Alberta, Canada), metallo-organic compound of silver 2-ethylhexanoate (STREM, MA, U.S.A.), and solvent of α-terpineol (TCI, Japan). All materials were mixed by a high-speed mixer (Thinky Mixer) for 3 min and de-bubbled for 1min. Subsequently, uniform pastes were formed using a triple-roller grinder (EXERT, Germany), which causes the breakdown of pigment agglomerates. The weight ratio of silver flake powder and silver 2-ethylhexanoate to solvent was fixed at 81:4:15 (Table I). Also, 1, 3, 5, 10 wt% of the silver oxalate were added, in order to reduce the curing temperature while still retaining a good conductivity of the resultant film. The silver oxalate powders have average particle size (d50) of 1.7 μm as measured by light scattering (HORIBA LA-910).
In order to understand the thermal behavior, the thermogravimetry analysis (TGA; Perkin-Elmer) and differential thermal analysis (DTA; Perkin-Elmer 7) were performed in air at a heating rate of 10°C/min on the pastes as well as pure MOD silver 2-ethylhexanoate and pure silver oxalate. The rheological behaviors of the pastes were explored using a controlled-shear-stress rheometer (HAAKE RS150) with a plate-plate measuring system (35 mm diameter, 0.5 mm gap).
Spiral silver metal lines with a length (l) of 216 cm, a line width (w) of 0.8mm and a line thickness (d) of 20~40 μm were screen-printed on alumina substrate for the resistivity measurement. A Keithely 2400
42
-multimeter with a four-point probe was used to measure the bulk resistance of cured silver paste. The resistivity of the silver conducting line cured at various temperatures was calculated using the relationship
l d w R )/ ( ⋅ ⋅ =
ρ , in which R is the resistance of the spiral. The microstructures of the films cured at various temperatures and holding times were investigated using a field-emission scanning electron microscope (SEM; JEOL-6500F, Tokyo, Japan).
43
-3-3 Results and Discussion
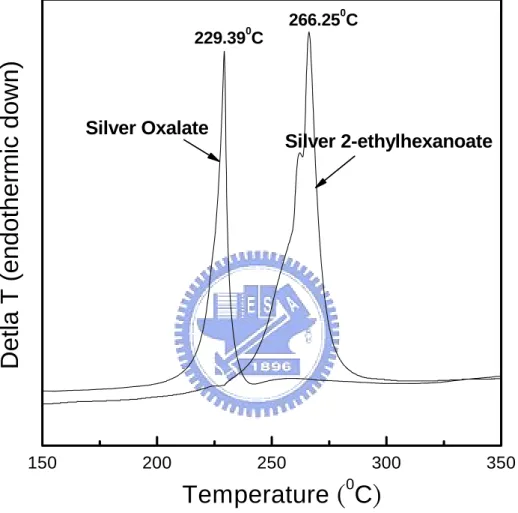
Figure 3-1 shows the DTA curves for pure MOD silver
2-ethylhexanoate and pure silver oxalate. The thermal decomposition of silver oxalate occurs at a lower temperature than that of silver 2-ethylhexanoate. It manifests that both reactions are exothermic, which generates a relative large amount of heat. The silver oxalate shows an exothermic peak at 229.39°C and the silver 2-ethylhexanoate at 266.25°C. The reactions are as follows:
AgC8H15O2 +
(
43/4)
O2 ⎯⎯→ Ag +8CO2 +(
15/2)
H2O (3.1) 2 4 2 2C O 2Ag 2CO Ag ⎯⎯→ + (3.2)Previous study revealed that the thermal treatment of C8H15O2Ag
results in the formation of various organic species including CH3, CO, O2,
CH2CO, CO2, C4H9, CH5COOH, C5H10O, etc., depending on the
temperature and the atmosphere [9]. On the other hand, thermal decomposition of the silver oxalate is different from most oxalates that usually decompose to form a metal carbonate or a metal oxide. It gives rise to silver as the solid product and CO2 as the gaseous product [10].
The decomposition of the silver oxalate produces nearly 71 wt% of fine silver catalyst, which is certainly a good silver source among various MOD compounds. When the silver 2-ethylhexanoate or silver oxalate was mixed with solvent α-terpineol, the former is soluble in the solvent, but the latter is not. Previous study has shown that the decomposition temperatures of silver 2-ethylhexanoate or silver oxalate in α-terpineol
44
-are reduced to 190.3 and 212.14°C, respectively [5].
Figure 3-2 shows the results of the thermogravimetric analysis
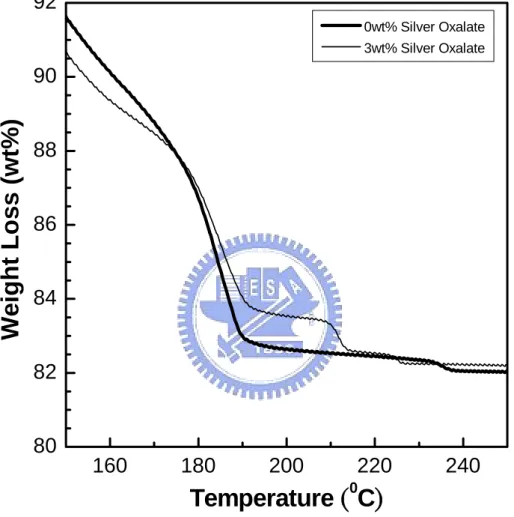
(TGA) for the pastes without and with 3 wt% silver oxalate added in air. For the paste without silver oxalate added, the decompositions of the α-terpineol and silver 2-ethylhexanoate lead to a weight loss of ≈17.26 wt% at temperatures below 190°C. There is a weight loss of ≈0.3% observed at ≈235°C, which corresponds to the decomposition of the lubricant, fatty acid, coated on the silver flakes. For the paste with 3 wt% silver oxalate added, there are three weight drops as the temperature increases from room temperature to 300°C. Weight loss of ≈16.76 wt% occurs at temperatures below 190°C due to the decompositions of α-terpineol and silver 2-ethylhexanoate, ≈0.87 wt% at ≈210°C resulting from the decomposition of silver oxalate, and ≈0.3% at ≈222°C associated with removal of lubricant from the surfaces of silver flakes. The weight losses observed are relatively consistent with the theoretical values calculated from the paste formulations and the chemical formula of the compounds. The results verify that the addition of the silver oxalate not only produces fresh fine silver particles, but also reduces the decomposition temperature of the lubricant coated on the silver flakes.
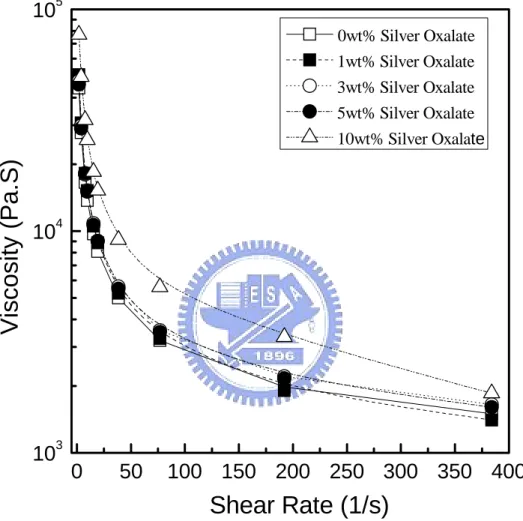
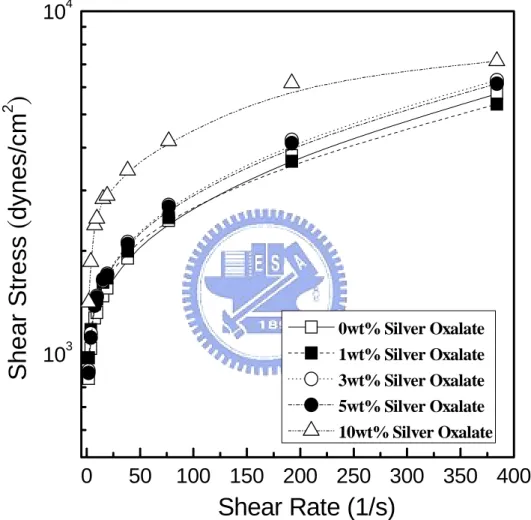
Rheological characteristics of the pastes with various amounts of silver oxalate added are shown in Figure 3-3. It indicates that all pastes have pseudoplastic flow (shear-thinning) property [Figure 3-3(a)]. The solid loading of the paste increases with the silver oxalate content since it is not soluble in the α-terpineol. However, the viscosity of the paste only slightly increases with the content of silver oxalate. Figure 3-3(b) indicates that all pastes possess pseudoplastic flow property with an
![Figure 1-2. The diagram of Parelec Inc innovative 2-step low curing and roll-to-roll printing metal ink process [6].,](https://thumb-ap.123doks.com/thumbv2/9libinfo/8141383.166688/42.892.136.797.399.714/figure-diagram-parelec-innovative-curing-printing-metal-process.webp)