行政院國家科學委員會專題研究計畫 成果報告
台灣中高齡就業者漸進式退休行為之研究
研究成果報告(精簡版)
計 畫 類 別 : 個別型 計 畫 編 號 : NSC 97-2410-H-004-013- 執 行 期 間 : 97 年 08 月 01 日至 98 年 10 月 31 日 執 行 單 位 : 國立政治大學經濟學系 計 畫 主 持 人 : 陳鎮洲 計畫參與人員: 博士班研究生-兼任助理人員:莊晉祥 報 告 附 件 : 出席國際會議研究心得報告及發表論文 處 理 方 式 : 本計畫涉及專利或其他智慧財產權,2 年後可公開查詢中 華 民 國 99 年 01 月 13 日
行政院國家科學委員會補助專題研究計畫
; 成 果 報 告
□期中進度報告
(台灣中高齡就業者漸進式退休行為之研究)
計畫類別:; 個別型計畫 □ 整合型計畫
計畫編號:NSC 97-2410-H-004-013
執行期間: 97 年 8 月 1 日至 98 年 10 月 30 日
計畫主持人:陳鎮洲
共同主持人:
計畫參與人員: 莊晉祥
成果報告類型(依經費核定清單規定繳交):;精簡報告 □完整報告
本成果報告包括以下應繳交之附件:
□赴國外出差或研習心得報告一份
□赴大陸地區出差或研習心得報告一份
;出席國際學術會議心得報告及發表之論文各一份
□國際合作研究計畫國外研究報告書一份
處理方式:除產學合作研究計畫、提升產業技術及人才培育研究計畫、
列管計畫及下列情形者外,得立即公開查詢
□涉及專利或其他智慧財產權,□一年;二年後可公開查詢
執行單位:
附件一Phased Retirement for Older Workers: The Case of Taiwan
Jennjou Chen Department of Economics National Chengchi University
Abstract
Retirement of older workers is an important policy issue that has received considerable public attention. Traditionally, older workers’ retirement decisions are viewed as a dichotomous choice between full-time work and full-time leisure. People either work full-time, or they retire fully. In particular, there were many older workers who chose part-time jobs as bridge jobs, before full retirement, i.e. the so-called phased retirement. In this project, I empirically examine older workers’ retirement patterns, and study the factors which might affect their choices toward phased retirement in Taiwan.
This project begins with examination of data from 1989, 1993, 1996, 1999, and 2003 Survey of Health and Living Status of the Elderly in Taiwan (SHLSE), to study patterns of older workers’ job transition before full retirement. Next, this project studies what variables are most closely associated with older workers’ shift to part-time jobs. For instance, what are the variables most closely associated with the probability that older workers shift from full-time to part-time at the same job? Also, what are the variables associated with the probability that older workers shift from full-time to a part-time job elsewhere? What role is played by older workers’ demographic characteristics (i.e. gender, age, and marital status), financial incentives (i.e. type of pension(s) and other pension characteristics), and wages? As part of this research, this project would examine whether part-time work with a new employer and part-time work with the existing full-time employer are different phenomena.
We find that the majority of older workers just retire their career jobs, and it is 61%. In addition, the proportion of older workers who work part-time inside jobs is much greater than the proportion for part-time outside jobs, which about 15 to 1. Also, there are only 4.5% of the older workers who choose to work full-time outside jobs. Finally, there are still 18.1% of the older workers who still work on their career jobs.
Based on the results from the multinomial logit model, we found that most coefficients are not significant different from zero. We believe that it is due to the small sample size of this analysis data set.
I. Introduction
Retirement of older workers is an important policy issue that has received considerable
public attention. Traditionally, older workers’ retirement decisions are viewed as a dichotomous
choice between full-time work and full-time leisure. People either work full-time, or they retire
fully. But, Quinn, Burkhauser, and Myers (1990) challenged this view; they used the Retirement
History Survey data to establish that older workers in fact took several different paths from their
full-time career jobs on their way to full retirement in the United States during the 1970s. In
particular, there were many older workers who chose part-time jobs as bridge jobs before full
retirement, i.e. the so-called phased retirement. Interestingly, however, these part-time jobs often
involve a move to a new employer rather than remaining with the original full-time employer.
Friedberg (1999) and Chen (2004) both observed similar findings during the 1990s. In this
project, I empirically examine older workers’ retirement patterns, and study the factors which
might affect their choices toward phased retirement in Taiwan.
There are several reasons why this might be an important and interesting topic. First, by
examining the most recent available data of Taiwan, we can determine whether older Taiwanese
workers have job transition patterns similar to the ones found in the United States. In particular, it
would be interesting to know the extent to which older workers are taking up part-time jobs after
exiting their full-time career jobs. And, do most of them have to move to a new employer?
Second, if we find that older workers do move to part-time work in other firms in Taiwan, it
would be something of a puzzle. If the highest and the best of a person’s skills are to be used by
the same employer for many more years, then it is reasonable to expect that the best part-time job
for that person would most likely be with the same employer. Third, there may be social benefits
from an enhanced understanding of why older workers rarely move from full-time to part-time
within the firms they have served for a long time. If older workers want part-time jobs and do not
stay with their long-term employers, they cannot utilize their specific human capital, which can
presumably make them more useful and productive for their current employers than in other firms.
This situation may imply that there are potential efficiency gains to be derived from enhanced
This project begins with examination of data from 1989, 1993, 1996, 1999, and 2003 Survey
of Health and Living Status of the Elderly in Taiwan (SHLSE), to study patterns of older workers’
job transition before full retirement. In particular, it would be interesting to know the extent to
which older workers are taking up part-time jobs after exiting their full-time career jobs. Next,
this project studies what variables are most closely associated with older workers’ shift to
part-time jobs. For instance, what are the variables most closely associated with the probability
that older workers shift from full-time to part-time at the same job? Also, what are the variables
associated with the probability that older workers shift from full-time to a part-time job elsewhere?
What role is played by older workers’ demographic characteristics (i.e. gender, age, education
and marital status), financial incentives (i.e. type of pension(s) and other pension characteristics),
and wages? As part of this research, this project would examine whether part-time work with a
new employer and part-time work with the existing full-time employer are different phenomena.
II. Literature
Traditionally, transitions toward full retirement do not play an important role in the study of
retirement. Most researchers consider retirement as dichotomous: an older worker is either
working full-time, or is fully retired. There is no gray area(s) or transitional state(s) between an
older worker’s full-time career job and retirement. Part of the reason for this may be because, in
the past, many older workers retired directly from their full-time career jobs and never considered
other possible alternatives (like a part-time job) as transition jobs before full retirement.
However, this trend might have changed. For example, Gustman and Steinmeier (1984, 1985)
find that more and more older workers take part-time jobs as a “bridge” to full retirement in the
United States. This trend has emerged in other countries as well (see Laczko, 1988; Latulippe and
Turner, 2000; Lei and Genevieve, 1996). Also, the tendency toward more part-time older workers
might in fact delay the retirement age of the old in the future (Friedberg, 1999; Quinn, 1997).
However, most of these studies do not treat working part-time at career jobs separately from
working part-time jobs elsewhere. They usually consider both kinds of part-time jobs as one
category; they do not, or cannot, answer the question why many of part-time transition jobs are
taken up with firms other than those where a worker had his/her career job.
the issue of part-time jobs inside (i.e. switch to part-time within career jobs) and outside (i.e. take
up a part-time job elsewhere). It uses data from the Retirement History Survey to document the
patterns of older workers’ switch to part-time jobs as transition toward retirement in the 1970s. It
also examines the correlation between transition patterns and many individual characteristics like
health, education, pension status, industry and occupation, and wage. Furthermore, it points out
that different types of employer-provided pension plans could be the major factor affecting an
older worker’s choice between part-time inside and part-time outside. For example, it suspects
that many older workers, who are entitled to defined benefits under pension plans, stand to lose
some of their pension benefits when they opt for part-time inside jobs. So, more part-time outside
jobs than part-time inside jobs are observed in the Retirement History Survey. Besides, Chen
(2004) finds similar job transition patterns in the United States during the 1990s.
Due to the limitation of available data for older workers, only a few empirical studies have
been conducted on retirement in Taiwan. 何淑熙 (2003) used the 1996 Survey of Health and
Living Status of the Elderly in Taiwan to study older workers’ retirement behavior. The author
estimated two duration models and the major findings were: age, gender (female), number of kids,
and bad health have positive effect on the probability of retirement. Also, people with pension
benefits, and with low income, are more likely to retire. 黃俐菁、單驥、蔡萬春 (2007) discusses
the factors which affect workers’ expected retirement ages, and finds that family structure plays
an important role in workers’ choices. Indeed, none of these works deals with the transition
between a full-time career job and full retirement.
III. Economic Theory and Statistical Models
When workers approach their retirement age, when/how to retire definitely becomes an
important decision to be made by them. Many older workers express an interest in gradually
reducing work hours for some years and then becoming fully retired (Chen, 2004). Working
fewer hours and staying with the same firm is not always a feasible option for many older
workers. It could be that the current employer-provided financial packages for phased retirement
are not attractive or there is no phased retirement arrangement at all. In general, wage and
older workers to stay and work part-time, they could just pay an unattractive part-time wage to
current older workers or even make no wage offer at all.
There are some dissimilarities between inside and outside part-time jobs could exist. First,
the size of the firm could play an important role in this. In general, larger firms could be more
flexible in offering part-time work opportunities for their current employees since these firms
have more job positions and could be more likely than smaller firms to find ways to
accommodate part-time positions.
Second, different employer-provided pension plans could have different effects older
workers’ part-time inside and outside choices. In particular, individuals with defined benefit
pension plans could be more likely to move to an outside firm than individuals with defined
contribution pension plans. This is true because, as a general rule, older workers need to leave
their current firm in order to start collecting their pension benefits when their pension plan is a
defined benefit plan. Also, the last years of the wages usually have large weights on the pension
benefits among most of the defined benefits pension plans. So, a move to part-time schedule
would severely hurt an older worker’s pension benefits when the type of pension is defined
benefit. On the other hand, defined contribution plans could be more neutral on older workers’
inside and outside choices, since the pension benefits stay the same whether the older workers
move outside or stay inside. Therefore, two testable hypotheses are drawn from the discussion of
part-time inside and outside job differences: larger firms are more likely to offer part-time inside
jobs, and defined benefit pension plans encourage older workers to move to part-time outside
jobs.
We consider that old workers can choose among different possible states:
(1) Part-time Inside (PI): work part-time at career jobs,
(2) Part-time Outside (PO): work part-time at different jobs,
(3) Full-time Inside (FI): work full-time at career jobs,
(4) Full-time Outside (PO): work full-time at different jobs, and
(5) Out-of-Labor-Force (OLF): not work at all.
Let us consider a five-choice model (with full-time inside, full-time outside, part-time inside,
FT inside (FI) indirect utility: Ui,FI = Zi,FI γFI + ηi,FI (1’) FT outside (FO) indirect utility: Ui,FO = Zi,FO γFO + ηi,FO (2’) PT inside (PI) indirect utility: Ui,PI = Zi,PI γPI + ηi,PI (3’) PT outside (PO) indirect utility: Ui,PO = Zi,PO γPO + ηi,PO (4’) Out of labor force (OLF) indirect utility: Ui,OLF = Zi,OLF γOLF + ηi,OLF (5’) Ui,. is the individal i’s utility from working either full-time inside/outside, part-time inside/outside, or out of labor force, Zi,. are the covariates, γ. are coefficients, and ηi. are structure disturbances.
The vector Zi contains variables which affect worker i’s job transition decision such as
non-wage income, wealth, pension characteristics, part-time job opportunity, potential pension
benefits, etc. Basically, an older worker has to choose a job status that gives him/her the highest
utility among options (1’) to (5’). For example, if working full-time inside produces the highest
utility for individual i, i.e. Ui,FI > max{Ui,FO, Ui,PI, Ui,FO, Ui,OLF}, then individual i will choose to work full-time inside. A multinomial logit model is used to estimate the γ’s
IV. Data
The Survey of Health and Living Status of the Elderly in Taiwan (SHLSE) is the primary data
source for this project. The SHLSE is a national representative panel study which contains rich
information about older people’s retirement decisions, health status, family structure,
employment history, and housing. The SHLSE collected its first wave data in 1989, and
subsequently repeated the exercise almost every three years or so. There were over 4,049
individuals in the initial wave of the 1989 sample. All respondents were 60 years or older in 1989.
All respondents have been re-interviewed almost every three years, since their first interview in
1989. Thus, there are five waves of SHLSE data available (i.e. 1989, 1993, 1996, 1999, and
2003).
The focus of this study is on the transitions that older workers make when exiting their
full-time career jobs. Thus, only individuals who had career jobs in the first wave are kept in the
sample. A career job is defined as working full-time with at least 10 years of job tenure. In the
data set, we found that there are 928 individuals with career jobs. These older workers have at
followed in later years, until they moved out of their full-time career jobs. Then, the choices
made at the time of retirement from full-time career jobs were recorded.
There are many variables which could potentially explain older workers’ retirement choices.
For example, SHLSE has fairly rich information about individuals’ wages, health status and
health insurance coverage, pension information, job characteristics (i.e. firm size, industry,
occupation), and individual and family characteristics (age, gender, education, marital status,
number of children, family income and wealth).
V. Results
First, we find that the majority of older workers just retire their career jobs, and it is 61%. In
addition, the proportion of older workers who work part-time inside jobs is much greater than
part-time outside jobs, which about 15 to 1. Also, there are only 4.5% of the older workers who
choose to work full-time outside jobs. Finally, there are still 18.1% of the older workers who still
work on their career jobs.
Based on the results from the multinomial logit model, we found that most coefficients are
not significant different from zero. There are two potential explanations. First, it could be that the
analysis data set has a small sample size, so the estimates are not precise. Second, individual’s
pension information is limited in this data set. And, without a good control of these pension
References
1. 黃俐菁、單驥、蔡萬春(2007),個人因素及家庭結構對個人預期退休年齡之影響,手
稿。
2. 何淑熙(2003),台灣退休決策行為之實證研究,《臺灣經濟金融月刊》,87-97。
3. Chen, J., (2004), “Part-time Labor Markets for Older Workers,” Dissertation, Cornell
University, USA.
4. Friedberg, L., (1999), “The Trend Towards Part-Time Work Among Older Workers,” working
paper, UCSD and NBER.
5. Gustman, A., and T. Steinmeier, (1984), “Partial Retirement and the Analysis of Retirement
Behavior,” Industrial and Labor Relations Review, 37, 403-15.
6. Gustman, A., and T. Steinmeier, (1985), “The Partial Retirement on Wage Profiles of Older
Workers,” Industrial Relations, 24, 257-65.
7. Laczko, F., (1988), “Partial retirement: An alternative to early retirement? A comparison of
phased retirement schemes in the United Kingdom, France and Scandinavia,” in International Social Security Review (Geneva), 41, 149-169.
8. Latulippe, D. and J. Turner, (2000), “Partial retirement and pension policy in industrialized
countries,” International Labour Review, 139, 179-195.
9. Lei, D. and R. Genevieve (eds.), (1996), “Gradual retirement in the OECD countries: Macro
and micro issues and policies,” Dartmouth Publishing Co.
10. Quinn, J., (1997), “The role of bridge jobs in the retirement patterns of older Americans in the
1990s,” in Philip R. de Jong and Theodore R. Marmor (eds.): Social policy and the labour market, Ashgate Publishing Ltd., 91-116.
11. Quinn, J., Burkhauser, R., and Myers, D., 1990, "Passing the Torch, The Influence of
Economic Incentives on Work and Retirement," Kalamazoo: W. E. Upjohn Institute for Employment Research.
表 Y04
行政院國家科學委員會補助國內專家學者出席國際學術會議報告
98 年 5 月 5 日 報告人姓名 陳鎮洲 服務機構 及職稱 政治大學經濟學系,助理教授 時間 會議 地點 98 年 4 月 30 日至 5 月 2 日 底特律,美國 本會核定 補助文號 臺會綜二字第 0980014860 號 會議 名稱 (中文) 2009 美洲人口學會年會(英文) Population Association of America 2009 Annual Meeting 發表
論文 題目
(中文) 高階主管與性別歧視:以台灣為例
(英文) Gender Discrimination Among Taiwanese Top Executives 報告內容應包括下列各項: 一、參加會議經過 本人在本次大會所發表的論文被安排在會議的第三天。除了於大會發表論文之外, 本人並參與及聆聽許多論文的發表,收穫頗豐。 二、與會心得 本年會是人口學界每年最主要的國際學術會議之一。每一次的年會,都有許多重量 級的人口、社會、以及經濟學者參與大會,在本次會議中亦不例外,本人亦從相關 的會議論文中受益頗豐。 三、考察參觀活動(無是項活動者省略) 無。 四、建議 無。 五、攜回資料名稱及內容 會議日程表 1 份。 六、其他 無 附件三
Gender Discrimination Among Taiwanese Top Executives
Tzu-I Wang
Department of Economics National Chengchi University
Taipei City, Taiwan 95258006@nccu.edu.tw
And
Jennjou Chen* Department of Economics National Chengchi University
Taipei City, Taiwan jennjou@nccu.edu.tw
Abstract: Gender discrimination in labor markets has been an important issue in labor
economics. The main propose of this paper is to empirically study the ‘glass ceiling effects’, and investigate whether female workers are in deed being discriminated against, particularly during the promotion process, at the top management positions in Taiwan. This paper uses data from 4,485 large firms in Taiwan to study whether there are gender preferences when the chairperson of a company chooses a chief executive officer (CEO). The data shows that there are few female top executives (about 6%). In addition, a chairperson tends to team with same sex CEOs, and it is especially noticeable among female chairpersons in the data. Besides, the empirical results from our random matching model further confirm that gender is neither irrelevant nor neutral when a chairperson names a CEO.
Keywords: gender discrimination, glass ceiling, CEO
JEL code: J71
*
Ⅰ. Introduction
Previous studies about gender discrimination in labor markets have mainly focused
on gender wage differentials, occupation segregations, and glass ceiling effects, among
others. Glass ceiling effects refer to constraints and limitations that are usually not
apparent but keep women from being fairly promoted. The main propose of this paper is
to study the glass ceiling effects, and empirically investigate whether female workers
are in deed discriminated against during promotion process, particularly at the top
management positions, in Taiwan. We want to find out whether female workers have the
same opportunities of being promoted to top positions as male workers have. In other
words, can gender be an element that affects the probability for women to be promoted
as top executives?
Researchers have employed different empirical models and methods to identify and
find evidence to support the existence of the so-called glass ceiling in labor markets.
Typically, they either compare gender wage gaps at the high-end of wage distribution,
or examine the gaps between prospects or outcomes of promotions for men and women.
For example, Albrecht et al. (2003) use Swedish national representative data sets, and
employ quantile regression approaches to study glass ceiling effects. They show that
glass ceilings do exist at the top end of wage distribution.
In terms of prospects or outcomes of promotions, Cannings (1988) found that
gender does influence the chance of being promoted when career-relevant factors, such
as formal education and firm specific productivity, are held constant. The author also
found that female workers’ promotion rate is only about 80% of that of males in a given
year. Besides, Landau (1995) used a sample of 1,268 managerial and professional
employees’ self-reporting questionnaires, which showed the promotion potential of
women was rated lower than of men. Blank (1996) and McDowell et al. (1999) both
found that promotion prospects for female academics are lower than those of their
to statistically examine the effects of gender discrimination and role congruence in
managerial advancement. Their findings support the view that the managerial
advancement process is different between women and men.
In this paper, we study whether gender could be an element that affects the
possibilities for women to be promoted as top executives in companies. Being promoted
to chairperson of the board of directors (we call it chairperson hereinafter) or chief
executive officer (we call it CEO hereinafter) is considered as the ultimate career goal
for most people. McCue (1996) indicated that within firm mobility is an important
source of wage growth for an average full-time worker, accounting for roughly
one-sixth of wage growth in the entire life cycle. In addition to the higher wages and
greater power that promotions imply, recognition of previous performance by the
company is even more important for an employee (Chang, 1993). Therefore, being
promoted as a top executive not only means higher benefits and status but also
recognition of past performance. Obviously, competition (for promotion) is very fierce,
and actual promotions do give us the opportunity to study the real gender biases on part
of companies while appointing a chairperson or a CEO.
Team spirit in a company can greatly influence its performance in many ways.
Many studies have focused on how the leadership structure of both the chairperson and
the CEO affect the performance of a company (see Jensen, 1993, Goyal and Park, 2002,
and Brickley et al., 1997 for more details). But, according to our knowledge, there are
only a few papers that have studied how gender composition of chairman and CEO
teams affects team spirit or performance of companies. For example, Ivanova-Stenzel
and Kübler (2005) used a real-effort experiment to investigate the relevance of gender
for the optimal composition of a team. It found that gender composition of teams affects
productivity, and women perform worse in mixed-gender teams, while women perform
three top journals in economics, and analyzed the role of gender preferences in team
formation. This paper uses the concept of Boschini and Sjögren (2007), which models
team formation as a random matching process influenced by agents’ preferences for
team size and gender, to examine the teamship of top executives of companies in
Taiwan.
Instead of collecting data from a small number of firms and conducting a case
study, this paper uses information from thousands of large companies in Taiwan. The
large size of the sample makes it possible to compare compositions of teams of top
executives in different companies, controlling for industries, firm sizes, established
years and geographical locations of companies.
The remainder of this paper is organized as follows. In the next section a
theoretical model is introduced, and then the data are examined in Section Ⅲ. The
matching model is applied and empirical results are reported in section Ⅳ. Section Ⅴ
offers conclusions.
Ⅱ. The Model
The model used in this paper is based on that of Boschini and Sjögren (2007), and
for the purpose of simplicity and comparison, the notations too are similar. Suppose a
chairperson has to choose and name one of many aspirants as the CEO of the company.
In the pool of potential CEO candidates, φC is the fraction of females, and −φC
1 is
the fraction of males. In addition, φP represents the fraction of female chairpersons in all companies, and 1−φP is the fraction of male chairpersons. During the matching process, there are two groups of agents in this model (i.e. the group of potential CEOs,
and the group of all chairpersons). Boschini and Sjögren (2007) considered only one
group of agents (i.e. all authors) in their random matching model. Thus, the following
equations will have slightly different expressions.
Every chairperson decides whether to hire a CEO or not. U is used to denote the ia utility of the chairperson cooperating with different team types, i indicates the gender of
Figure: 1 Classification of observed groups
the chairperson, i.e. i∈
{
Male, Female}
, while different team types are shown by a, and{
S M C}
a∈ , , . The details can be written as:
S: One person team. The chairperson him/herself is also CEO.
M: Mixed team. The chairperson hires an opposite sex CEO.
C: Same sex team. The chairperson hires a same sex CEO.
There are different perceptions of outcome of teamwork. We assume that some
chairpersons always rank teamwork higher than working alone. This fraction is μi, and
}
{
Male Femalei∈ , . On the other hand, σi means the proportion of gender i that
Male
(1-φ)
Female
ψ
i
μ
--gender i, i∈{Male, Female}, who prefers team-work.i
σ
-- gender i, i∈{Male, Female}, who prefers to work alone. ik
-- gender i, i∈{Male, Female}, who chooses team types depends on the performance. iv
-- gender i, i∈{Male, Female}, who is gender neutral.m
v
m
k
f
σ
f
k
m
μ
f
μ
m
σ
fv
1- mv
1- fv
always rank single-working higher than teamwork. Consequently, ki = 1−μi −σi is the number of chairpersons who view the outcome as a more important consideration
than the team type. In terms of gender preference, v denotes the fraction of gender i i who are gender neutral, and (1−vi) are those who have gender preferences. Further, v i is assumed independent of μi and σi. Figure 1 summarizes the above notations, and depicts the classification of the observed groups.
Based on the model structure, we can compute several probabilities for different
team types under random matching assumptions. First, if both the chairperson and the
CEO of the company are female, the probability is:
P
( )
Cf =φPφC(1−σf)2. (1) Equation (1) shows the probability of a female chairperson cooperating with a femaleCEO. On the right side of the equation, we use φPand φCto denote the proportion of
female chairpersons and CEOs in each group, respectively. The term
(
1−σf)
2 means that none of them prefers working alone.The same idea can be applied to the probability of a male chairperson cooperating
with a male CEO, which is:
P
( )
Cm =(
1−φP)(
1−φC)
(1−σm)2. (2)(
−φP)
1 denotes the fraction of male chairpersons and
(
1−φC)
denotes the fraction of male CEOs. The last term,(
1−σm)
2, denotes both the male chairperson and the male CEO willing to work with others.Equation (3) describes the probability of a mixed team, which means the
chairperson cooperates with an opposite sex CEO, i.e. a male chairperson teams with a
female CEO or a female chairperson works with a male CEO.
( )
M =[
(
1−φP)
φC +φP(
1−φC)
]
(
μf +kfvf)
(
μm +kmvm)
P (3)
female CEO
[
(
1−φP)
φC]
or a firm having a female chairperson and a male CEO(
)
[
−φC φP]
1 . The last term,
(
μf +kfvf)
(
μm+kmvm)
, represents the probability of both teaming up with others, or both not having any particular team preference and beinggender neutral at the same time.
Another possibility is that the chairperson is also named the CEO of the company,
which may imply that he/she does not want to have close cooperation with another
person. Or, at least one of the two (chairperson and the CEO) has a gender preference,
i.e. they don’t like to team with an opposite sex colleague. The probability of the same
person being the chairperson and the CEO is (Equation 4):
( )
Sf =φPφC[
1−(
1−σf)
]
+φP(
1−φC)
[
1−(
μf +kfvf)
(
μm +kmvm)
]
P 2 (4)
In Equation (4), the first part shows that both the chairperson and the CEO are female
(i.e. φPφC ), and at least one of them does not like to work with others (i.e.
(
)
[
2]
1
1− −σf ). The second part depicts that either the chairperson or the CEO likes to
work alone, or has gender preference (i.e.φP
(
1−φC) (
[
1− μf +kfvf)
(
μm+kmvm)
]
). A similar case in a situation when both the chairperson and the CEO are male, is describedin Equation (5).
P
( )
Sm =(
1−φP)(
1−φC)
[
1−(
1−σm)
2]
+(
1−φP)
φC[
1−(
μm +kmvm)
(
μf +kfvf)
]
(5) Next, several conditional probabilities are computed by using equations (1)-(5).First, the conditional probability of a female chairperson to name a female CEO is given
in Equation (6). P
(
FC f)
P( ) ( )
CPf σf φC φ 2 1− = = (6) The term FC (female CEO) is used to describe a team of a female chairperson and afemale CEO. From the definition of conditional probability, the numerator means that a
Therefore, with the proportion of female chairpersons as the denominator (i.e. φP), the conditional probability of a female chairperson cooperating with a female CEO can be
calculated as in (6).
The probability of a male chairperson cooperating with a female CEO is similar to
the above case, described in Equation (7):
(
)
(
)
(
(
)
)
(
)
(
)
(
)
C m m m f f f P f f f m m m C P v k v k v k v k m FC P μ μ φ φ μ μ φ φ + + = − + + − = 1 1 (7)In addition, the probability of the same person being the chairperson and the CEO
of a company is considered as a single team (S). The probability that a male chairperson
himself functions as the CEO is as follows (Equation 8):
( )
(
( )
)
(
) (
[
)
(
)
(
)
]
C m m m f f f m m m P m k v k v S P m S P σ σ σ μ μ φ φ = − + − − + + − = 2 1 2 1 (8)In Equation (8), the numerator is the probability of a male chairperson working alone
(i.e. P(Sm) (see Equation (5) for details). The fraction of male chairpersons is the
denominator. The case for females is as in Equation (9), and it works the same way as
Equation (8).
( )
( )
[
(
)
(
)
]
(
)
(
)
(
)
[
]
C f m m m f f f m m m f f f P f v k v k v k v k S P f φ σ μ μ μ μ φ 2 1 1 S P − − + + + + + − = = (9)Equations (6)-(9) are all linear in φC and they can be reorganized into the following simple forms:
(
)
( )
S C i i C FC i i S P i FC P φ β α φ β + = =where αi , βiFC and βiS are determined by parameters given in equations (6)-(9).
We found that the probability of a chairperson co-working with a female CEO increases
conjunction with equations (6) to (9) introduced above, two hypotheses are formulated.
Proposition 1: Gender Irrelevance
. 0 , , , , 1 , , = = = = = = = = = = S m S f m f FC m FC f m f m f m f and shown be can which formation team for irrelevent is gender v v and If β β α α β β μ μ μ σ σ σ
The proof can be found in Appendix 1. Since team preferences (σ and μ) of both sexes
are the same and gender preferences (v) are also the same, gender would not be
considered as an important element here, which means gender is irrelevant in this
proposition.
Proposition 2: Gender Neutral
. , , , 1 , f m m f mFC fFC m f mS fS m
f and v v then implies that and
If σ σ σ σ β β α α β β > < < > > < < > = = ≠
The proof of this can also be found in Appendix 1. Gender neutrality (vf =vm =1) and different preferences (σf ≠σm ) of team formation of the two sexes are assumed in Proposition 2. It allows gender neutrality to be sustained even when team preferences of
the two genders are different. For example, we might observe that female chairpersons
have a higher propensity to cooperate with female CEOs than males (i.e. βmFC <βfFC), and the gender neutrality hypothesis (vf =vm =1) can still hold if men are more likely to work alone than women (i.e.σm >σf ).
Based on these two propositions, we will first test whether there is difference of the
partnership between chairman and chairwoman. And, if there is a difference, the single
team type can then be tested in order to find support for the gender neutral hypothesis.
Ⅲ. The Data
Data used in this paper is from “Top5000: The Largest Corporations in Taiwan”,
which is published by China Credit Information Service, Ltd., in June every year. The
more than 60 million NT dollars (about 2 million US dollars) in case of manufacturing
companies, or had assets of more than 30 million NT dollars (about 1 million US
dollars), in case of services companies. Of the total, 5,183 questionnaires were returned.
Besides the information in returned questionnaires, the source publication also links
companies to their financial data from Taiwan Stock Exchange Corporation. There are
4,857 companies included in the composite ranking. Several companies were found to
have missing values, or had unrecognized information. So finally the total number of
companies we use is 4,485. In the analysis data set, the main variables are the composite
rankings of companies, names of chairpersons and CEOs, established years, zip code,
and industry code. Genders of chairpersons and CEOs are identified by their Chinese
first names.
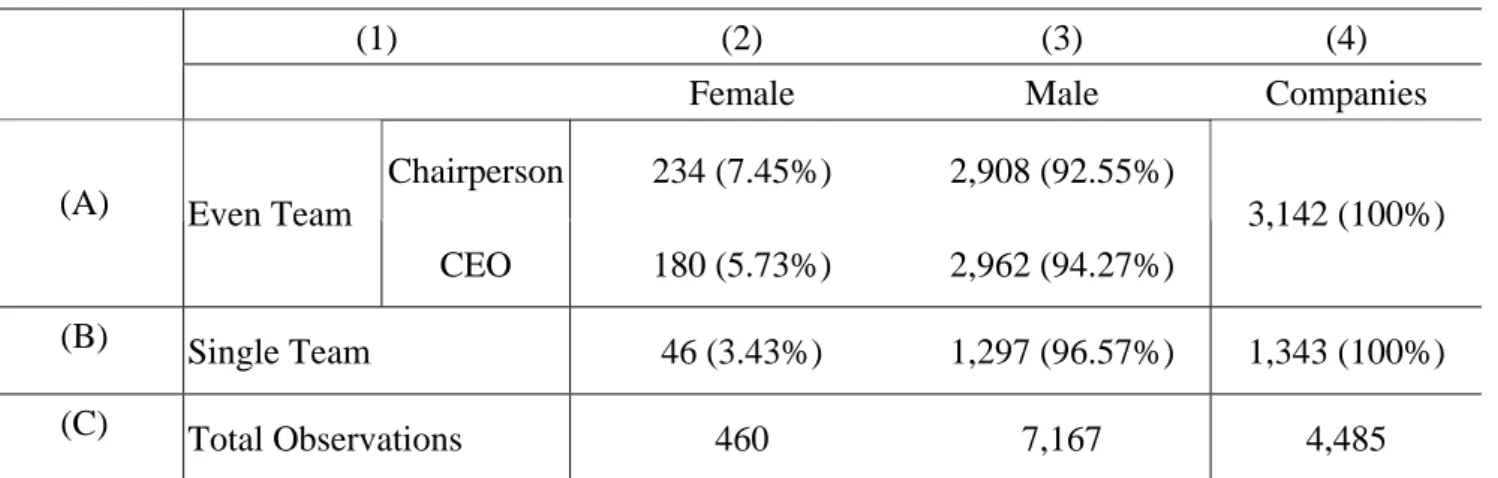
Chairpersons and CEOs of companies in the data are sorted by gender as shown in
Table 1. Column 1 shows companies are sorted into even and single teams. A company
with an even team is one which has different persons functioning as chairperson and
CEO, while a company with a single team is one which has the same person holding
both posts. Column 2 shows the number of female top executives corresponding to the
team type, and Column 3 is the number of male top executives. Column (4) is the
number of companies corresponding to the team types.
Row (A) presents the gender composition of chairpersons and CEOs in even teams.
There are 3,142 companies that have different persons as chairperson and CEO. Row (B)
presents the gender composition of single teams in 1,343 companies covered in this data
set. The sum of each column is shown in Row (C). It is found the total number of
females observed is 460, and the total number of males is 7,167, in 4,485 companies
covered by the data used for this paper.
We find that female top executives are relatively scarce in Taiwan. In Table 1, the
percentage in the parenthesis is the share calculated by rows: females’ share in
3.43%. It is found that in both even and single teams, males dominate. The proportion
of female and male workers is perhaps fairly equal at the entry level of labor markets.
Then why at the top end, the ratio of females and males plunges to 1:16? Besides, there
are fewer female CEOs than chairpersons. This makes one wonder whether there might
be a gender preference among female chairpersons while hiring a CEO.
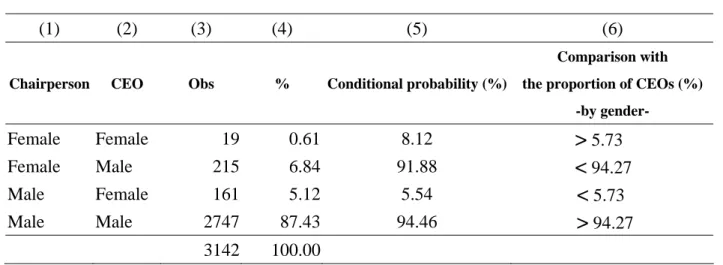
Next, Table 2 examines gender compositions of even teams only. There are 3,142
of them. In 1st and 2nd columns, four types of gender compositions of teams
(chairperson + CEO) are shown:
1. A female chairperson and a female CEO,
2. A female chairperson and a male CEO,
3. A male chairperson and a female CEO, and
4. A male chairperson and a male CEO.
In 3rd and 4th columns, it shows the number and percentages of companies
corresponding to different team types. In the 5th column, conditional probabilities are
calculated, i.e. P (Gender of CEOi | Gender of Chairmani). For example, the conditional
probability that a given female chairperson chooses a female CEO is 19 divided by 234
(the total number of female chairpersons = 19 + 215), which equals 8.12%, i.e.
P(Female CEOi | Female Chairpersoni) = 8.12%
234 19 ) ( ) ( = = = = ∩ = f president P f CEO f president P .
The conditional probability of a male chairperson choosing a female CEO is 161
divided by 2,908 (the total number of male chairpersons = 161 + 2747), which equals
5.54%.
The 6th column is used for comparison, which has the proportions of CEOs by
gender, in Table 1. It can be seen that team types that have female CEOs (in 2nd column)
are to be compared with 5.73%, which is the proportion of female CEOs in Table 1.
Also, team types with male CEOs are compared with the proportion of male CEOs in
randomly from a pool of CEOs, then he/she has a 5.73% chance of choosing a female
CEO, and there is a 94.27% chance of choosing a male CEO. Through the comparison
mechanism, Table 2 shows that female chairpersons have a relatively higher tendency to
have female CEOs (8.12% > 5.73%), and a lower propensity to have male CEOs
(91.8% < 94.27%). In contrast, male chairpersons have a relatively higher tendency to
name a male as CEO (94.46% > 94.27%), and a lower tendency to have a female CEO
(5.54% < 5.73%). The comparison suggests that gender preferences might exist in
composition of top executive teams, but the disparity is not very distinct, especially in
case of male chairpersons.
Using the available information in the data set, we also sort the companies by their
industry code, firm size, established years, and geographic locations. After controlling
for these firm characteristics, we find similar results as in tables 1 and 2: female
chairpersons and female CEOs are the minority among top executives, and female
chairpersons show a relatively higher tendency to have same sex CEOs, than male
chairpersons do, in most of the classifications. Details of the statistics are available on
request.
. Empirical Results Ⅳ
In this section, an empirical model is introduced to test whether the gender
irrelevance and neutral hypotheses are sustained. The structure of the empirical model is
based on that of Boschini and Sjögren (2007). The probit method is applied.
YijFC*= 'X ijFC β +εijFC (10) YijS*= X'ijS β +εijS (11)
Where YijFC* and YijS * are unobserved variables. Equation (10) denotes a
chairperson’s tendency to cooperate with a female CEO while Equation (11) denotes a
outcome in Equation (10) is a binary variable: if YijFC*>0 (i.e. the chairperson of i company in j industry cooperates with a female CEO), then YijFC =1, otherwise
FC ij
Y =0. The observed outcome variable in Equation (11) is also a binary variable: if
0 *
YijS > (i.e. the chairperson and the CEO of i company in j industry is the same person), then YijS =1, otherwise YijS=0.
Both equations share the same explanatory variables. The 1st explanatory variable is the sex of the chairperson, f . If the chairperson of company i is female, then i f =1, i otherwise f =0. The 2i nd explanatory variable is the share of female CEOs in j industry,
ij
φ . There are three different industry classifications used in this paper: SCP, MCP and
ACP. The first industry classification is SCP (Simple index of female CEO proportion).
All companies are divided into 5 different industries, which are manufacture, service,
banking and finance, public enterprises and private universities. We then compute the
female CEO proportion in each of the five industries.
The second industry classification is MCP (Main index of CEO proportion). The
main difference between MCP and SCP is that the industries are divided into 41 sub
groups, and the representative industry code is chosen by the main product of a
company. Representative industry codes are used to calculate the proportion of female
CEOs.
The third industry classification is ACP (Average index of CEO proportion), and
it also uses the same 41 industry codes as MCP. But, since each company may not be
listed for only one industry code, the number of corresponding female CEOs is
calculated on a weighted basis. For example, if a company reports 3 different industry
codes, it will be counted in all the three industries.
and the share of female CEOs in the company’s industry, fiφij. The 4th explanatory
variable is a dummy variable of regions, i.e. the location of a company, POST . If i i company is located in north Taiwan, then POSTi=1, if a company is located in non-north
Taiwan, then POSTi=0. The 5th explanatory variable is a dummy variable of established
years of a company, EST . They are divided by intervals of 10 years into four groups. i The benchmark of the established years is a company which was established less than
10 years ago. The 6th explanatory variable is the size of a company, SIZE . The firm i
size is based on the net sales of the company, which means the higher is a company’s
sales revenue, the bigger the company is. Firm sizes are divided into five levels.
Based on the results in the model section, the first step is to test the gender
neutrality, i.e. to check whether female and male chairpersons have different attitudes
towards teaming up with female CEOs. The key coefficient in this step is β3FC of
Equation (10). Second, the single team tendency is examined, which can provide further
support for the gender neutrality hypothesis. β1S and
S
3
β of Equation (11) are two
key coefficients that need to be estimated.
C F
3
β is the coefficient of the interaction term of the chairperson’s sex ( f ) and the i
share of female CEOs (φij). If β3FCis statistically significantly different from zero, then
it can be inferred that female and male chairpersons do have different attitudes towards
the gender of CEOs, when forming a team. In other words, if the coefficient is
insignificant, then it suggests that gender irrelevance might be true.
S
1
β is the coefficient of the chairperson’s sex ( f ) in Equation (11). If it is i
statistically significantly different from zero, then it can be concluded that the gender of
chairpersons does influence the decision to have a single team. β3S is the coefficient of
(11), which is used to test whether there is a difference between genders in deciding to
form a single team, when the share of female CEOs is taken into account. If these two
coefficients are not consistent to the previous model’s expectations, then the gender
neutral hypothesis will not be sustained.
Estimation results of equations (10) and (11) are in tables 3 and 4. Three sets of
independent variables are used:
(1) Chairperson’s sex ( f ) for firm i and share of female CEOs (i φij) in industry j
are included as explanatory variables.
(2) In addition to the variables in (1), an interaction term of chairperson’s sex and
share of female CEOs ( fiφij) is added.
(3) In addition to (1) and (2), region (POST ), established years (i EST ) and firm i size (SIZE ) are included. i
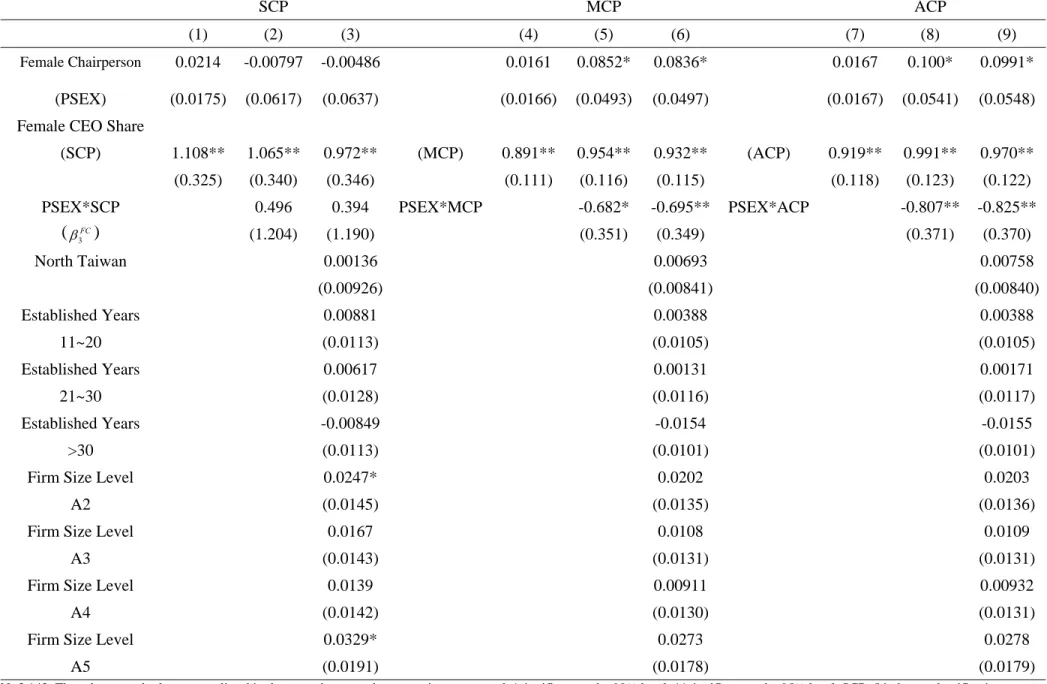
Table 3 shows the estimates of Equation (10), which are used to test the tendency
of chairpersons of different sexes to opt for a female CEO. The total number of
companies used in the estimation is 3,142, since single team companies are excluded.
The table has three parts: columns (1), (2) and (3) use the same index of female CEO
share, which is SCP, and columns (4), (5) and (6) are estimations using the MCP index as the share of female CEOs, while columns (7), (8) and (9) use the ACP index instead.
Coefficients of the first explanatory variable, female chairperson (PSEX), is
positive and statistically significantly different from zero at the 90% level in columns
(5), (6), (8) and (9), which means female chairpersons tend to work with female CEOs
under classifications of both MCP and ACP. The second explanatory variable, the
female CEO share, is positive and statistically significantly different from zero in all estimations. It can be inferred that as the female CEO share increases, the number of
chairpersons willing to team with female CEOs also increases.
female CEO share. Coefficients under the indices of MCP and ACP are negative and statistically significantly different from zero at 90% and 95% levels, respectively. This
implies that when the female CEO share increases, a female chairperson has a lower
tendency to cooperate with female CEOs, than male chairpersons.
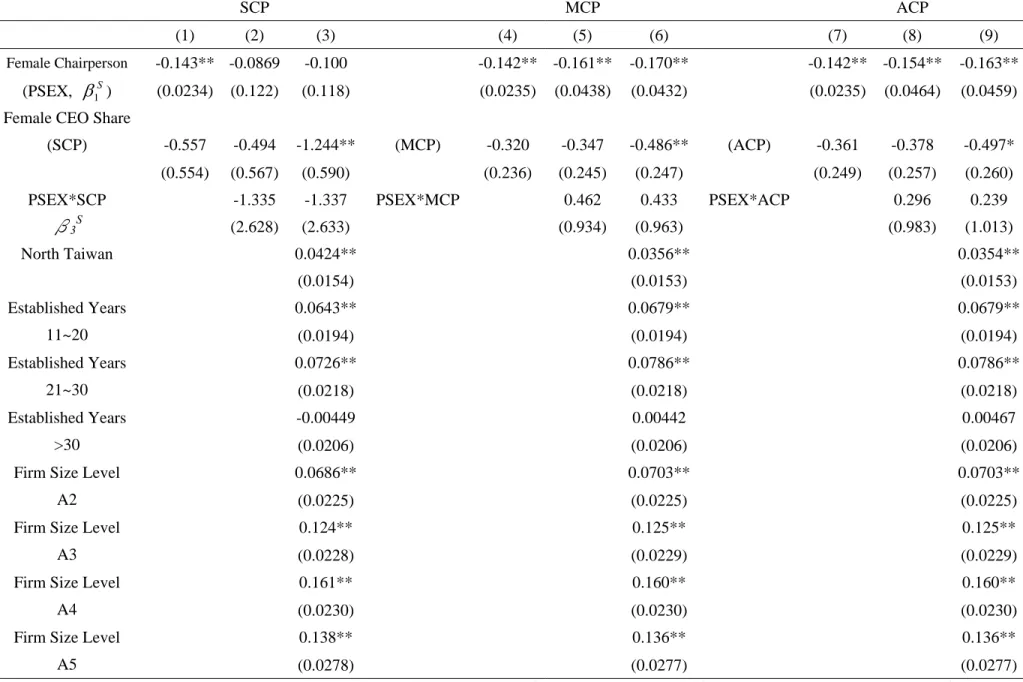
Next, the results of estimations of Equation (11) are shown in Table 4. The layout
of Table 4 is the same as that of Table 3, since explanatory variables of single team
estimations are the same as those of female teams estimations. All observed companies
are used for single team estimation in Table 4; there are 4,485 companies.
From the first row of Table 4, coefficients of female chairpersons are negative and
statistically significantly different from zero at 95% level in seven out of nine columns,
which means female chairpersons have lower possibilities of working alone than male
chairpersons. Coefficients of the explanatory variable, female CEO share, are negative
and statistically significant in columns (3), (6) and (9), which means that as the share of
female CEOs increases, the number of companies that opt for a single team decreases.
However, the interaction term of the female chairperson and the female CEO share is
insignificant in all estimations. Thus, there is no conclusive information about how the
female CEOs share can influence the different genders of chairpersons who opt for a
single team.
Combining the estimation results and the two propositions derived in the model
section, the gender irrelevant hypothesis is first examined. It is found that coefficients of
the interaction term β3FC<0, which implies β <FCf βmFC. Thus, the gender irrelevant
hypothesis is failed. Second, coefficients of single team are examined with coefficients
of female chairpersons β1S< 0, which shows that female chairpersons have a lower
tendency to form a single team than male chairpersons. However, coefficient of the
interaction term of female chairpersons and female CEOs share, β3S, is insignificant.
Since the gender neutral hypothesis is sustained only when β1S>0 and
S
3
satisfied, the gender neutral hypothesis is also failed.
. Conclusions Ⅴ
Wage differential and occupation segregation are often considered as the main
issues of gender discrimination in labor markets. Since women now receive higher
education and have more choices, i.e. other than being housewives only, seriousness of
wage gap and occupation segregation is decreasing. However, the promotion process
and standards are still not the same and fair for female and male workers.
In this paper, data from the 2006 edition of “Top5000: The Largest Corporations in
Taiwan”, published by China Credit Information Service, Ltd. is used to investigate
whether there are gender preferences when a chairperson names a CEO. The total
number of companies is 4,485. The team formation process is assumed as random
matching, which is similar to Boschini and Sjögren (2007).
First, based on the descriptive statistics in the data section, there are only a few
female chairpersons and CEOs in these top companies, i.e. about 6%. We also found
that chairpersons have a higher tendency to work with same sex CEOs. This means
there is gender gap in teamship choices between male and female chairpersons. Second,
based on the results of the estimations, both the gender irrelevant hypothesis and gender
neutral hypothesis in the random matching model are not sustained by the estimated
coefficients of equations (10) and (11).
Notice that the empirical test suggests that a female chairperson has a lower
tendency to cooperate with a female CEO than a male chairperson, when the female
CEO share increases in some industry segments. Promoting a candidate as CEO may be a complex decision, especially in a big company. A chairperson needs to consider many
aspects, such as opinions of company’s senior managers and the relationship between
the competitors and future CEOs. Therefore, female chairpersons may face more
different perspectives, especially in female dominated industries.
For further study, there are a few issues that could be considered. First, more
characteristics of companies could be taken into account, such as family-controlled
firms, i.e. whether the standard of promotion is based on employees’ performance or
blood relationship. Second, board of directors’ characteristics might also help explain
the choice of CEOs. For example, the gender ratio and the age structure of the boards
Appendix (1)
Proof of Propositions
(1) Proposition 1--Gender Irrelevance
. 0 , , , , 1 , = = = = = = = = = = S m S f m f FC m FC f m f m f m f and shown be can which formation team for irrelevent is gender v v and If β β α α β β μ μ μ σ σ σ
Using the assumption of proposition 1, the relevant coefficients are derived:
(
)
(
)
(
)
(
)
(
)
(
)
[
]
(
)
(
)
(
)
(
)
(
)
[
]
[
(
)
(
)
(
)
]
S m m m m f f f m f m m m f f f S f m m m m m m f f f f FTM m m m m f f f f FYM f v k v k v k v k v k v k v k v k β μ μ σ σ μ μ β α σ σ σ σ μ μ α β μ μ σ σ β = + + − − = = − − + + = ⇒ = − = − = + + − = ⇒ = + + = − = − = ⇒ 2 2 2 2 1 0 1 2 2 1 1 1(2) Proposition 2—Gender Neutral
. , , , 1 , S f S m f m FC f FC m f m m f m f and that implies then v v and If β β α α β β σ σ σ σ > < < > > < < > = = ≠
Using the assumption of proposition 2, the relevant coefficients are derived:
(
)
(
)
(
)
(
)
(
)
(
)
[
(
)
(
)
]
(
)
(
)
(
)
[
]
[
(
)
(
)
(
)
]
(
)
(
) (
)
[
]
[
(
)
(
)
(
)
]
S f f m f m m f m f m m m m f f f m S m f f f m m m m f f f m m m FTM f f m f m m m f f f FTM m v k v k v k v k v k v k β σ σ σ σ σ σ σ σ σ μ μ σ β α σ σ σ μ μ σ σ α β σ σ σ μ μ β = − − − − = − − − − ≤ − − − − = + + − − = ⇒ = + − = + + − ≥ − = ⇒ = − ≤ − − = + + = ⇒ 2 2 2 2 2 1 1 1 1 1 1 1 1 1 1 ) 1 ( 1 2 1 1 1References
1. Albrecht, James, Björklund, Anders and Susan Vroman, 2003. Is There a Glass Ceiling in Sweden? Journal of Labor Economics. 21: 145-77.
2. Blau, Francine D. and Lawrence M. Kahn. 2000. Gender Differences in Pay. The Journal of Economic Perspectives. 14:75-99.
3. Boschini , Anne and Anna Sjögren. 2007. Is Team Formation Gender Neutral? Evidence from Coauthorship Patterns. Journal of Labor Economics. 25: 325-65. 4. Cannings, Kathy. 1988. Managerial Promotion: the effects of socialization,
specialization, and gender. Industrial and Labor Relation Review. 42:77-88.
5. Chang, Chin-fen. 1993. Determinants and Expectation of Workers’ Promotion: The Applicability of Propositions of Internal Labor Markets. Journal of Social Sciences and Philosophy. 6: 205-30.
6. Hsu, Mei and Been-Lon Chen and Jiun-Der Fang. 2006. The Effects of Industrial Structure and Sex Discrimination on Changes in Female and Male Wage Differential in Taiwan 1978-2003. Academia Economic Papers. 34: 505-39
7. Hung, Yu-Shen. 1996. A Study of the Transformation of Female Employment and the Differentials between Female and Male in Taiwan’s Service Industry. MasterThesis of the department of Labor Relations of National Chung Cheng University.
8. Kao, Charng. 1991. Male-Female Wage Differentials in Taiwan--A Human Capital Approach. The National Chengchi University Journal. 62: 71-108.
9. Konrad, Alison M. and Kathy Cannings. 1997. The Effects of Gender Role Congruence and Statistical Discrimination on Managerial Advancement. Human Relations, 50: 1305-28.
10. Landau, Jacqueline. 1995. The relationship of Race and Gender to Manager’s Ratings of Promotion Potential. Journal of Organizational Behavior. 16: 391-400. 11. Liu, Ying-chuan. 1989. Wage Discrimination by Sex in Taiwan. Taiwan
EconomicReview. 17: 357-88.
12. McCue, Kristin. 1996. Promotions and Wage Growth. Journal of Labor Economics.14: 175-209.
13. Mincer, Jacob and Solomon Polachek. 1974. Family Investments in Human Capital: Earnings of Women. The Journal of Political Economy. 82, no. 2, Part 2: Marriage, Family Human Capital, and Fertility: S76-S108.
14. Neumark, David and Michele Mclennan. 1995. Sex Discrimination and Women’s Labor Market Outcomes. The Journal of Human Resources 30: 713-40.
15. Olson, Craig A. and Brian E. Becker. 1983. Sex Discrimination in the Promotion Process. Industrial and Labor Relations Review. 36: 624-41.
16. O'Neill, June and Solomon Polachek. 1993. Why the gender gap in wages narrowed in the 1980s? Journal of Labor Economics. 11: 205-28.
17. Reskin , Barbara. 1993. Sex Segregation in the Workplace. Annual Review of Socialogy. 19: 241-70.
18. Tseng, Min-Chieh. 2001. The Changes of Gender Differences in Earnings in Taiwan: 1982, 1992 and 2000. Journal of Population Studies. 147-209.
19. Ivanova-Stenzel, Radosveta and Dorothea Kübler. 2005. Courtesy and Idleness: Gender Differences in Team Work and Team Competition. SFB 649 Discussion Paper 049.
20. Wellington, Alison J. 1993. Changes in the Male/Female Wage Gap, 1976-85. The Journal of Human Resources. 28: 383-411.
Table 1: Gender of Chairperson and CEO
(1) (2) (3) (4)
Female Male Companies
Chairperson 234 (7.45%) 2,908 (92.55%) (A) Even Team
CEO 180 (5.73%) 2,962 (94.27%)
3,142 (100%)
(B) Single Team 46 (3.43%) 1,297 (96.57%) 1,343 (100%)
Table 2: Team Compositions of Chairperson and CEO
(1) (2) (3) (4) (5) (6)
Chairperson CEO Obs % Conditional probability (%)
Comparison with the proportion of CEOs (%)
-by gender- Female Female 19 0.61 8.12
>
5.73 Female Male 215 6.84 91.88<
94.27 Male Female 161 5.12 5.54<
5.73 Male Male 2747 87.43 94.46>
94.27 3142 100.00Table 3: Probit Estimation of Team Composition with Female CEOs (Marginal Effects)
SCP MCP ACP
(1) (2) (3) (4) (5) (6) (7) (8) (9)
Female Chairperson 0.0214 -0.00797 -0.00486 0.0161 0.0852* 0.0836* 0.0167 0.100* 0.0991*
(PSEX) (0.0175) (0.0617) (0.0637) (0.0166) (0.0493) (0.0497) (0.0167) (0.0541) (0.0548)
Female CEO Share
(SCP) 1.108** 1.065** 0.972** (MCP) 0.891** 0.954** 0.932** (ACP) 0.919** 0.991** 0.970** (0.325) (0.340) (0.346) (0.111) (0.116) (0.115) (0.118) (0.123) (0.122)
PSEX*SCP 0.496 0.394 PSEX*MCP -0.682* -0.695** PSEX*ACP -0.807** -0.825**
( FC 3 β ) (1.204) (1.190) (0.351) (0.349) (0.371) (0.370) North Taiwan 0.00136 0.00693 0.00758 (0.00926) (0.00841) (0.00840) 0.00881 0.00388 0.00388 Established Years 11~20 (0.0113) (0.0105) (0.0105) 0.00617 0.00131 0.00171 Established Years 21~30 (0.0128) (0.0116) (0.0117) -0.00849 -0.0154 -0.0155 Established Years >30 (0.0113) (0.0101) (0.0101) 0.0247* 0.0202 0.0203
Firm Size Level
A2 (0.0145) (0.0135) (0.0136)
0.0167 0.0108 0.0109
Firm Size Level
A3 (0.0143) (0.0131) (0.0131)
0.0139 0.00911 0.00932
Firm Size Level
A4 (0.0142) (0.0130) (0.0131)
0.0329* 0.0273 0.0278
Firm Size Level
A5 (0.0191) (0.0178) (0.0179)
N=3,142. The robust standard errors are listed in the parentheses, and constant is not reported. *significant at the 90% level; **significant at the 95% level. SCP: 5 industry classifications. MCP: 41 industry classifications. ACP: 41 industry classifications and each company may have more than one industry code.
Table 4: Probit Estimation of Single Team Composition (Marginal Effects)
SCP MCP ACP
(1) (2) (3) (4) (5) (6) (7) (8) (9)
Female Chairperson -0.143** -0.0869 -0.100 -0.142** -0.161** -0.170** -0.142** -0.154** -0.163**
(PSEX, β1S) (0.0234) (0.122) (0.118) (0.0235) (0.0438) (0.0432) (0.0235) (0.0464) (0.0459)
Female CEO Share
(SCP) -0.557 -0.494 -1.244** (MCP) -0.320 -0.347 -0.486** (ACP) -0.361 -0.378 -0.497* (0.554) (0.567) (0.590) (0.236) (0.245) (0.247) (0.249) (0.257) (0.260)
PSEX*SCP -1.335 -1.337 PSEX*MCP 0.462 0.433 PSEX*ACP 0.296 0.239
β3S (2.628) (2.633) (0.934) (0.963) (0.983) (1.013) 0.0424** 0.0356** 0.0354** North Taiwan (0.0154) (0.0153) (0.0153) 0.0643** 0.0679** 0.0679** Established Years 11~20 (0.0194) (0.0194) (0.0194) 0.0726** 0.0786** 0.0786** Established Years 21~30 (0.0218) (0.0218) (0.0218) -0.00449 0.00442 0.00467 Established Years >30 (0.0206) (0.0206) (0.0206) 0.0686** 0.0703** 0.0703**
Firm Size Level
A2 (0.0225) (0.0225) (0.0225)
0.124** 0.125** 0.125**
Firm Size Level
A3 (0.0228) (0.0229) (0.0229)
0.161** 0.160** 0.160**
Firm Size Level
A4 (0.0230) (0.0230) (0.0230)
0.138** 0.136** 0.136**
Firm Size Level
A5 (0.0278) (0.0277) (0.0277)
N=4,485. The robust standard errors are listed in the parentheses, and constant is not reported. *significant at the 90% level; **significant at the 95% level. SCP: 5 industry classifications. MCP: 41 industry classifications. ACP: 41 industry classifications and each company may have more than one industry code.
表 Y04
行政院國家科學委員會補助國內專家學者出席國際學術會議報告
98 年 5 月 5 日 報告人姓名 陳鎮洲 服務機構 及職稱 政治大學經濟學系,助理教授 時間 會議 地點 98 年 4 月 30 日至 5 月 2 日 底特律,美國 本會核定 補助文號 臺會綜二字第 0980014860 號 會議 名稱 (中文) 2009 美洲人口學會年會(英文) Population Association of America 2009 Annual Meeting 發表
論文 題目
(中文) 高階主管與性別歧視:以台灣為例
(英文) Gender Discrimination Among Taiwanese Top Executives 報告內容應包括下列各項: 一、參加會議經過 本人在本次大會所發表的論文被安排在會議的第三天。除了於大會發表論文之外, 本人並參與及聆聽許多論文的發表,收穫頗豐。 二、與會心得 本年會是人口學界每年最主要的國際學術會議之一。每一次的年會,都有許多重量 級的人口、社會、以及經濟學者參與大會,在本次會議中亦不例外,本人亦從相關 的會議論文中受益頗豐。 三、考察參觀活動(無是項活動者省略) 無。 四、建議 無。 五、攜回資料名稱及內容 會議日程表 1 份。 六、其他 無 附件三