行政院國家科學委員會專題研究計畫 成果報告
現金減資與庫藏股減資之比較:決定因素與宣告效果
研究成果報告(精簡版)
計 畫 類 別 : 個別型 計 畫 編 號 : NSC 99-2410-H-004-082- 執 行 期 間 : 99 年 08 月 01 日至 100 年 07 月 31 日 執 行 單 位 : 國立政治大學財務管理學系 計 畫 主 持 人 : 徐燕山 計畫參與人員: 博士班研究生-兼任助理人員:劉淑華 處 理 方 式 : 本計畫可公開查詢中 華 民 國 100 年 09 月 08 日
行政院國家科學委員會補助專題研究計畫
▉成果報告
□期中進度報告
現金減資與庫藏股減資之比較:決定因素與宣告效果
計畫類別:▉個別型計畫 □整合型計畫
計畫編號:NSC 99-2410-H-044-082
-
執行期間: 99 年 8 月 1 日至 100 年 7 月 31 日
執行機構及系所:財務管理學系
計畫主持人:徐燕山
共同主持人:
計畫參與人員:
成果報告類型(依經費核定清單規定繳交):□精簡報告 ▉完整報告
本計畫除繳交成果報告外,另須繳交以下出國心得報告:
□赴國外出差或研習心得報告
□赴大陸地區出差或研習心得報告
□出席國際學術會議心得報告
□國際合作研究計畫國外研究報告
處理方式:
除列管計畫及下列情形者外,得立即公開查詢
□涉及專利或其他智慧財產權,□一年□二年後可公開查詢
中 華 民 國 100 年 7 月 31 日
目錄 壹、摘要 中文摘要 ... I 英文摘要 ... II 貳、報告內容 Introduction ... 1
Capital-reduction payout methods in Taiwan ... 3
Literature Review and Hypotheses ... 4
Data and methodology ... 7
Empirical results ... 10
Conclusions ... 15
Table ... 16
參、文獻參考 ... 27
摘要 我們探討台灣上市櫃公司面臨資本減資問題時,如何在現金減資與股票購回兩者間作抉 擇。我們提出三種假說:股票供給無彈性假說、擇時假說、與彈性假說,說明上市櫃公 司選擇減資方式的依據。實證發現減資規模相對公司平均交易量較大的公司傾向採用現 金減資,支持股票供給無彈性假說。擇時假說指出當公司股價暴跌時,公司傾向選擇在 公開市場購回股票;反之,當公司股價上漲時,減資公司傾向採用現金減資的方式。我 們的實證結果支持擇時假說。彈性假說指出,因為股票購回的宣告不像現金減資必須執 行,股票購回相對較有彈性。因此,當公司現金流量波動較大或超額資金較低時,減資 公司傾向選擇在公開市場購回股票。 關鍵字: 資本減資支出、供給無彈性、公開市場購回、現金減資
Abstract
We investigate how Taiwanese listed firms’ choice over direct cash distributions or open-market repurchases as their capital-reduction payout method. We propose three hypotheses to explain their choice: the supply inelasticity of stock hypothesis, the market-timing hypothesis and the flexibility hypothesis. The supply inelasticity of stock hypothesis suggests that capital-reduction firms are more likely to choose the direct cash distribution as their payout method when the size of capital reduction is relatively large to firms’ average trading volume. We find support for this hypothesis. The market-timing hypothesis posits that firms will choose the open-market repurchase when their shares have recently plunged in the market, while they will choose the direct cash distribution when their shares move in the opposite direction. We find strong support for this hypothesis. The flexibility hypothesis argues that as open-market repurchases are not a commitment as direct cash distributions, firms with a greater volatility of their cash flows and/or a lower level of their excess cash are more likely to choose the open-market repurchase as their payout methods. We find weak evidence for this hypothesis.
Key words: Capital-reduction payouts, supply inelasticity, open-market repurchases, direct cash distributions
The Choice of Capital-reduction Payout Methods in Taiwan
I. Introduction
The main purpose of this paper is to investigate how Taiwanese firms choose their capital-reduction payout methods. Taiwanese firms that plan to conduct a capital reduction payout currently can either distribute the cash directly to their stockholders or repurchase their own stocks from the markets or both. Prior to the implementation of open-market share repurchase programs in the Taiwan stock markets in 2000, only through a direct cash distribution to their stockholders can Taiwanese firms conduct a capital reduction payout; however, none of them had ever done so before that. Only until the year of 2006, six years after the introduction of open-market repurchase program, did firms begin conducting a direct cash distribution of capital reduction payout, and some of which also had conducted capital reduction payouts through an open market repurchase during the period from 2006 to 2009. This compels us to study how Taiwanese firms choose their capital-reduction payout methods.
In their survey of corporate payout policy, DeAngelo, DeAngelo and Skinner (2008) conclude that flexibility in timing of payouts is an important element of corporate payout policies. Although special dividends offer the same flexibility as repurchases do, special dividends were widely used and now are uncommon; repurchases, however, were rare but are pervasive now in the U.S. In addition, the Skinner (2008) examination on the relation between earnings and both dividends and repurchases suggests that the role of special dividends—especially, the flexibility in timing of payouts—has largely been replaced by stock repurchases.
Special dividends are never a practice in Taiwan, but the Taiwanese direct cash distributions of capital reductions share with the special dividends of the U.S. some common characteristics, such as payout size and frequency; thereby examining the capital-reduction payout methods chosen by Taiwanese firms might enable us to identify which functions the special dividends of the U.S. serve are at work in the Taiwanese direct cash distributions of capital reductions and the additional functions the Taiwanese direct distributions serve in firms’ choice of payout methods. Hence, our study will enrich our understandings on the literature of payout policy.1
To investigate these issues, this paper studies a sample of Taiwanese firms that have conducted either open market repurchase programs or cash distributions of capital reductions or both during the period from 2006 to 2009.
To explain how Taiwanese firms choose their payout methods of capital reductions, we
1As in a capital reduction the share holdings of individual stockholders are reduced proportionally, Taiwanese capital reductions, in formality, are similar to reverse stock splits in which the number of shares held by each individual stockholder is reduced proportionally according to split ratios. But reverse stock splits involve neither capital reductions nor cash distributions, we therefore argue that the Taiwanese direct cash distributions of capital reductions, characteristically, are similar to the special dividends in the U.S., excepting that the former involve no personal taxes as they are treated as a return of capital to stockholders.
examine three hypotheses—the supply inelasticity of stock hypothesis, the market-timing hypothesis, and the flexibility hypothesis. The supply inelasticity of stock hypothesis argues that if their number of shares to be repurchased is relatively large and the supply curve of their stocks is inelastic, firms might choose direct cash distributions as the payout method to avoid the possible short-term price shooting-up of their stocks resulting from their open market repurchasing activities. The supply inelasticity of stock hypothesis thus suggests that firms conducting capital reduction payouts might choose direct cash distributions if payout sizes are relatively large. We show that firms’ choice of capital-reduction payout methods is consistent with this hypothesis.
The market-timing hypothesis is based on the premise of information asymmetry between managers and outsiders. Empirical evidence reveals that the long-run performance improves after firms have repurchased their own stocks, suggesting that managers are better able than stockholders to judge whether their stock price is too high or too low. Therefore, firms conducting capital reduction payouts are more likely to adopt share repurchase programs if their stock prices have plunged recently. The market timing hypothesis thus suggests that when their shares have plummeted to a lower level of price, these firms will consider a share repurchase program in order to take advantage of the opportunity of their stocks probably being under-valued. We document strong evidence for this hypothesis.
The flexibility hypothesis posits that in contrast to cash distributions in which a firm is committing to pay out cash to stockholders, repurchase programs are a much more flexible option for capital reduction payouts because they provide firms the flexibility of synchronizing payouts with cash flows; and we know that the greater the volatility of a firm’s cash flow is and/or the lower the level of its excess cash is, the greater is the value of this flexibility. The flexibility hypothesis thus suggests that firms conducting capital reduction payouts are more likely to go forward with a repurchase program if the volatility of their cash flows is greater and/or the level of their excess cash is lower. We document weak evidence for this hypothesis.
Prior studies on payout policy have compared the valuation effect either between open market and tender offer repurchase programs (e.g., Comment and Jarrell(1991)) or between specially designated dividends (SDDs) and tender offer share repurchases (e.g., Lang and Litzenberger (1989) and Howe, He, and Kao (1992)). But none of them have ever compared the valuation effect between open market repurchase programs and special dividends in the U.S. The present study will compare the valuation effect of Taiwanese direct cash distributions of capital reductions to that of open market repurchases of capital reductions, furthering our understandings on payout policy.
As we have mentioned above, a cash distribution payout is a commitment by firms, while a share repurchase is not; thereby, we expect that cash distributions, compared to share repurchases, will be more favorably accepted by investors, which will in turn induce a
greater positive valuation effect. On the other hand, as we also have argued above, firms are more likely to go forward with a share repurchase in down markets; therefore, the signal of shares being undervalued is strong in share repurchase announcements, thereby inducing a greater positive valuation effect. Therefore, to get a better insight of the valuation effect difference between the payout methods per se, we have to control the effects of pre-commitment and signaling.
We find that both types of payout are associated with a significantly positive abnormal return for a three-day event period, CAR(0,2). Although the abnormal return for the sample of share repurchases is greater than that for the sample of cash distributions, the difference between them is not significantly different from zero. After controlling for pre-commitment, signaling and firm characteristics, the price reaction to share repurchases is not necessarily stronger.
This paper proceeds as follows. Section 2 describes the capital-reduction payout methods in Taiwan. Section 3 develops the hypotheses. Section 4 presents the data and the methodology. Section 5 presents and discusses the empirical results, and Section 6 concludes.
II. Capital-reduction payout methods in Taiwan
Taiwanese firms can conduct a capital-reduction payout through either share repurchases or cash distributions or both. For the repurchase payout method, ever since the amendment of the Securities and Exchange Act in 2000, firms listed on the Taiwan Stock Exchange or the over-the-counter (OTC) market can employ either open market repurchases or self-tender offers to execute their repurchase programs.2 Before they begin repurchasing their shares from the market, firms have to file to the Financial Supervisory Commission in Taiwan a report which should specify the following items: an upper limit price of the stock below which firms will repurchase their own shares, a time period of repurchasing less than or equal to the maximum period of two months, a pre-specified number of shares to be repurchased up to the 10% of a firm’s capital, and the motivation of the repurchase, either for cancellations of buyback stocks to protect the interest of shareholders or for equity conversions of convertibles or for share transfers to employees.3
A repurchase program could end earlier than the ending date specified in the filing report under either of the following two conditions; first, a company has repurchased shares up to the repurchasing dollar amount specified by the company; second, once the market closing price of repurchasing firm’s stock, during the repurchasing period, has risen above from
2Although firms are allowed to repurchase their shares through tender offers, none of them has ever done so during the period of our study.
3As repurchase programs with the stated purpose either of equity conversions or of share transfers do not necessarily lead to eventual capital reductions, this paper will focus on the cases with the stated purpose of treasury stock write-off, which will lead to capital reductions eventually.
below the upper limit price specified in the filing report, a repurchase program expires immediately.
After the end of or the expiration of a repurchase program, firms have to file another report which should describe the number of shares they have repurchased, the average repurchasing price, the actual dollar amount of share repurchase, and the reasons for any shortage of the repurchasing dollar amount originally specified in the filing request.
To conduct a cash-distribution payout, firms need to follow the regulations specified in Article 167 of the Company Act, which govern firms of conducting capital-reduction cash distributions.4 After getting approvals from both the meeting of the Board of Directors and the meeting of the stockholders, firms also need to file to the Financial Supervisory Commission in Taiwan an application which will specify the percentage of as well as the purpose of capital reduction, either making-up losses or capital distributions. The procedure for a capital reduction through the Company Act, compared to that for a share repurchase program through the Securities and Exchange Act, is more tedious and the process of it is more time-consuming—normally lasting for a year.5
III. Literature Review and Hypotheses
We review the literature that is relevant to the valuation effect and the choice of the two different payout methods we will examine.
1. Valuation effects of capital reduction payouts
Ever since Miller and Modigliani (1961) demonstrated that in perfect markets a firm’s payout policy is irrelevant, various theories have tried to explain why firms choose a specific payout method (dividend, share repurchase, special dividend). The majority of these explanations can be classified into three groups according to the frictions they build on: asymmetric information, agency problems, and taxation. This study will compare the valuation effect of cash distributions versus share repurchases against some of the frictions.
Taiwanese cash distributions of capital reduction payouts are similar to special dividends on one aspect that, in contrast to regular cash dividends, they both are “occasional” payouts, suggesting that they are not as likely to be repeated as the “regular” payout. Brickley’s (1983) evidence suggests that investors treat special dividends as hedged managerial signals
4Instead of distributing cash to their stockholders, firms by following the regulations specified in Article 168 of the Company Act can conduct a capital-reduction program with a view to writing off the operating losses having been accumulated on the book. However, the underlying economic incentives between these two types of capital reduction—making-up losses and cash distributions—might be quite different, we therefore will focus only on the cases of cash distributions because their economic incentives are more in line with those of repurchase programs with the purpose of treasury stock write-off.
5Some argue that since open-market repurchases are allowed to repurchase shares up to the limit of a 10% of a firm’s capital, firms that plan to conduct capital reductions with a percentage greater than the 10% limit might be forced to go forward with cash distributions of capital reductions. However, the 10% limit is not a binding because firms can sequentially announce a number of repurchase programs to avoid this constraint. Therefore, what firms are more likely to evaluate in the choice of payout methods is the liquidity of their stocks, instead of the payout size.
about future profitability in that unanticipated specials are associated with weaker market reactions than are regular dividend increases of comparable size. DeAngelo et al. (2000) further argue that special dividends may or may not serve as signals in the conventional sense, depending on whether stockholders interpret them as information about the firm’s future profitability as opposed to information about the success of its current restructuring effort. These studies suggest that cash distributions of capital reduction payouts, if they are viewed as equivalents to special dividends in their signaling role, might serve as a signal weaker than that of share repurchases.
The free cash flow hypothesis is another explanation for the positive stock price reaction to the announcements of open market repurchases. Jensen (1986) argues that firms with limited investment opportunities are more likely to have accumulated excess free cash flows and they might be subject to agency problems because managers in these firms have the incentive to invest in value-destroying projects. Managers can announce to distribute excess capital through stock repurchases or (special) dividends, which will induce a positive response from investors to the reductions of agency costs.
Guay and Harford (2000) and Jagannathan et al. (2000), on the other hand, further document that dividends are used to distribute permanent cash flows while stock repurchases are used to distribute transitory cash flows, such as non-operating cash flows. In other words, stock repurchases possess the financial flexibility by enabling management to distribute excess capital in a timely manner. As cash distributions of capital reduction payouts are “occasional” payouts, we posit that being alike stock repurchases they are also likely to be used to distribute transitory excess capital which might result from the success of firms’ restructuring efforts in particular. However, cash distributions are different from stock repurchases on one aspect: the announcement of cash distributions is a commitment, while it of stock repurchases is not. Therefore, we expect that cash distributions, compared to stock repurchase, are to induce a stronger response from investors.
Finally, one advantage stock repurchases have over cash dividends is taxation. Although the tax system in Taiwan treats dividends and repurchases the same at the corporate level, stock repurchases are generally tax-advantaged at the personal level because stockholders in Taiwan do not have to pay any tax bill on the capital gains realized from selling out their holding shares, but they have to count the dividends received as their ordinary income and pay tax bills or receive tax credits according to the local imputation tax system. However, cash distributions of capital reduction payouts involve no tax issues because they are treated as the return of the capitals, not as the distribution of earnings, to stockholders previously contributed by them. Thus, the taxation hypothesis does not either favor stock repurchases over cash distributions or favor cash distributions over stock repurchases.
The discussions above do not enable us to concretely conclude which payout method--cash distributions versus stock repurchases--will be associated with a greater positive
price reaction, an issue this study tries to shed some light on. 2. The choice of payout methods
To address the issue of how firms conducting capital reductions choose their payout methods, we propose three hypotheses: the supply inelasticity of stocks hypothesis, the market-timing hypothesis, and the flexibility hypothesis.
a. The supply inelasticity of stock hypothesis
Bagwell (1992) documents that firms face upward-sloping supply curves when they repurchase shares in a Dutch auction, and she finds that supply elasticity is larger for firms with large trading volume. Hodrick (1999) examines whether supply elasticity of stock affects a firm’s choice between the Dutch auction and fixed-price tender offer repurchase methods, and he finds that firms that chose the Dutch auction instead of the fixed price tender offer are those firms expecting to face greater stock elasticity and they tend to have larger trading volume. These results suggest that a firm’s supply inelasticity of stock will affect its choice of payout methods.
As cash distributions of capital-reduction payout involve no trading in the markets, the supply inelasticity of stock hypothesis argues that if the payout size is relatively greater than their trading volumes, firms, in order to avoid the negative impact from an upward-sloped supply curve of their stocks, might choose cash distributions to complete their capital reduction payouts. The supply inelasticity of stock hypothesis thus suggests that Taiwanese firms that plan a capital reduction payout might prefer cash distributions to share repurchases if their payout sizes are relatively larger to their trading volumes.
b. The market-timing hypothesis
The market-timing hypothesis is based on the premise of information asymmetry between managers and outsiders. Empirical evidence reveals that the long-run performance improves after firms have repurchased their own stocks, suggesting that managers are better able than stockholders to judge whether their stock price is too high or too low. Ikenberry et al. (1995) is the first to document such evidence. On the other hand, Jagannathan et al. (2000) find that firms repurchase stock following poor stock market performance and increase dividends following good performance, suggesting that managers might think an open-market repurchase program as a positive NPV investment in declining markets and as a negative NPV investment in rising markets.
Recently, Peyer and Vermaelen (2009) have not only documented that open market repurchases are a response to a market overreaction to bad news with the evidence of repurchasing firms having experienced a bigger drop in their stock price in the six months prior to the repurchase announcement, but also that the long-run abnormal returns are
statistically significant for the sample of “undervalued” and “best use of money” repurchasing firms which are likely to cancel the shares to be repurchased.
Therefore, Taiwanese firms conducting capital reduction payouts are more likely to adopt share repurchase programs if their stocks are too low, which might be reflected in their recent stock price plunges. The market-timing hypothesis thus suggests that when their shares have recently under-performed in the market, these firms will consider a share repurchase program in order to take advantage of the opportunities of their shares being under-valued.
c. The flexibility hypothesis
In contrast to cash distributions in which a firm is committing to pay out cash to stockholders, repurchases are a much more flexible option for capital reduction payouts because open market repurchase programs are not a commitment. As cash distribution payouts are a commitment, firms with a lower level of excess cash or hinging their repurchasing activities on their expected future cash flows are more likely to adopt share repurchases as the payout method to avoid the risk of cash shortages in cash distribution commitments. Jagannathan et al. (2000) document that stock repurchases are used to distribute transitory cash flows such as non-operating cash flows and that repurchasing firms have a greater volatility of cash flows.
Recently, Oded (2008) develop a theoretical model built on the agency costs of free cash to explain how firms determine their payout policies. His model predicts that risky firms—i.e., firms with high variability of return on their investments—are more likely to repurchase than pay dividends, for the incentive to repurchase is provided through gains from adverse selection for which uncertain about future returns is necessary, suggesting that firms with a greater volatility of free cash flows will prefer repurchases over dividends.
The flexibility hypothesis thus suggests that Taiwanese firms that conduct a capital reduction payout are more likely to go forward with a repurchase program if their volatility of cash flow is greater and/or the level of their excess cash is lower.
IV. Data and methodology
1. Data
We collect a sample of cash distributions of capital reduction announcements and a sample of repurchasing announcements with the motivation of “cancellation of shares repurchased” made by firms listed either on the Taiwan Stock Exchange or on the over-the-counter (OTC) market over the period of 2006 to 2009.6 We exclude those events announced by financial firms, because financing activities of financial firms, compared to
6This sample period is the period of time during which most of Taiwanese cash distributions of capital reductions have occurred.
industry firms’, are more heavily regulated. In addition, to avoid the confounding effects resulting from repeating repurchase announcements made by the same firms during a short time interval, we also exclude those announcements preceded by another announcement within 6 months. The sample size of the cash distribution payouts is 29, while it of share repurchase payouts is between 286. We collect the sample data and the data in the following analyses from the Taiwan Economic Journal (TEJ).
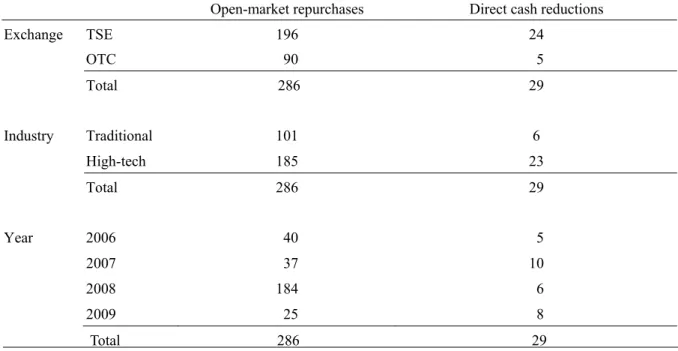
[Insert Table 1 here]
Table 1 presents the distribution for both samples of cash distributions and share repurchases. Of the 286 repurchases, 196 announcements are from the listed firms on the Taiwan Stock Exchange and 90 are on the over-the-counter (OTC) market. On the other hand, of the 29 cash distributions, 24 distributions are from firms listed on the Taiwan Stock Exchange and 5 are on the OTC market.
We discover that of the 286 repurchases, 185 are from high-tech firms, while 101 are from traditional firms. Of the 29 cash distributions, 23 distributions are from high-tech firms, while six distributions are from traditional firms. The distribution of the repurchase sample is as follows: 40 repurchases in 2006, 37 in 2007, 184 in 2008, and 25 in 2009; the number of repurchases in 2008 is the greatest one, reflecting the fact that the Taiwanese firms have triggered repurchase programs with a view to taking advantage of or lessening the drastic plunge of their stock prices caused by the sub-prime financial crisis. The distribution of our cash-distribution sample is as follows: five distributions in 2006, ten in 2007, six in 2008, and eight in 2009.
2. Methodology
To examine how firms choose their capital reduction payout methods, we estimate a logistic model. The dependent variable takes on two values denoting a share repurchase (Y =1) and a cash distribution (Y = 0). Letting X be the matrix of explanatory variables, the logistic model uses the maximum likelihood to estimate the set of coefficients β in the following model:
Y = Xβ + ε, for each outcome Y = 0, 1,
where ε is assumed to follow a standard normal distribution. The coefficients measure changes in the probability of adopting a share repurchase of capital reduction payouts.
To examine the explanations of the supply inelasticity of stock hypothesis on the choice of payout methods, we construct two proxy variables: PO/MC and NP/NT; PO is the expected payout size; MC is the market value of payout firm’s equity; NP is the equivalent number of shares derived by dividing the payout amounts by the payout firm’s stock price on the day preceding the announcement; NT is the average daily trading volume of payout firms, which is calculated from 270 to 21 days prior to the event day. We expect that the greater the values of these two variables, the higher the likelihood that payout firms will adopt the payout
method of direct cash distributions.
To verify the market timing hypothesis, we construct two return variables: WR and WAR; WR is a three-month weighted average of stock raw returns of payout firms; WAR is a three-month weighted average of abnormal returns (risk-adjusted returns from the market model) of payout firms. To derive the WR for each individual payout, we first calculate the monthly (arithmetic) average stock return of payout firms for each of the three months before the event day. For the WAR we also construct a three-month weighted abnormal return variable as a weighted average of the calculated monthly average abnormal returns in the three months before the announcement day. The weights are three for the most recent month, two for the next, and one for the third month before the event day. We expect that the greater the values of these two variables, the higher the likelihood that payout firms will adopt the payout method of direct cash distributions.
To check the validity of the flexibility hypothesis, we construct two variables: VOL and EC; VOL is a 12-quarter estimate of cash flow volatility of payout firms, while EC is the excess cash calculated as the sum of cash and marketable securities in the most recent quarter preceding the event day. We expect that the greater the value of VOL and the lower the level of excess cash, the higher the likelihood that payout firms will adopt the payout method of share repurchase.
Beside these variables associated with our proposed hypotheses, we include the following control variables of firm characteristics: firm size (book value of assets in logarithm), market-to-book value ratio, and leverage ratio (debts/assets).
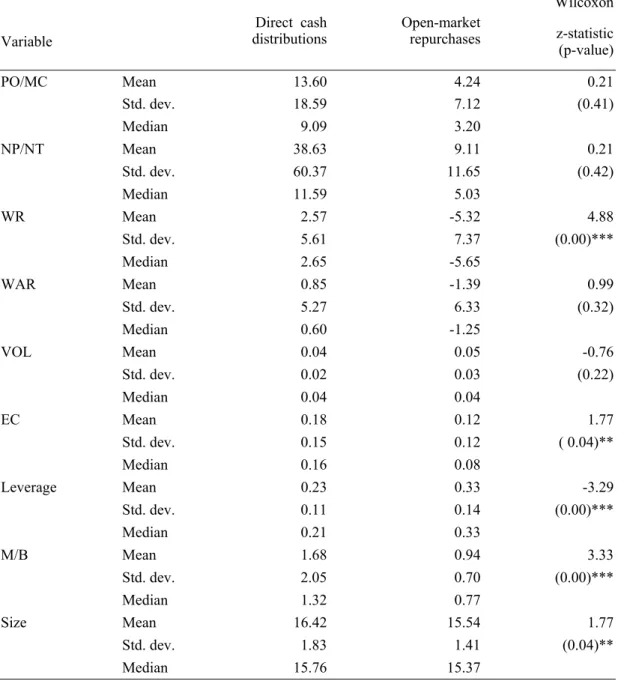
[Insert Table 2 here]
Table 2 presents the summary statistics of these proxy variables as well as firm characteristic variables for our capital-reduction payout sample. For cash-distribution sample, the median of adjusted payout size (PO/MC) is 9.09%, while for repurchase sample it is 3.20%. These medians are not significantly different at the 5% level according to the Wilcoxon test (Z-statistic = 0.21), although the unconditional distribution of payout sizes for cash-distribution firms indicates that their payout size is greater than that for repurchase sample. On the other hand, for cash-distribution sample the median ratio of the number of shares to be retired to the average daily trading volume (NP/NT) is 11.59%, while for repurchase sample it is 5.03%; nor are these medians are significantly different at the 5% level (Z-statistic = 0.21).
For direct cash distributions, the median unadjusted stock return (WR) of payout firms is equal to 2.65%, while for repurchases it is equal to -5.65%. These medians are significantly different at the 1% level (Z-statistic = 4.88). For direct cash distributions, the median adjusted return (WAR) is 0.60%, while for repurchases it is -1.25%. These medians are not significantly different at the conventional level. The different results generated from by using different measures of (unadjusted or adjusted) return suggests that direct cash
distributions are more likely to be adopted in rising markets, while repurchases in declining markets.
For direct cash distributions, the median ratio of excess cash to total assets is 16%, while for repurchases it is 8%. These medians are significantly different at the 5% level. On the other hand, for direct cash distributions the median volatility of free cash flows is 4%, while for repurchases it is 4%, suggesting that the cash flows associated with cash-distribution firms are as stable as with those of repurchasing firms.
For the firm characteristics, we discover that for cash distributions the median leverage ratio (Leverage) is 0.21, while for repurchases it is 0.33. These medians are significantly different at the 1% level according to the Wilcoxon test (Z-statistic = -3.29). Thus, the unconditional distribution of leverage ratios for repurchase firms indicates that they are much more leveraged than cash-distribution firms.
For cash distributions the median market-to-book value ratio (M/B ratio) is 1.32, while for repurchases it is 0.77, indicating that repurchase programs are more likely to be initiated after the stock price has plunged that results in a lower M/B ratio. The median difference is significant at the 1% level (Z-statistic = 3.33). Finally, for cash distributions the median firm size (Size, in logarithm of NT$ billion) is 15.76, while for repurchases it is 15.37.7 The median difference is significant at the 5% (Z-statistic = 1.77), indicating that large firms are more likely to adopt a cash distribution for their capital reductions.
V. Empirical results
1. The valuation effects
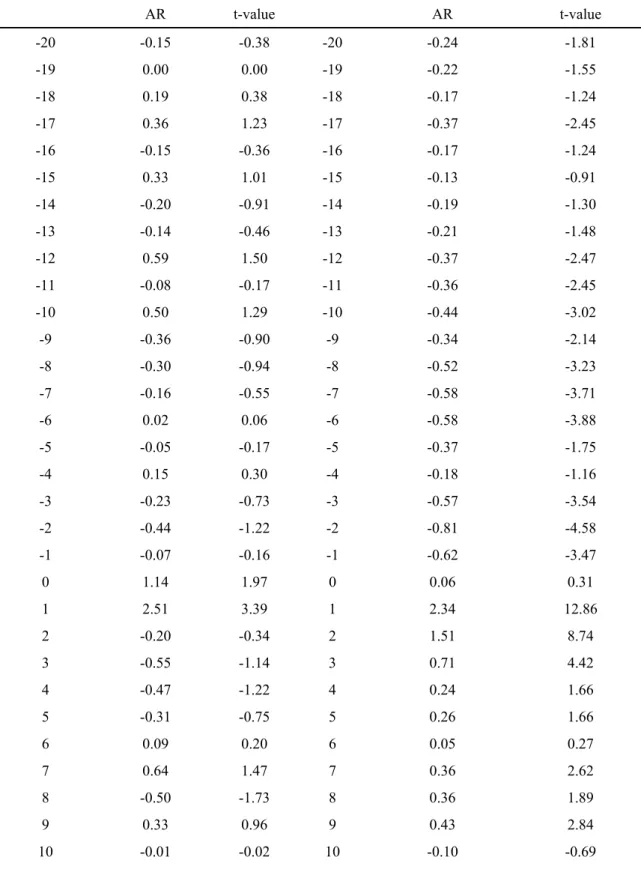
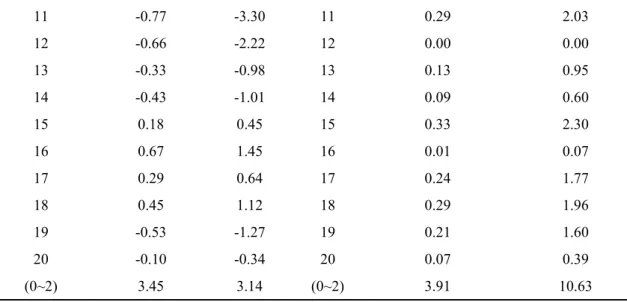
We first conduct univariate tests on the abnormal return differences between different payout methods. We employ the market model to calculate the abnormal returns surrounding the announcement period. For each payout announcement, the market model is estimated by regressing 250 trading days of return data of the payout firm on the Taiwan Stock Exchange value-weighted index from 270 to 21 days prior to the event day. Table 3 reports the average abnormal returns of a 41-day event window surrounding the announcement day (t=0) and the average cumulative abnormal returns for a three-day event period, CAR(0,2).
[Insert Table 3 here]
The results show that the CAR(0,2) associated with the cash-distribution sample is 3.45%, which is significant at the 1% level(t-statistic = 3.14). For the repurchase sample, the CAR(0,2) is 3.91%, which is also significant at the 1% level(t-statistic = 10.63). These results are similar to what have been documented in previous literature. On the other hand, although the CAR(0,2) for the repurchase sample is greater than that for the cash-distribution sample, the test on the median return difference between these two samples yields an
insignificant result (p = 0.83).
Next, we conduct multivariate tests to examine the return difference between these two payout methods after controlling for firm characteristic variables, i.e., firm size, book-to-market value ratio, and leverage ratio, as well as some of the explanatory variables of the choice of the capital-reduction payout methods.
[Insert Table 4 here]
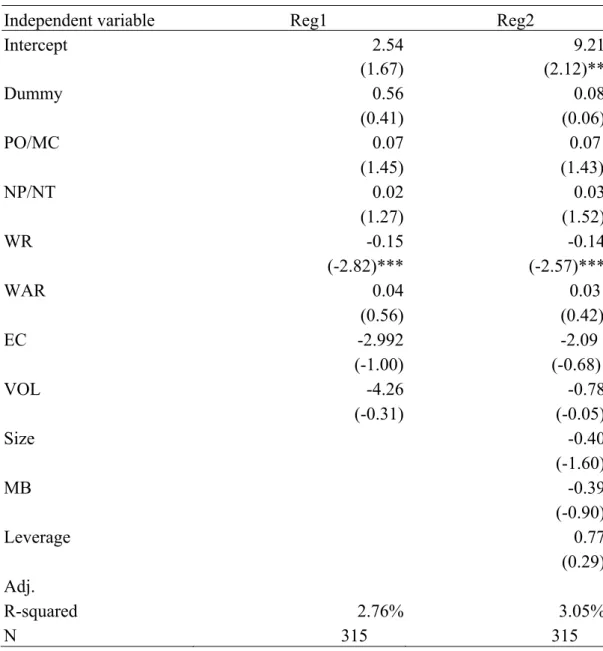
Table 4 presents the regression analyses that relate the cumulative abnormal return over a three-day window period, CAR(0,2), to firm characteristic variables and the choice variables of the capital-reduction payout methods. Regression 1 of Table 4 shows that the coefficient of the Dummy variable, which is set equal to 1 for repurchases and 0 otherwise, is not significant (t-statistic = 0.41), indicating that the mean return difference between repurchases and cash distributions is not significant even after the adjustment for the impacts of payout characteristics. And the results show that the greater a capital-reduction firm’s stock price has declined prior to the announcement, its cumulative abnormal return will be greater.
In Regression 2 of Table 4, we add in firm characteristics variables. The results from Regression 2 are qualitatively similar to what we have found in Regression 1. Thus, the multivariate tests, similar to the univariate test, suggest that the valuation effect difference between the payout methods is not significantly different.
On the other hand, the coefficient of WR either in Regression 1 or in Regression 2 is negative and significantly different from zero, indicating that firms announce a capital reduction following a more severe decline of their stock prices, their stock prices will react more favorably to the announcements.8
2. The choice of payout methods
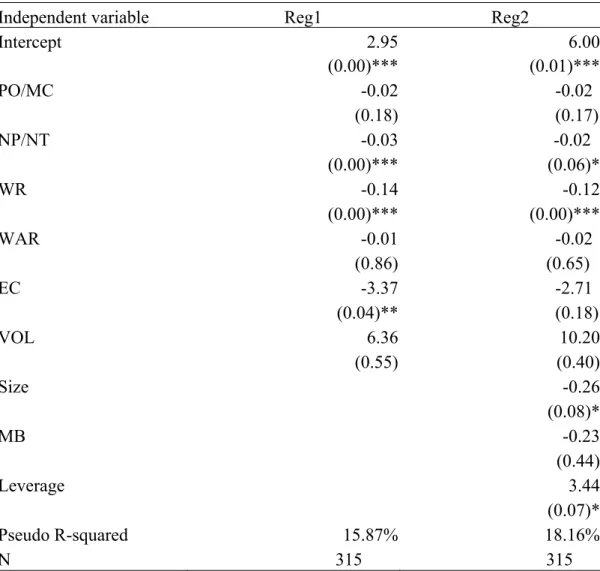
Table 5 shows the results of logistic analyses that relate firms’ choice of a cash distribution or a repurchase to payout characteristics and/or firm characteristics. Regression 1 of Table 5 shows that the coefficient of NP/NT is negative and significantly different from zero (p < 1%), suggesting that firms are more likely to adopt a cash-distribution for their capital reductions when the size of reductions relative the trading volume is large. This result is consistent with the supply inelasticity of stock hypothesis. On the other hand, the coefficient of PO/MC is also negative but not significantly different from zero (p = 18%), suggesting that the variable of NP/NT has accounted for the effect of the variable of PO/MC on the choice of payout methods.9
[Insert Table 5 here]
The coefficient of WR is negative and significantly different from zero (p < 1%),
8 Because the sample size difference between direct cash distributions and open market repurchases, 29 versus 286, is so large, we have to be cautious about this explanation. The result might be solely driven by the open market repurchases.
suggesting that firms are more likely to adopt a repurchase for their capital reductions after their stock prices have recently declined. This result is consistent with the market-timing hypothesis, which argues that firms are more likely to adopt a repurchase program for their capital reduction payouts after their stock prices have plunged. On the other hand, the coefficient of WAR is also positive but not significantly different from zero (p = 86%), suggesting that the variable of AR might also have explained away the effect of the variable of WAR.10
Finally, the coefficient of EC is also negative and significantly different from zero (p = 4%), suggesting that firms with low excess cash choose repurchases instead of cash distributions, avoiding future payout commitments. This result is consistent with the flexibility hypothesis.11 The coefficient of VOL is positive but not significantly different from zero (p = 55%).
Regression 2 of Table 5 adds in the control variables of firm characteristics, including firm size, leverage ratio, and market to book value. The results on the proxy variables for our three hypotheses are qualitatively similar to those in Regression 1, except that the coefficient of EC becomes insignificant (p = 18%). On the other hand, the coefficient of Size (firm size) is negative and significantly different from zero (p = 8%), suggesting that the firms choosing the cash-distribution payout method are more likely to be large firms whose payout sizes are also likely to be larger. The coefficient of MB is negative, but not significant. The coefficient of Leverage is positive and significantly different from zero (p = 7%), indicating that the firms choosing the open-market repurchases are more likely to have a higher debt ratio, translating into a lower level of excess cash associated with these firms.
The results indicate that the market condition variables—NP/NT and WR—have a first order impact on the choice of capital-reduction payout methods, while the firm characteristic variables—Size and Leverage—have a second order impact. The significance of NP/NT variable and the insignificance of both EC and VOL variables suggest that the flexibility (which firms can adapt to suit the conditions of their future cash flow and its fluctuation) associated with open market repurchases is overwhelmed by the stock trading conditions of the firms conducting capital-reduction payouts.12 In other words, the liquidity, for which NP/NT intends to proxy, of and the price level, for which WR intends to proxy, of stock do matter more than firms’ characteristics in their choice of payout method.
10After we have excluded the variable of AR from the regression, the coefficient of WAR becomes negative and is significantly different from zero.
11In the corporate governance literature, Harford et al. (2008) find that firms with weaker corporate governance structures have lower excess cash and choose to repurchase instead of increasing dividends in order to avoid payout commitments. Another explanation without appealing to excess cash is that managers in the firms with weaker corporate governance structures choose to repurchase in order to increase their voting ownership percentage.
12When we include both the variables of PO/MC and Size, but without the variable of NP/NT, in the regression analysis, we find that both the coefficients are significantly different from zero, suggesting that PO/MC is likely to be a proxy for market conditions, instead of firm characteristics.
On the other hand, the significance of WR variable suggests that the direct cash distributions complement the open-market repurchases for providing firms with capital-reduction payout options under different market conditions. And this is the flexibility possessed by the direct cash distributions, not having been and unlikely to be replaced by the open-market repurchases.
3. Robustness checks
To check the robustness of our results, we conduct the following tests.
a. Tests on the sub-samples of share repurchase payouts with different thresholds of completion rate
If the share repurchase is not a commitment, bad firms could mimic good ones by announcing a repurchase program, thereby enjoying price appreciation today and refraining themselves from repurchasing. Oded (2005) presents a separating equilibrium model in which he assumes that good firms do not incur any cost when they announce a repurchase program, while mimicry by bad firms is costly. Therefore, bad firms might not be able to mimic good ones. However, bad firms might mimic since we have not observed any obvious penalty being imposed on such bad firms’ mimicry.
To lessen the possible effect of mimicry by bad firms on the robustness of our results, we conduct a test on a sub-sample of share repurchase payouts which excludes those repurchases with an actual completion rate of less than 50% (or 70%).13 As the results from these two sub-samples, 50% and 70% completion rates, are qualitatively similar in all aspects, we, therefore, hereby just report the results based on the actual completion rate of at least 50%.14
[Insert Table 6 here]
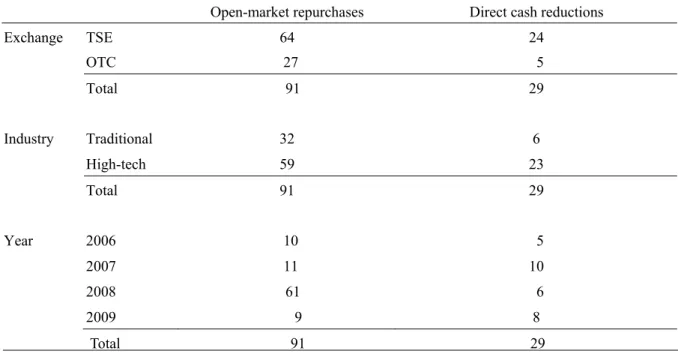
Table 6 presents the distribution for both samples of cash distributions and share repurchases. It shows that the number of share repurchases is 91, reduced approximately by a scale of two-thirds from the sample size of 286 in the whole sample. And the number of repurchases in different sub-samples grouped either by the Exchange or by the industry or by the year is also reduced roughly by a scale of two-thirds. Therefore, there is no significant bias in the distributions between the sub-sample and the whole sample.
[Insert Table 7 here]
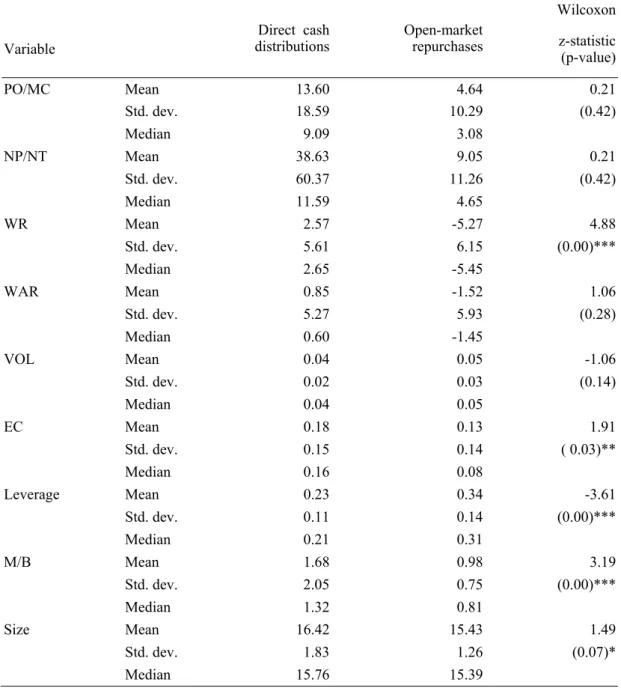
Table 7 reports the descriptive statistics for market conditional variables and firm characteristic variables for this sample with a completion rate of at least 50%. The results on the median differences of either the market condition variables or the firm characteristic variables between the two sub-samples—direct cash distributions versus open market
13 We have also tried to conduct a robustness test on the sub-sample of repurchases with at least 90% completion rate. However, we do not conduct the analysis because the number of repurchases has declined drastically to 12.
14 The results based on the completion rate of at least 70% are available upon request from the author. The number of repurchases associated with this sub-sample is 53.
repurchases—are qualitatively similar to those associated with the whole sample. [Insert Table 8 here]
Table 8 shows the results of the logistic analyses on firms’ choice of capital-reduction payout methods. Regression 1 of Table 8 shows that the coefficients of NP/NT, AR and EC are all negative and significantly different from zero. These results are qualitatively similar to those reported in Regression 1 of Table 5 for the whole sample. Regression 2 of Table 8 adds in the control variables of firm characteristics. The results from Regression 2, basically, are similar to those reported in Regression 1 of Table 8, except that the coefficient of NP/NT, which is significantly different from zero in Regression 2 of Table 5 for the whole sample, becomes insignificantly. On the contrary, the coefficient of EC, which is not significantly different from zero in Regression 2 of Table 5 for the whole sample, is still significantly different from zero in Regression 2 of Table 8, suggesting that the flexibility associated with open market repurchases is a factor firms will assess before they decide their payout method. b. Tests on the sub-samples formed by the same payout firms
Some of the firms in our cash distribution sample firms have also conducted open market repurchases during the sample period. We zero in on these sample firms to investigate the robustness of our results. We have collected 22 capital-reduction payouts in total, 11 direct cash distributions and 11 open market repurchases.
[Insert Table 9 here]
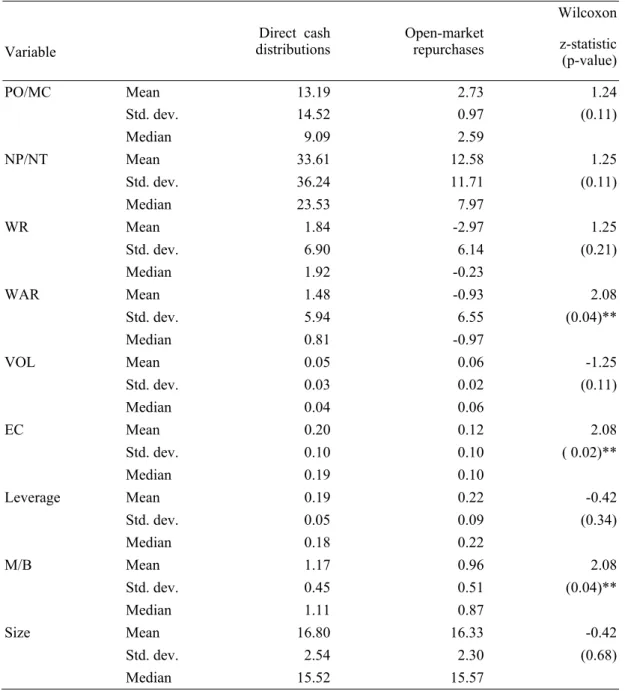
Table 9 reports the descriptive statistics of market conditional variables and firm characteristic variables for both direct cash distributions and open market repurchases. The results on the tests of median difference between these two samples show that the medians of the variables of WAR, EC, and MB associated with direct cash distributions are, respectively, significantly greater than their counterpart medians in the sample of open market repurchase. These univariate tests indicate that a firm’s stock price recently outperforms in the market, its level of excess cash is relatively higher and its MB ratio is relatively greater when it chooses the direct cash distribution as the payout method than when it chooses the open market repurchase.
[Insert Table 10 here]
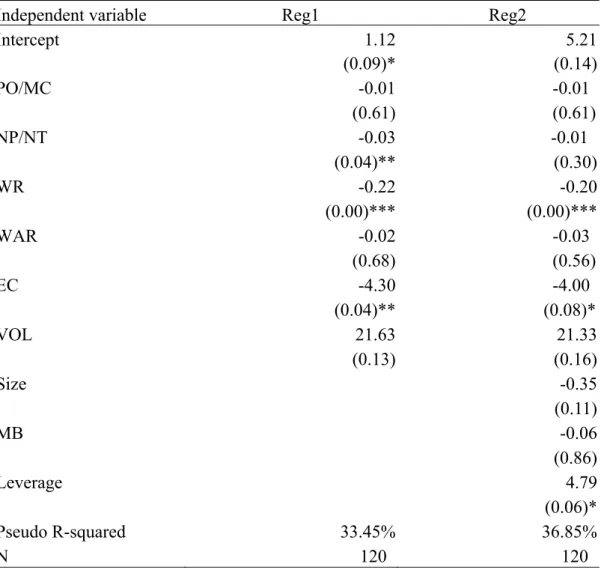
Table 10 shows the results of the logistic analyses on firms’ choice over direct cash distributions or open-market repurchases as their capital-reduction payout method conducted by the same firms. In the same-firm analyses the variables of firm characteristics as well as some of the market conditional variables are tend to be highly correlated. Therefore, we exclude the firm characteristic variables from our logistic analyses to avoid the issue of collinearity.
Regression 1 of Table 10 shows that the coefficient of PO/MC is negative and significantly different from zero at the 10% level, suggesting that when its size of capital-reduction payouts is relatively greater, a firm will be more likely to choose the direct
cash distribution as the payout method. Regression 2 of Table 10 shows that the coefficient of WR is negative and significantly different from zero at the 10% level, suggesting that when its stock performs relatively better, a firm will likely choose the direct cash distribution. Additionally, the coefficient of EC is also negatively significantly different from zero, indicating that when a firm’s excess cash level is relatively higher, it will likely choose the direct cash distribution. These results provide supporting evidence for the three hypotheses, proposed in this study, on firms’ choice of capital-reduction payout methods.
VI. Conclusions
The choice of payout methods has been the subject of research in payout policy. Our study enriches the literature on firms’ choice of their payout methods by empirically investigating how Taiwanese firms choose their payout methods—direct cash distribution versus open market repurchase—in their capital-reduction decisions.
Our empirical results reveal that of the determinants for capital-reduction payout methods we have investigated, the variable of WR has the strongest influence on firms’ choice over a direct cash distribution or an open market repurchase. The evidence suggests that Taiwanese firms use an open market repurchase to conduct a capital-reduction payout when their share price has plunged recently, suggesting that they could have taken the advantage of their shares being under-valued by investors and at the same time boost up their share prices. On the other hand, firms will go forward with a direct cash distribution for their capital-reduction payouts when their shares not being under-valued; and this is the flexibility direct cash distributions possess and not having been assumed by open market repurchases. The results are strongly consistent with the market-timing hypothesis.
Our results show that the size of a firm’s capital-reduction payout relative to its shares’ average trade volume is also a factor that capital-reduction firms will take into considerations in their choice of payout method. Our results indicate that Taiwanese capital-reduction firms tend to adopt a direct cash distribution as the payout method when the payout size relative to the average trade volume of shares is large. The evidence is consistent with the supply inelasticity of stocks hypothesis.
Finally, in some cases of our study our results reveal that the level of the excess cash will affect Taiwanese firms’ choice over a direct cash distribution or an open market repurchase. Firms with a lower level of excess cash tend to adopt share repurchases as the payout method to avoid the risk of cash shortage in cash distribution commitments. The result is consistent with the flexibility hypothesis.
Table 1: Distribution of capital-reduction payouts from 2006 through 2009
Our sample consists of 315 capital-reduction payouts from 2006 through 2009. Of these 315 capital-reduction payouts, 286 are associated with the open-market repurchase and 29 are with the direct cash distribution. Of the 286 repurchases, 196 are from the Taiwan Stock Exchange (TSE) and 90 are from the OTC market. Of the 29 cash distributions, 24 are from TSE and five are from the OTC market.
Total 286 29 Open-market repurchases Direct cash reductions
Exchange TSE 196 24 OTC 90 5 Total 286 29 Industry Traditional 101 6 High-tech 185 23 Total 286 29 Year 2006 40 5 2007 37 10 2008 184 6 2009 25 8
Table 2: Descriptive statistics of capital-reduction payouts
This table reports the descriptive statistics for market condition variables and firm characteristic variables on 315 capital-reduction payouts from 2006 through 2009. PO/MC is the ration of the expected payout size (PO) to the market value of payout firm’s equity (MC), while NP/NT is the ratio of the equivalent number of shares (NP) to be reduced to the average number of daily trading volume of payout firms (NT). WR is constructed as a three-month weighted average of the monthly buy-and-hold returns of payout firms and the weights are three for the most recent month, two for the next month, and one for the third month before the firm’s choice on the payout methods, while WAR is constructed as a three-month weighted average of the monthly average risk-adjusted returns of payout firms for each of the three months before the firm’s choice on the payout methods. VOL is a 12-quarter estimate of cash flow volatility of payout firms, while EC is the ratio of excess cash (the sum of cash and marketable securities) to total assets. Leverage is the debt ratio of long-term debts to total assets. M/B is market-to-book ratio. Size is the natural logarithm of total assets, a measure of firm size. The z-statistic is for the difference between cash distribution and repurchase sample medians using the Wilcoxon rank sum test. “*”, “*”, and “***” indicate significance at the 10%, 5%, and 1% levels.
Direct cash
distributions Open-market repurchases
Wilcoxon
Variable z-statistic (p-value)
PO/MC Mean 13.60 4.24 0.21 Std. dev. 18.59 7.12 (0.41) Median 9.09 3.20 NP/NT Mean 38.63 9.11 0.21 Std. dev. 60.37 11.65 (0.42) Median 11.59 5.03 WR Mean 2.57 -5.32 4.88 Std. dev. 5.61 7.37 (0.00)*** Median 2.65 -5.65 WAR Mean 0.85 -1.39 0.99 Std. dev. 5.27 6.33 (0.32) Median 0.60 -1.25 VOL Mean 0.04 0.05 -0.76 Std. dev. 0.02 0.03 (0.22) Median 0.04 0.04 EC Mean 0.18 0.12 1.77 Std. dev. 0.15 0.12 ( 0.04)** Median 0.16 0.08 Leverage Mean 0.23 0.33 -3.29 Std. dev. 0.11 0.14 (0.00)*** Median 0.21 0.33 M/B Mean 1.68 0.94 3.33 Std. dev. 2.05 0.70 (0.00)*** Median 1.32 0.77 Size Mean 16.42 15.54 1.77 Std. dev. 1.83 1.41 (0.04)** Median 15.76 15.37
Table 3: Abnormal returns around the announcement of capital reduction payouts
This table reports the average abnormal returns of a 41-day event window surrounding the announcement day (t=0) and the average cumulative abnormal returns for a three-day event period, CAR(0,2). The abnormal returns are calculated from the market model. We estimate the parameters of the market model by regressing 250 trading days of return data of the payout firm on the Taiwan Stock Exchange Value-weighted index from 270 to 21 days prior to the event day.
Direct cash distribution Open market repurchase
AR t-value AR t-value -20 -0.15 -0.38 -20 -0.24 -1.81 -19 0.00 0.00 -19 -0.22 -1.55 -18 0.19 0.38 -18 -0.17 -1.24 -17 0.36 1.23 -17 -0.37 -2.45 -16 -0.15 -0.36 -16 -0.17 -1.24 -15 0.33 1.01 -15 -0.13 -0.91 -14 -0.20 -0.91 -14 -0.19 -1.30 -13 -0.14 -0.46 -13 -0.21 -1.48 -12 0.59 1.50 -12 -0.37 -2.47 -11 -0.08 -0.17 -11 -0.36 -2.45 -10 0.50 1.29 -10 -0.44 -3.02 -9 -0.36 -0.90 -9 -0.34 -2.14 -8 -0.30 -0.94 -8 -0.52 -3.23 -7 -0.16 -0.55 -7 -0.58 -3.71 -6 0.02 0.06 -6 -0.58 -3.88 -5 -0.05 -0.17 -5 -0.37 -1.75 -4 0.15 0.30 -4 -0.18 -1.16 -3 -0.23 -0.73 -3 -0.57 -3.54 -2 -0.44 -1.22 -2 -0.81 -4.58 -1 -0.07 -0.16 -1 -0.62 -3.47 0 1.14 1.97 0 0.06 0.31 1 2.51 3.39 1 2.34 12.86 2 -0.20 -0.34 2 1.51 8.74 3 -0.55 -1.14 3 0.71 4.42 4 -0.47 -1.22 4 0.24 1.66 5 -0.31 -0.75 5 0.26 1.66 6 0.09 0.20 6 0.05 0.27 7 0.64 1.47 7 0.36 2.62 8 -0.50 -1.73 8 0.36 1.89 9 0.33 0.96 9 0.43 2.84 10 -0.01 -0.02 10 -0.10 -0.69
Table 3: Abnormal returns around the announcement of capital reduction payouts (contd.) 11 -0.77 -3.30 11 0.29 2.03 12 -0.66 -2.22 12 0.00 0.00 13 -0.33 -0.98 13 0.13 0.95 14 -0.43 -1.01 14 0.09 0.60 15 0.18 0.45 15 0.33 2.30 16 0.67 1.45 16 0.01 0.07 17 0.29 0.64 17 0.24 1.77 18 0.45 1.12 18 0.29 1.96 19 -0.53 -1.27 19 0.21 1.60 20 -0.10 -0.34 20 0.07 0.39 (0~2) 3.45 3.14 (0~2) 3.91 10.63
Table 4: Regression analyses on the cumulative abnormal returns
This table reports regression coefficients for various model specifications. The dependent variable is the abnormal return for a three-day event period, CAR(0,2). Dummy is a dummy variable equal to 1 if repurchase is the payout method and zero otherwise. PO/MC is the ration of the expected payout size (PO) to the market value of payout firm’s equity (MC), while NP/NT is the ratio of the equivalent number of shares (NP) to be reduced to the average number of daily trading volume of payout firms (NT). WR is constructed as a three-month weighted average of the monthly buy-and-hold returns of payout firms and the weights are three for the most recent month, two for the next month, and one for the third month before the firm’s choice on the payout methods, while WAR is constructed as a three-month weighted average of the monthly average risk-adjusted returns of payout firms for each of the three months before the firm’s choice on the payout methods. VOL is a 12-quarter estimate of cash flow volatility of payout firms, while EC is the ratio of excess cash (the sum of cash and marketable securities) to total assets. Leverage is the debt ratio of long-term debts to total assets. M/B is market-to-book ratio. Size is the natural logarithm of total assets, a measure of firm size. “*”, “*”, and “***” indicate significance at the 10%, 5%, and 1% levels.
Independent variable Reg1 Reg2
Intercept 2.54 9.21 (1.67) (2.12)** Dummy 0.56 0.08 (0.41) (0.06) PO/MC 0.07 0.07 (1.45) (1.43) NP/NT 0.02 0.03 (1.27) (1.52) WR -0.15 -0.14 (-2.82)*** (-2.57)*** WAR 0.04 0.03 (0.56) (0.42) EC -2.992 -2.09 (-1.00) (-0.68) VOL -4.26 -0.78 (-0.31) (-0.05) Size -0.40 (-1.60) MB -0.39 (-0.90) Leverage 0.77 (0.29) Adj. R-squared 2.76% 3.05% N 315 315
Table 5: Logistic analyses of the choice between open-market repurchases and direct cash distributions This table reports coefficient estimates, with p-value in parentheses, from binary logistics of 286 open-market repurchases and 29 direct cash distributions. The dependent variable takes on two values denoting open-market repurchases (Y = 1) and direct cash distributions (Y = 0). PO/MC is the ration of the expected payout size (PO) to the market value of payout firm’s equity (MC), while NP/NT is the ratio of the equivalent number of shares (NP) to be reduced to the average number of daily trading volume of payout firms (NT). WR is constructed as a three-month weighted average of the monthly buy-and-hold returns of payout firms and the weights are three for the most recent month, two for the next month, and one for the third month before the firm’s choice on the payout methods, while WAR is constructed as a three-month weighted average of the monthly average risk-adjusted returns of payout firms for each of the three months before the firm’s choice on the payout methods. VOL is a 12-quarter estimate of cash flow volatility of payout firms, while EC is the ratio of excess cash (the sum of cash and marketable securities) to total assets. Leverage is the debt ratio of long-term debts to total assets. M/B is market-to-book ratio. Size is the natural logarithm of total assets, a measure of firm size. “*”, “*”, and “***” indicate significance at the 10%, 5%, and 1% levels.
Independent variable Reg1 Reg2
Intercept 2.95 6.00 (0.00)*** (0.01)*** PO/MC -0.02 -0.02 (0.18) (0.17) NP/NT -0.03 -0.02 (0.00)*** (0.06)* WR -0.14 -0.12 (0.00)*** (0.00)*** WAR -0.01 -0.02 (0.86) (0.65) EC -3.37 -2.71 (0.04)** (0.18) VOL 6.36 10.20 (0.55) (0.40) Size -0.26 (0.08)* MB -0.23 (0.44) Leverage 3.44 (0.07)* Pseudo R-squared 15.87% 18.16% N 315 315
Table 6: Distribution of capital-reduction payouts with a completion rate of at least 50% The sample consists of 120 capital-reduction payouts from 2006 through 2009. Of these 120 capital-reduction payouts, 91 are associated with the open-market repurchase and 29 are with the direct cash distribution. Of the 91 repurchases, 64 are from the Taiwan Stock Exchange (TSE) and 27 are from the OTC market. Of the 29 cash distributions, 24 are from TSE and five are from the OTC market.
Total 91 29 Open-market repurchases Direct cash reductions
Exchange TSE 64 24 OTC 27 5 Total 91 29 Industry Traditional 32 6 High-tech 59 23 Total 91 29 Year 2006 10 5 2007 11 10 2008 61 6 2009 9 8
Table 7: Descriptive statistics of capital-reduction payouts with a completion rate of at least 50%
This table reports the descriptive statistics for market condition variables and firm characteristic variables on 120 capital-reduction payouts from 2006 through 2009. PO/MC is the ration of the expected payout size (PO) to the market value of payout firm’s equity (MC), while NP/NT is the ratio of the equivalent number of shares (NP) to be reduced to the average number of daily trading volume of payout firms (NT). WR is constructed as a three-month weighted average of the monthly buy-and-hold returns of payout firms and the weights are three for the most recent month, two for the next month, and one for the third month before the firm’s choice on the payout methods, while WAR is constructed as a three-month weighted average of the monthly average risk-adjusted returns of payout firms for each of the three months before the firm’s choice on the payout methods. VOL is a 12-quarter estimate of cash flow volatility of payout firms, while EC is the ratio of excess cash (the sum of cash and marketable securities) to total assets. Leverage is the debt ratio of long-term debts to total assets. M/B is market-to-book ratio. Size is the natural logarithm of total assets, a measure of firm size. The z-statistic is for the difference between cash distribution and repurchase sample medians using the Wilcoxon rank sum test. “*”, “*”, and “***” indicate significance at the 10%, 5%, and 1% levels.
Direct cash
distributions Open-market repurchases
Wilcoxon
Variable z-statistic (p-value)
PO/MC Mean 13.60 4.64 0.21 Std. dev. 18.59 10.29 (0.42) Median 9.09 3.08 NP/NT Mean 38.63 9.05 0.21 Std. dev. 60.37 11.26 (0.42) Median 11.59 4.65 WR Mean 2.57 -5.27 4.88 Std. dev. 5.61 6.15 (0.00)*** Median 2.65 -5.45 WAR Mean 0.85 -1.52 1.06 Std. dev. 5.27 5.93 (0.28) Median 0.60 -1.45 VOL Mean 0.04 0.05 -1.06 Std. dev. 0.02 0.03 (0.14) Median 0.04 0.05 EC Mean 0.18 0.13 1.91 Std. dev. 0.15 0.14 ( 0.03)** Median 0.16 0.08 Leverage Mean 0.23 0.34 -3.61 Std. dev. 0.11 0.14 (0.00)*** Median 0.21 0.31 M/B Mean 1.68 0.98 3.19 Std. dev. 2.05 0.75 (0.00)*** Median 1.32 0.81 Size Mean 16.42 15.43 1.49 Std. dev. 1.83 1.26 (0.07)* Median 15.76 15.39
Table 8: Logistic analyses of the choice between open-market repurchases and direct cash distributions with a completion rate of at least 50%
This table reports coefficient estimates, with p-value in parentheses, from binary logistics of 91 open-market repurchases and 29 direct cash distributions. The dependent variable takes on two values denoting open-market repurchases (Y = 1) and direct cash distributions (Y = 0). PO/MC is the ration of the expected payout size (PO) to the market value of payout firm’s equity (MC), while NP/NT is the ratio of the equivalent number of shares (NP) to be reduced to the average number of daily trading volume of payout firms (NT). WR is constructed as a three-month weighted average of the monthly buy-and-hold returns of payout firms and the weights are three for the most recent month, two for the next month, and one for the third month before the firm’s choice on the payout methods, while WAR is constructed as a three-month weighted average of the monthly average risk-adjusted returns of payout firms for each of the three months before the firm’s choice on the payout methods. VOL is a 12-quarter estimate of cash flow volatility of payout firms, while EC is the ratio of excess cash (the sum of cash and marketable securities) to total assets. Leverage is the debt ratio of long-term debts to total assets. M/B is market-to-book ratio. Size is the natural logarithm of total assets, a measure of firm size. “*”, “*”, and “***” indicate significance at the 10%, 5%, and 1% levels.
Independent variable Reg1 Reg2
Intercept 1.12 5.21 (0.09)* (0.14) PO/MC -0.01 -0.01 (0.61) (0.61) NP/NT -0.03 -0.01 (0.04)** (0.30) WR -0.22 -0.20 (0.00)*** (0.00)*** WAR -0.02 -0.03 (0.68) (0.56) EC -4.30 -4.00 (0.04)** (0.08)* VOL 21.63 21.33 (0.13) (0.16) Size -0.35 (0.11) MB -0.06 (0.86) Leverage 4.79 (0.06)* Pseudo R-squared 33.45% 36.85% N 120 120
Table 9: Descriptive statistics of capital-reduction payouts by firms having conducted both direct cash distributions and open market repurchases
This table reports the descriptive statistics for market condition variables and firm characteristic variables on 22 capital-reduction payouts by firms that have conducted both direct cash distributions and open market repurchases. PO/MC is the ration of the expected payout size (PO) to the market value of payout firm’s equity (MC), while NP/NT is the ratio of the equivalent number of shares (NP) to be reduced to the average number of daily trading volume of payout firms (NT). WR is constructed as a three-month weighted average of the monthly buy-and-hold returns of payout firms and the weights are three for the most recent month, two for the next month, and one for the third month before the firm’s choice on the payout methods, while WAR is constructed as a three-month weighted average of the monthly average risk-adjusted returns of payout firms for each of the three months before the firm’s choice on the payout methods. VOL is a 12-quarter estimate of cash flow volatility of payout firms, while EC is the ratio of excess cash (the sum of cash and marketable securities) to total assets. Leverage is the debt ratio of long-term debts to total assets. M/B is market-to-book ratio. Size is the natural logarithm of total assets, a measure of firm size. The z-statistic is for the difference between cash distribution and repurchase sample medians using the Wilcoxon rank sum test. “*”, “*”, and “***” indicate significance at the 10%, 5%, and 1% levels.
Direct cash
distributions Open-market repurchases
Wilcoxon Variable z-statistic (p-value)
PO/MC Mean 13.19 2.73 1.24 Std. dev. 14.52 0.97 (0.11) Median 9.09 2.59 NP/NT Mean 33.61 12.58 1.25 Std. dev. 36.24 11.71 (0.11) Median 23.53 7.97 WR Mean 1.84 -2.97 1.25 Std. dev. 6.90 6.14 (0.21) Median 1.92 -0.23 WAR Mean 1.48 -0.93 2.08 Std. dev. 5.94 6.55 (0.04)** Median 0.81 -0.97 VOL Mean 0.05 0.06 -1.25 Std. dev. 0.03 0.02 (0.11) Median 0.04 0.06 EC Mean 0.20 0.12 2.08 Std. dev. 0.10 0.10 ( 0.02)** Median 0.19 0.10 Leverage Mean 0.19 0.22 -0.42 Std. dev. 0.05 0.09 (0.34) Median 0.18 0.22 M/B Mean 1.17 0.96 2.08 Std. dev. 0.45 0.51 (0.04)** Median 1.11 0.87 Size Mean 16.80 16.33 -0.42 Std. dev. 2.54 2.30 (0.68) Median 15.52 15.57
Table 10: Logistic analyses of the choice between open-market repurchases and direct cash distributions by firms having conducted both types of payouts
This table reports coefficient estimates, with p-value in parentheses, from binary logistics of 11 open-market repurchases and 11 direct cash distributions. The dependent variable takes on two values denoting open-market repurchases (Y = 1) and direct cash distributions (Y = 0). PO/MC is the ration of the expected payout size (PO) to the market value of payout firm’s equity (MC), while NP/NT is the ratio of the equivalent number of shares (NP) to be reduced to the average number of daily trading volume of payout firms (NT). WR is constructed as a three-month weighted average of the monthly buy-and-hold returns of payout firms and the weights are three for the most recent month, two for the next month, and one for the third month before the firm’s choice on the payout methods, while WAR is constructed as a three-month weighted average of the monthly average risk-adjusted returns of payout firms for each of the three months before the firm’s choice on the payout methods. VOL is a 12-quarter estimate of cash flow volatility of payout firms, while EC is the ratio of excess cash (the sum of cash and marketable securities) to total assets. “*”, “*”, and “***” indicate significance at the 10%, 5%, and 1% levels.
Independent variable Reg1 Reg2
Intercept 0.67 2.28 (0.64) (0.06)* PO/MC -0.23 (0.07)* NP/NT -0.03 (0.30) WR -0.15 (0.09)* WAR -0.13 (0.23) EC -11.69 (0.07)* VOL 13.238 (0.60) Pseudo R-squared 36.67% 36.42% N 22 22
References
1. Bagwell, L., 1992, “Dutch auction repurchases: An analysis of shareholder heterogeneity,” Journal of Finance 47, 71-140.
2. Brickley, J., 1983, “Shareholder wealth, information signaling, and the specially designated dividend: An empirical study,” Journal of Financial Economics, 12, 187-209. 3. Comment, R., and G. Jarrell, 1991, “The relative power of Dutch-auction and fixed-price
self-tender offers and open market share repurchases,” Journal of Finance 46, 1243-1271.
4. DeAngelo, H., L. DeAngelo, and D. Skinner, 2000, “Special dividends and the evolution of dividend signaling,” Journal of Financial Economics, 57, 309-354.
5. DeAngelo, H., L. DeAngelo, and D. Skinner, 2008, “Corporate payout policy,” Foundations and Trends in Finance 3, 95-287.
6. Hardford, J., S. A. Mansi, and W. F. Maxwell, 2008, “Corporate governance and firm cash holdings in the US,” Journal of financial economics 87, 535-555.
7. Guay, W., and J. Harford, 2000, “The cash-flow permanence and information content of dividend increases versus repurchases,” Journal of Financial Economics 57, 385-415. 8. Hodrick, L., 1999, “Does stock price elasticity affect corporate financial decisions?”
Journal of Financial Economics 52, 225-256.
9. Howe, K., J. He, and G. Kao, 1992, “One-time cash flow announcements and free cash-flow theory: Share repurchases and special dividends,” Journal of Finance 47, 1963-1975.
10. Ikenberry, D., J. Lakonishok, and T. Vermaelen, 1995, “Market underreaction to open market share repurchases,” Journal of Financial Economics39, 181-208.
11. Jagannathan, M., C. P. Stephens, and M. S. Weisbach, 2000, “Financial flexibility and the choice between dividends and stock repurchases,” Journal of Financial Economics 57, 355-384.
12. Jensen, M. C., 1986, “Agency costs of free cash flow, corporate finance, and takeovers,” American Economic Review76, 323–329.
13. Lang, L., and R. Litzenberger, 1989, “Dividend announcements: Cash flow signaling vs. free cash flow hypothesis,” Journal of Financial Economics24, 181-192.
14. Miller, M., and F. Modigliani, 1961, “Dividend policy, growth, and the valuation of shares,” Journal of Business, 34, 411-433.
15. Oded, J., 2005, “Why do firms announce open-market repurchase programs?” Review of Financial Studies 18, 271-300.
16. Oded, J., 2008, “Payout policy, financial flexibility, and agency costs of free cash flow,” Working paper, Boston University, Boston, MA.
17. Peyer, U., and T. Vermaelen, 2009, “The nature and persistence of buyback anomalies,” Review of Financial Studies 22, 1693-1746.
18. Skinner, D., 2008, “The evolving relation between earnings, dividends, and stock repurchases,” Journal of Financial Economics 87, 582-609.