國
國
國
國
立
立
立
立
交
交
交
交
通
通
通
通
大
大
大
大
學
學
學
學
財 務 金 融 研 究 所
碩 士 論 文
債券到期期間結構與盈餘管理行為之關聯性
The Relationship between Debt Maturity Structure and
Earnings Management
研 究 生:廖尉如
指導教授:許和鈞 博士
林建榮 博士
債券到期期間結構與盈餘管理行為之關聯性
The Relationship between Debt Maturity Structure and
Earnings Management
研 究 生:廖尉如 Student : Wei-Ju Liao
指導教授:許和鈞 博士 Advisors : Dr. Her-Jiun Sheu
林建榮 博士 Dr. Jane-Raung Lin
國立交通大學
財務金融研究所碩士班
碩士論文
A Thesis
Submitted to Graduate Institute of Finance
National Chiao Tung University
in partial Fulfillment of the Requirements
for the Degree of
Master of Science
in
Finance
June 2007
Hsinchu, Taiwan, Republic of China
中華民國九十六年六月
債券到期期間結構與盈餘管理行為之關聯性
研究生 : 廖尉如
指導教授: 許和鈞 博士
林建榮 博士
國立交通大學財務金融研究所碩士班
國立交通大學財務金融研究所碩士班
國立交通大學財務金融研究所碩士班
國立交通大學財務金融研究所碩士班
2007 年
年
年 6 月
年
月
月
月
摘要
摘要
摘要
摘要
過去研究舉債融資策略的學者們,已經藉由透過許多不同的假說理論,彰顯出債 券到期期間決策的重要性。而近年來的研究則另外強調,當公司管理者和股東之 間的利益出現歧異時,對公司發行債券之到期期間也會造成影響。本篇文章目的 在於探討當公司管理者進行盈餘管理的動作,是否對於債券到期期間長短的選擇 有所影響。本論文以初次公開發行上市的公司為研究樣本,並且認定債券到期期 間和負債兩者為同時決定的內生變數。實證結果發現公司管理者的盈餘管理行為 確實影響公司公開上市一年後所發行債券之到期期間長短的選擇。在初次公開發 行時,盈餘管理行為的程度越嚴重的公司,將會有愈強的意圖去發行到期期間較 長的債券,以規避頻繁的外部監督和重複發行短期債券的高成本。 關鍵字:債券到期期間、盈餘管理、初次公開發行。The Relationship between Debt Maturity Structure and
Earnings Management
Student: Wei-Ju Liao Advisors : Dr. Her-Jiun Sheu
Dr. Jane-Raung Lin
Graduate Institute of Finance
National Chiao Tung University
June 2007
ABSTRACT
Researchers of debt financing policies have already shown the importance of debt maturity by means of different hypotheses. Recent research emphasizes that the discrepancy of interests between managers and shareholders also influences debt maturity choice. The aim of this article attempts to explore how the corporate debt maturity structure changes in terms of the manager’s behavior of earnings management. Using initial public offerings (IPOs) firms as the sample and modeling debt maturity and leverage determined endogenously and simultaneously, we conclude that manager’s behavior of earnings management causes subsequent larger portion of long-maturity debt issued in the following year after IPOs. Managers of aggressive firms in the period of IPOs have the incentive to lengthen the maturity of corporate debt hereafter in order to prevent frequent monitoring by the market and higher issuing cost for rolling over short-maturity debt.
誌 謝
本篇論文能夠順利的完成,首先要感謝指導教授林建榮老師及許和鈞老 師,在論文寫作的過程中給予我耐心的諄諄教導以及細心的討論修正。在此,獻 上我最由衷的謝意。同時,也感謝口試委員周德瑋老師、陳勝源老師,對於本篇 論文的詳細閱讀,並提供了相當多寶貴的建議和指正,使我受益良多,也讓本篇 論文更趨於完善。 感謝在過去兩年的碩士生涯中陪伴我度過這七百多個日子的同學以及朋友 們。謝謝阿榮小隊的每位成員:嘉瑜、琡惠、明琪、士榮及聖文,在撰寫論文的 過程中有你們一路相陪,為繁忙壓力的生活添增許多的歡樂,我真的很開心也很 感激。感謝翠伶、倩如、凱秩在統計軟體使用上的幫忙,讓我在論文的實證部份 得以順利完成。謝謝戴慈時常邀約去看電影以及去妳家烤肉唱歌、賴 Q 不時地找 我挑踩地雷以及拍下我許多有趣的照片、維峻平日的鼓勵以及布袋戲的提供,都 讓我日子過的很愉快;也感謝會算命又總是毒舌搞笑的廷峻、會和我討論電視劇 的麻將算台后嘉琳以及其他財金所的同學們,這兩年的相處讓我擁有許多歡樂且 珍貴的回憶;謝謝財金所所有老師的教導;謝謝所辦小姐文淇和佳芸的照顧;謝 謝曾經幫助過我的學長姐、學弟妹們;另外,也謝謝和我一起來新竹努力奮鬥的 大學同學們:夢珍、若馨、建中和子綺,給我相當多的支持與鼓勵。謝謝你們! 最後,要感謝我的家人,不管在何時何地都給予我默默的支持和關心,讓 我能夠無後顧之憂地專心於課業之上,朝著自己的目標前進。沒有你們就沒有今 天的我,有你們的支持與照顧,今天我才能順利地完成學業,這份榮耀是屬於你 們的。謹以此論文,獻給我最摯愛的家人、教導過我的師長以及關心我的所有朋 友們。 廖尉如 謹誌於國立交通大學財務金融研究所碩士班 中華民國九十六年六月於新竹Content
摘要
摘要
摘要
摘要... i
ABSTRACT... ii
1.
Introduction... 1
2.
Literature Review ... 3
2.1 The Maturity Structure of Corporate Debt... 3
2.2 Earnings Management... 7
3.
Data and Descriptive Statistics ... 10
3.1 Descriptive Statistics of debt maturity and Sample
Characteristics...11
3.2 Measure of earnings management...11
3.3 Other Exogenous Variables Description ... 13
4.
Methodology ... 17
4.1 Ordinary Least Squares Regression Analysis ... 17
4.2 Two-stage Regression Analysis... 18
5.
Empirical Results... 19
5.1 Ordinary Least Squares Regression Results ... 19
5.2 Two-stage Regression Results ... 20
5.3 Robustness Checks ... 21
6.
Conclusion... 21
Listing Table
Figure 1
Time line for collecting data... 10
Table I
Statistics for the Percentage of Long-term Debt That Matures in More Than One, Two, Three, Four, and Five Years from the Fiscal Year-End... 25
Table II
Characteristics of Sample... 26
Table III
Descriptive Statistics of Sample... 28
Table IV
Ordinary Least Squares Regression Estimating the Determinants ofDebt Maturity
... 32
Table V
Two-stage Regression Coefficients Explaining the Percentage of Total Long-term Debt That Matures in More Than 5 Years... 34
1. Introduction
Over the past few decades of research on debt financing and debt maturity structure choice, a number of issues have appeared, each of which has recognized the importance of leverage and debt maturity in the literature concerning capital structure. Particularly, increasing attention has been given to research on debt maturity structure in the recent years. Earlier literature regarding the role of debt maturity emphasizes the importance on reducing agency conflicts and underinvestment problems. On the basic assumption of perfect alignment of manager-shareholder interests, these problems can be alleviated by issuing short-maturity debt. Nevertheless, recent studies have proposed a new point of view. They state that managers may be unwilling to choose the optimal financing choice on behalf of shareholders and adopt self-imposed monitoring if the interests between managers and shareholders are not aligned because of the division of ownership and control. Hence, managerial stock ownership, regarded as a proxy of alignment of manager-shareholder interests, is considered another determinant of debt maturity structure hereafter.
In this article, we extend the above-mentioned concept of the discrepancy of interests between managers and shareholders, and then deal with the subject of relationship between this concept and debt maturity structure. We emphasize the behavior of managers tending to deceive outside potential investors and the consequent influence on determining debt maturity choice. Potential investors usually pay attention to financial reports of corporations. They consider reported earnings the symbol of corporations’ performance before firms enter the capital market. Therefore, managers planning to reap private profits in the financing process may be likely to manipulate reported earnings upward. Earnings management causes the overoptimism of outside investors about firms’ future performance and misleads their investing strategies. This process always causes an injury to investors’ profits afterward, and
probably influences the allocation of corporate debt issued in the subsequent time. Previous studies present that low-quality firms choose more long-term debt, because they have to bear higher costs of rolling over short-term debt if their true quality is revealed. We conjecture that firms with the behavior of earnings management are likely to have the same incentive to do so. When managers manipulate reported earnings by adjusting discretionary accounting accruals for some purposes favorable for them, managers also prefer issuing more long-term debt afterward. Like what low-quality firms think about, managers attempt to avoid higher issuing cost of debt as more information about the firm is disclosed over time. On the strength of this deduction, this study argues that managers tend to choose longer-maturity debt after they have the behavior of earnings management.
In this article, we sample firms raising money by means of initial public offerings (IPOs) because significant evidence in previous literature shows that IPO is an adequate opportunity for managers to manipulate reported earnings. Furthermore, firms which manipulate the financial reports for proceeding earnings management in their IPOs also like to pay close attention to their maturity structure of corporate debt. Previous studies argue that these firms with earnings management in IPOs have to spend more time waiting for refinancing by seasoned equity offerings (SEOs). Thus, these firms have the motive to issue corporate debt to raise other funds needed in the future. This study mainly examines whether the earnings management’s level of IPO firms influences the debt maturity structure of them in the following year.
We explore the relation between debt maturity structure and the behavior of earnings management, using a sample of 830 IPO firms which go public in a period from 1991 to 2003. After controlling other variables, the result supports our hypothesis that a positive relation between debt maturity choice and the behavior of earnings management exists.
The remainder of this paper is divided into five sections. Section 2 is a general review of previous literature, addressing both theoretical and empirical aspects of the determinants influencing debt maturity structure and the influence of earnings management upon corporations’ performance. In Section 3, procedures for collecting data needed, descriptive statistics of sample, and definition of variables used are presented. Section 4 presents the methodology used to progress our empirical research. Section 5 summarizes the empirical results about the relationship between debt maturity structure and earnings management which we study intensively. Finally, conclusions are drawn in Section 6.
2. Literature Review
2.1 The Maturity Structure of Corporate Debt
Since Myers’ (1977) research, a number of studies have investigated the factors which influence the maturity structure of corporate debt, and the literature which delves deeply into this issue offers different kinds of hypotheses about the determinants. In this section, we compile the research and contemplate these hypotheses successively.
I. Contracting Cost Hypothesis
Myers (1977) states that underinvestment problem occurs in the firms with risky debt financing, and he argues that decision of debt maturity can reduce conflicts between shareholders and bondholders. When firms with risky debt financing in their capital structure proceed with the investment projects, profit gained from the projects has to be divided up between shareholders and bondholders. Bondholders can always reap a fixed amount of profit from investment projects; however, sometimes shareholders may not gain the satisfied normal return. Thus, it is possible for shareholders to give up some positive net present value investment projects.
Consequently, underinvestment problem for bondholders occurs. Myers argues that issuing short-term debt can eliminate unwillingness to invest when short-term debt matures before the date to exercise the investment options. Thus, Myers infers that firms having more growth options in their investment projects should issue shorter-term debt in their capital structure.
Barclay and Smith (1995) and Stohs and Mauer (1996) argue that firm size also plays a substantial role on debt maturity determination. Barclay and Smith state that issuance costs of public issues possess a large amount of fixed costs and have scale economics. Small firms which cannot easily gain the advantage of scale economics will prefer private debt to public debt and therefore have more short-term debt. On the other side, Stohs and Mauer argue that small firms have more opportunities to face other types of conflicts between shareholders and bondholders, so they are willing to issue more short-term debt to remove these conflicts.
Smith (1986) also argues that regulated firms have longer-maturity debt than unregulated firms because the managers of regulated firms have less discretion upon future investment decisions.
II. Signaling and Liquidity Risk Hypotheses
Flannery (1986) does research about the decision of corporate debt maturity in terms of signaling. When information asymmetry exists in the bond market, outside investors may misunderstand the true quality of firms, and then firms with high quality suffer.1 If debt issuing is costless, only a pooling equilibrium of short-term debt occurs because low-quality firms can mimic high-quality firms’ choices without paying any additional cost. Hence, the long-term debt market ceases to operate. However, high-quality firms can sometimes signal their true quality to investors
1
Flannery establishes a two-period model of debt maturity choice under information asymmetry to show the negative misinformation value, which reduces firms’ value, of high-quality firms in the pooling equilibrium.
effectively when transaction costs are positive. Low-quality firms will self-select to issue long-term debt if costs of mimicking high-quality firms’ choices, i.e. rolling over short-term debt, are too high for them. Therefore, a separate equilibrium is achievable when high-quality firms choose to issue short-term debt in order to signal their true value. Flannery argues that different outcomes of equilibriums depend on the distribution of firms’ quality and the magnitude of underwriting costs for corporate debt.
Diamond (1991) develops a different signaling model about credit rating to analyze debt maturity structure. Although firms with private information about future profitability like to issue short-term debt in order to gain a benefit from refinancing, firms also encounter the liquidity risk that leads to be incapable of raising new funds at the same time. Diamond argues that different levels of firms’ credit rating influence the decision of debt maturity. For firms with highest credit rating, it is more possible to issue short-term debt because these firms face smaller refinancing risk. Besides, firms with lowest credit rating also issue short-term debt because they have high opportunity of having no enough income to support the long-term debt. Finally, firms with credit rating between these two types of firms issue more long-term debt. In this paper, Diamond presents that the relationship between debt maturity and borrowers’ credit rating is not a monotonic function.
For testing empirically the theories of Flannery and Diamond to see the effects of risk and information asymmetry upon determining debt maturity, Berger, Espinosa-Vega, Frame, and Miller (2005) collect 6,000 commercial loans from 53 large U.S. banks as data and use small business credit scoring (SBCS) technology being used to reduce information asymmetries. Empirical research results in this paper have the same conclusion with Flannery’s and Diamond’s only for low-risk firms. Debt maturity is an upward-sloping function of risk rating for these firms. This paper
also confirms the notion that information asymmetry plays a critical role in determining corporate debt maturity.
Besides, leverage is also concerned in viewpoint of liquidity risk in Stohs and Mauer’s (1996) paper. Because firms with higher leverage may face more liquidity risks than firms with lower leverage, they will have stronger incentive to use longer-term debt.
III. Matching Hypothesis
Matching principle is mentioned in Stohs and Mauer’s (1996) research. Earlier papers such as Myers’ (1977) and Barclay and Smith’s (1995) also explained this hypothesis.2 Myers argues that firms matching their debt maturity to asset maturity can avoid the agency conflicts between shareholders and debt investors by assuring that debt repayments can be scheduled to correspond with the decline in future value of assets. Thus, Stohs and Mauer also argue that the maturity of debt changes positively with that of assets.
On the other hand, Morris (1976) advances that making debt maturity approximately equal to assets life may not be the least risky maturity policy. Morris explores the effects of debt maturity on variance of net income and argues that the correlation between interest rates and net operating income influences the optimal debt maturity choice. For long-term assets, long-maturity debt has the advantage to decrease the uncertainty risk of interest rates. Nevertheless, short-term debt can mitigate the uncertainty of net income obtained from assets when the covariance of future interest rates and net operating income is positive highly. Hence, Morris argues that departing from the hedging policy which matches debt maturity to assets maturity may reduce the fluctuation of net income and the risk to the shareholders.
2
Barclay and Smith (1995) argue that the maturity of a firm’s intangible assets can also be a determinant of the maturity of corporate debt when they analyze Myers’ (1977) research about matching hypothesis.
IV. Taxation Hypothesis
Controversial conclusions about taxation hypothesis are presented in previous paper. Brick and Ravid (1985) argue that firms like to issue more short-term debt when the term structure has a negative slope. Based on expectation hypothesis, it is rational that issuing short-term debt can increase the firm’s value when the term structure’s slope is negative because of expected lower short-term interest rate in the future. Brick and Ravid (1991) expand the tax-based debt maturity model and argue that uncertainty of interest rates causes a favor for long-maturity debt. However, Lewis (1990) argues that taxation is not an effective determinant of optimal debt maturity and the debt maturity structure is irrelevant with the firm’s value.
V. The Manager’s behavior and Debt Maturity Structure
Datta, Iskandar-Datta, and Raman (2005) argue that managerial stock ownership is also a critical factor influencing corporate debt maturity structure.3 Agency problem between managers and shareholders happens because the interests of managers do not align those of shareholders. Less outside monitoring which the manager encounters will aggravate the conflict more seriously. Hence, Datta, Iskandar-Datta, and Raman infer that short-term debt can alleviate the conflict because it subjects managers to more frequent monitoring from investors and underwriters. It is rational to believe that more long-term debt is issued if the alignment of interests between shareholders and managers is fragile.
2.2 Earnings Management
In a review of the earnings management literature, Healy and Wahlen (1999) present that earnings management occurs when managers use judgment in financial reports and in structuring transactions to alter financial reports to either mislead some
3
Because Datta, Iskandar-Datta, and Raman (2005) think that previous research ignore the discrepancy of interests between shareholders and managers and assume perfect alignment of them.
stakeholders about the underlying economic performance of the company or to influence contractual outcomes that depend on reported accounting numbers. We like to discuss the managers’ behavior of misleading shareholders when firms aim to enter the equity market for raising investment funds in this article.
Previous literature about earnings management always discusses the relationship between earnings management and equity market performance. Teoh, Welch, and Wong (1998a) provide empirical results to show that poorer stock return performance occurs when larger discretionary current accruals are manipulated by managers in the procedure of equity offering. The reason is that investors may be misinformed by manipulated financial reports before issuing and be overoptimistic about the future profitability of these firms. Investors always pay attention to firm’s current earnings and see them as the symbol of firm’s performance. If they cannot find out the exaggeration of the earnings reports, investors will overstate performance of the firm and pay a higher price. However, the real information about firms will reveal when time goes by. Subsequent financial reports will adjust previous manipulated discretionary accruals and then investors can understand true value of the firms by inspecting them. As investors find out that they were too optimistic about the firm before, they will lose the confidence and modify the evaluation of it. Thus, the price of stocks descends. If firms have greater earnings management when they issue equity, they will encounter larger correction of stock price in next years. Teoh, Welch, and Wong argue that firms with higher discretionary accruals, meaning greater earnings management, will have poorer stock return performance in the subsequent three years. Besides, these firms need more time than other firms which have less earnings management to seek for a seasoned equity offering in the capital market in the future. Afterward, Teoh, Welch, and Wong (1998b) and Rangan (1998) use seasoned equity offerings of firms as the data to research this issue. Empirical results also support
preceding presentation.
In sum, investors’ judgments about firms’ performance are factually influenced by managers’ manipulation in discretionary accruals when they enter into the equity market. Investors extrapolate pre-issue earnings and cannot figure out the behavior of earnings management by issuers. Therefore, the firms are overvalued and the issues will have an over high price. However, borrowers become disappointed when the high earnings cannot be sustained after issuing. It results the underperformance of firms in successive years. In this article, we like to emphasize the information asymmetry between outside investors and issuers generated from earnings management.
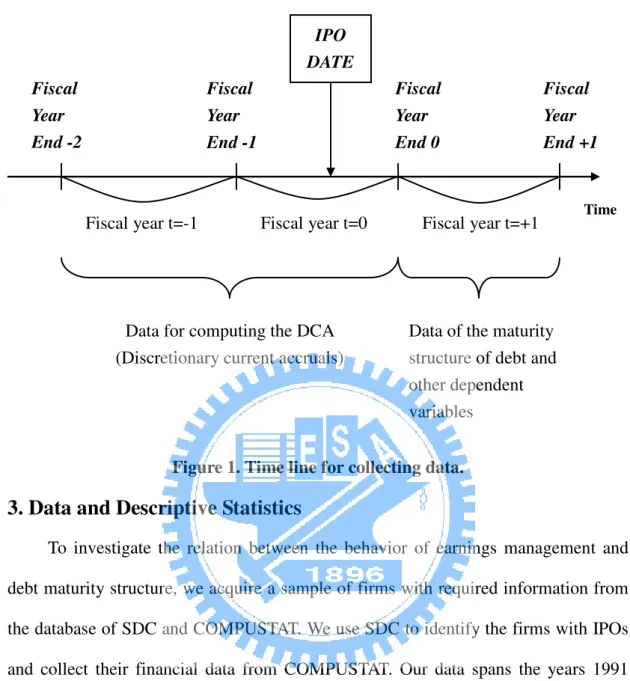
Figure 1. Time line for collecting data.
3. Data and Descriptive Statistics
To investigate the relation between the behavior of earnings management and debt maturity structure, we acquire a sample of firms with required information from the database of SDC and COMPUSTAT. We use SDC to identify the firms with IPOs and collect their financial data from COMPUSTAT. Our data spans the years 1991 through 2003. For calculating the discretionary current accruals (DCAs) and other independent variables, firms must have successive four-year data available in COMPUSTAT. We also constraint our sample to firms with Standard Industrial Classification (SIC) codes from 2000 to 5999 in order to compare our results with previous studies. Therefore, our sample excludes agriculture, forestry, fishing, mining, construction, finance, insurance, real estates, services, and public administration industries. Financial industries firms are regarded different from general manufacturing industries firms and have no available data in the database. We do not
IPO DATE Fiscal Year End -2 Fiscal Year End -1 Fiscal Year End 0 Fiscal Year End +1
Fiscal year t=-1 Fiscal year t=0 Fiscal year t=+1
Data for computing the DCA (Discretionary current accruals)
Data of the maturity structure of debt and other dependent variables
concern the services industries firms and public administration industries due to their characters.
3.1 Descriptive Statistics of debt maturity and Sample Characteristics
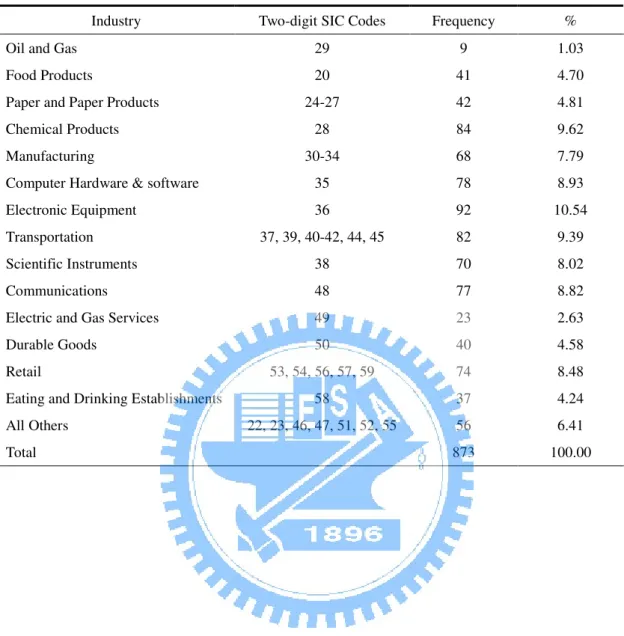
COMPUSTAT lists the amount of long-term debt payable at fiscal year-end in more than 1 year through more than 5 years. We calculate the percentage of total long-term debt which matures in more than 1 year through more than 5 years to measure the maturity structure of corporate debt. Percentage of long-term debt with less than 0 percent or more than 100 percent is discarded. The full sample contains 1,746 observations according to above collection criteria.Table I provides the descriptive statistics of debt maturity structure. The sample consists of 1,746 observations including 873 IPO firms and 873 non-IPO firms between 1991 and 2003. Non-IPO firms with similar firm sizes to IPO firms are used as the comparison firms. Panel A and B present the percentage of long-term debt that matures in more than one through five years of IPO and non-IPO firms respectively. We find that non-IPO firms have a little more long-term debt than IPO firms on average. It is because IPO firms have another access to raising money they need. Firms with less portion of leverage will also have less long-term debt issued. Table II exhibits the descriptive statistics of the 873 IPO firms in our sample for the research. Panel A shows the time distribution of 873 IPO firms between 1991 and 2003, and Panel B reports the SIC distribution of these IPO firms. From the table we find that there is a concentration of IPO firms in the electronic equipment, chemical products, and transportation industries. Computer and communication industries also hold a large portion of the data. Besides, it shows that there is a huge decline of number of IPOs from 2001 to 2003 in our sample period.
3.2 Measure of earnings management
the behavior of earnings management during IPO process. Figure 1 illustrates the timing convention in our research. We set the fiscal year where IPOs occur to be year 0. Therefore, the fiscal year before IPOs’ occurrence is defined to be year -1, and the fiscal year following IPOs is year +1.
Following Teoh, Welch, and Wong’s (1998a) approach, we also use discretionary current accruals (DCAs) to measure the level of earnings management. Accruals include reported earnings consisting of cash flows from operations and accounting adjustments. Total accruals can be divided into current and long-term components. We emphasize on the influence of current accruals because managers have more discretion upon them.
Using COMPUSTAT annual items, the procedure to calculate discretionary current accruals is as follows. First of all, we calculate current accruals (CA) as
[ ]
[ ].
CA accounts receivables inventory other current assets accounts payable tax payable other current liabilities
≡ ∆ + +
−∆ + + (3.2.1)
Afterwards, we need to calculate nondiscretionary current accruals (NDCA). Following Teoh, Welch, and Wong (1998a), nondiscretionary current accruals are expected accruals estimated from a cross-sectional modification of the Jones (1991) model. Expected current accruals of an IPO firm in a given year are estimated by fitting a regression with a sample of all two-digit SIC code from non-IPO firms. That is, , , 0 1 , , 1 , 1 , 1 1 , n t n t n t n t n t n t CA Sales n estimation sample TA − α TA − α TA − ε ∆ = + + ∈ , (3.2.2)
where ∆Sales is the change in sales and TA is total assets. Thus, the nondiscretionary current accruals for IPO firms are calculated as
, , , 0 1 , 1 , 1 1 ˆ ˆ m t m t , m t m t m t Sales TR NDCA TA TA α α − − ∆ − ∆ ≡ + (3.2.3)
where ∆ TR is the change in trade receivables and αˆ1 is the coefficient for IPO firm
m in year t. Therefore, discretionary current accruals for IPO firm m in year t are calculated as the residuals,
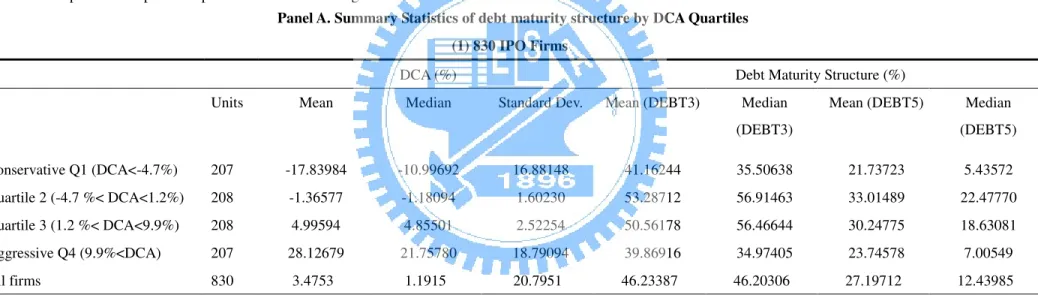
, , , , 1 m t m t m t m t CA DCA NDCA TA − ≡ − . (3.2.4) Larger discretionary current accruals mean more serious behavior of earnings management. We discard the observations whose discretionary current accruals calculated are more than one. Hence, 830 IPO firms are remained as our sample. Consequently, we sort these 830 IPO firms into four quartiles by their discretionary current accruals.4 We define the quartile of IPO firms with the lowest discretionary current accruals as “conservative” IPOs, and the quartile of IPO firms with the highest discretionary current accruals as “aggressive” IPOs. Table III, Panel A, reports summary statistics of debt maturity structure in each quartile. It shows that debt maturity rises initially as the discretionary current accruals increase and then drops in the aggressive quartile. Besides, the mean of discretionary current accruals of the 830 IPO firms is 3.4753%, which is significantly larger than that of non-IPO firms, -0.0135%, not reported in the Table III. Accordingly, firms planning to go public obviously have a stronger incentive to manipulate their reported earnings.
3.3 Other Exogenous Variables Description
The variables based on various hypotheses to explain debt maturity structure are included in our empirical model as follows.
(1) Growth option
Previous studies use the ratio of market value of the firm’s assets to the book
4
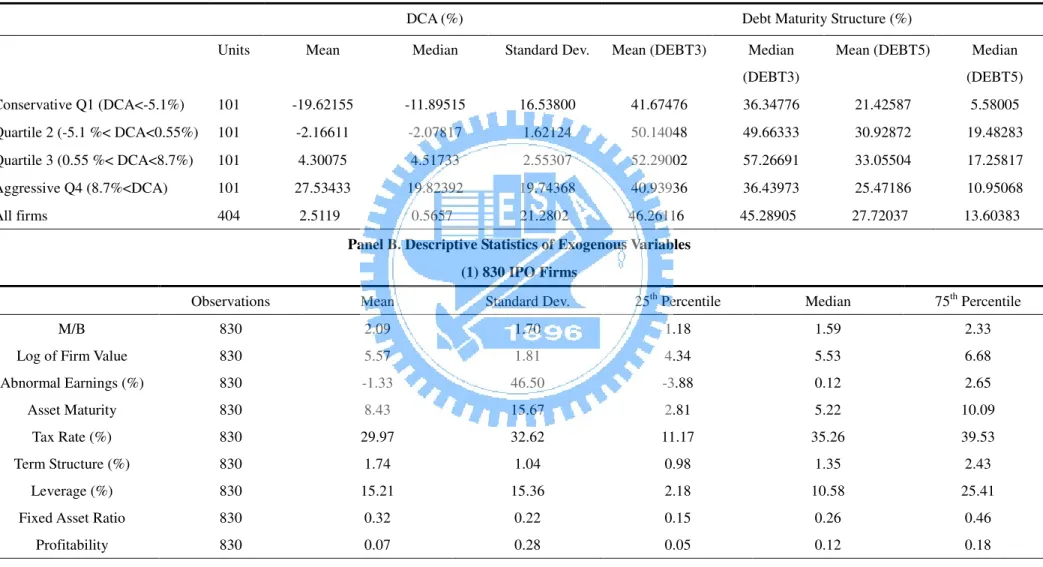
Because our following empirical research needs to narrow our sample to firms whose IPO dates are between July 1st and December 31st, we simultaneously show these smaller sample characteristics in Table III. The sample contains 404 IPO firms, which are sorted four quartiles, containing 101 firms in each.
value of its assets as the proxy for growth options. The market value of the firm’s assets is an estimated value calculated as the book value of assets plus the market value of equity minus the book value of equity. The formula is as follows:
book value of assets market value of equity book value of equity Growth option
book value of assets
+ −
= .
(3.3.1) Based on Myers (1977) and Barclay and Smith (1995), we expect a negative coefficient for market-to-book ratio.
(2) Firm Size
Firm size is measured as the natural logarithm of the estimated market value of its assets. The formula is as follows:
ln( )
Firm Size= market value of assets . (3.3.2) Following Diamond (1991) and Stohs and Mauer (1996), we expect a positive relation between debt maturity and firm size.
(3) Regulation dummy
To explore the influence of regulation, we develop a dummy variable that is set to one if firms are in the regulated industries and zero otherwise. Regulated industries include railroads, trucking, airlines, telecommunications, and gas and electric utilities. SIC codes of these industries are 4011, 4210, 4213, 4512, 4812, 4813, and 4900 to 4939. The formula is as follows:
Regulation dummy = 1 if firms are in the regulated industries
= 0 otherwise . (3.3.3) (4) Firm quality
We use firm’s abnormal earnings to proxy for firm quality. It is defined as the difference between next year’s earnings and this year’s earnings scaled by market value of equity in this fiscal year end following Datta, Iskandar-Datta, and Raman (2005). The formula is as follows:
1
t t
t
Earnings Earnings Abnormal Earnings
market value of equity
+ −
= . (3.3.4) We expect a negative relation between debt maturity and abnormal earnings.
(5) Assets maturity
Stohs and Mauer (1996) argue that the maturity of corporate debt changes positively with that of assets. Hence, we use the firm’s assets maturity to test matching hypothesis. Assets maturity is computed as the value-weighted average of the maturity of current assets and net property, plant and equipment. The maturity of current assets (ACT/COGS) is measured as current assets divided by the cost of goods, and the maturity of net property, plant and equipment (PPEGT/DP) is measured as net property, plant and equipment divided by depreciation expense. The formula is the following equation:
PPEGT PPEGT ACT ACT ASSETS MATURITY
AT DP AT COGS
= × + × , (3.3.5) where PPEGT is net property, plant and equipment, AT is total assets, DP is depreciation expense, ACT is current assets, and COGS is the cost of goods. We expect a positive relation between debt maturity and assets maturity.
(6) Tax rate
According to taxation hypothesis, tax rate is measured as the ratio of income tax expense to pretax income. The formula is as follows:
income tax expense Tax rate
pretax income
= . (3.3.6) We predict a negative coefficient for tax rate.
(7) Term structure
To calculate the term structure of interest rates, we collect the month-end yield on six-month government bonds and the month-end yield on ten-year government bonds from the Economic Report of the President. Thus, the yield spread between the month-end yield on ten-year government bonds and six-month government bonds is
used as the proxy for the term structure. We expect a positive relation between debt maturity and term structure.
(8) Leverage
Leverage is considered to have a positive influence on the maturity structure of debt. Generally speaking, firms with larger portion of leverage in its capital structure face more liquidity risk. Thus, according to liquidity risk hypothesis, these firms are supposed to issue more long-term debt. The variable of leverage is measured as the ratio of total long-term debt to the estimated market value of firms’ assets. The formula is as follows:
total long term debt Leverage
market value of assets
= , (3.3.7) where market value of assets is calculated as the book value of assets plus the market value of equity minus the book value of equity. We expect a positive relation between leverage and debt maturity. Because previous studies argue that leverage is an endogenous variable which is affected by debt maturity structure, we also list other variables used to estimate leverage including profitability, fixed assets ratio and investment tax credits dummy. We measure profitability as the ratio of operating income before depreciation to total assets, and measure fixed assets ratio as the ratio of net property, plant, and equipment to total assets, following Datta, Iskandar-Datta, and Raman (2005). The formulas are as follows:
operating income before depreciation Profitability
total assets
= , (3.3.8)
PPEGT Fixed assets ratio
total assets
= . (3.3.9) Besides, a dummy variable is set to be equal to one for firms which have investment tax credits and equal to zero otherwise, following Johnson (2003). The formula is as follows:
ITC dummy = 1 if firms have investment tax credits
= 0 otherwise . (3.3.10) The descriptive statistics of exogenous variables are reported in Table III, Panel B.
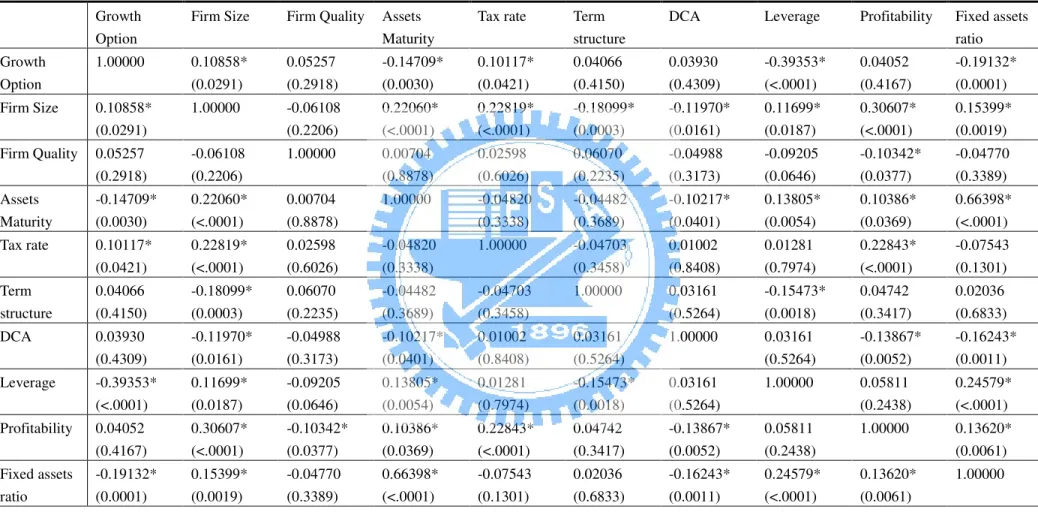
The matrix of Pearson correlation coefficients which captures the relations of each exogenous variable is presented in Table III, Panel C. We would like to check whether the variable of earnings management, DCA, is an endogenous variable. From Panel C, it is showed that there is no significantly strong correlation between DCA and other exogenous variables.
4. Methodology
To test our hypothesis that debt maturity structure is related to the behavior of earnings management positively, ordinary least squares regression analysis and two-stage least squares regression analysis are adopted.
4.1 Ordinary Least Squares Regression Analysis
Following Barclay and Smith (1995),5 we define the percentage of debt that matures in more than five years (DEBT5) as the dependent variable, and use traditional exogenous variables of previous different theories, such as M/B ratio, Log of Firm Value, Abnormal Earnings, Assets Maturity, Tax rate, Term Structure, Regulation Dummy, and the new variable, Discretionary Current Accruals, to examine the influence of these exogenous variables on debt maturity structure. The single-equation regression is expressed as follows:
2 0 1 2 3 4 2 5 6 7 8 9 10 5 ( ) ( ) ( / ) ( ) ( ) ( ) ( ) ( ) ( ) ( )
DEBT DCA DCA M B FirmSize
FirmSize Abnormal Earnings Assets Maturity Tax rate Term Structure Regulation dummy
β β β β β β β β β β β = + × + × + × + × + × + × + × + × + × + × (4.1.1) 5
Barclay and Smith (1995) explain the determinants of debt maturity structure by using single-equation analysis which discards the endogenous variable, leverage.
These variables are defined in Section 3 already.
4.2 Two-stage Regression Analysis
Following Johnson (2003) and Datta, Iskandar-Datta, and Raman (2005) which present that debt maturity and leverage are simultaneously jointly determined, the two-stage least squares regression functions are expressed as follows:
2 2
5 [ , ( ) , / , , ( ) , ,
, , , , ]
DEBT f DCA DCA M B FirmSize Firmsize Abnormal Earnings Assets Maturity Tax rate Term Structure Regulation dummy Leverage
=
(4.2.1)
[ 5, / , , , ,
, , ]
Leverage f DEBT M B Firm Size Fixed Assets Ratio Profitability Abnormal Earnings ITC dummy Regulation dummy
=
. (4.2.2) In the first-stage regression, leverage is defined as the dependent variable and is regressed on all other exogenous variables. In the second-stage regression, we use DEBT5 as the dependent variable and control for leverage using the predicted leverage from the first-stage regression. We predict a positive relation between DEBT5 and discretionary current accruals.
Particularly, we choose the firms which go public between July 1st and December 31st in each year as the sample for regression. We assume that managers manipulate reported earnings in order to have a higher price for selling their own stocks after the lock-up period ends. Because the data of debt maturity is from the following year after IPO (year +1), firms which go public in the first and second seasons may be unwilling to continue their behavior of earnings management in the next year. We concentrate on the sample in the third and fourth seasons of IPO year for analyzing the issue more accurately.
5. Empirical Results
5.1 Ordinary Least Squares Regression Results
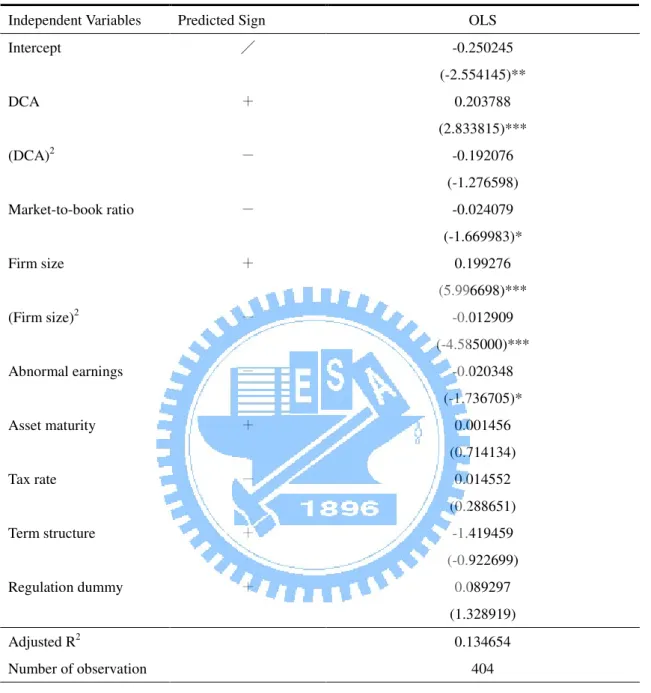
Table IV, Panel A, reports the results of the reduced-form regression, similar to Barclay and Smith’s (1995), using percentage of long-term debt that matures in more than five years (DEBT5) as the explanatory variable. Independent variables are all exogenous variables, including Discretionary Current Accruals, M/B ratio, Log of Firm Value, Abnormal Earnings, Assets Maturity, Tax rate, Term Structure, and Regulation Dummy. The regression result supports our deduction that the behavior of earnings management influences debt maturity structure positively. Cohering with the discussion above, the coefficient of discretionary current accruals is positive and significant at the 5% and the 1% levels. Besides, the coefficient of the square of discretionary current accruals is negative, but it is insignificant. The result indicates that the behavior of earnings management occurring in the period of IPO process generally impacts on the debt maturity structure choice in the next year.
From Table IV, we find M/B ratio is expected to be negative following Barclay’s (1995) research. The coefficient of this control variable is shown to be negative in Panel A, though it is insignificant. As predicted, the coefficient of the Log of Firm Value, the proxy of Firm Size, is significantly positive, while the coefficient of the square of Log of Firm Value is significantly negative. This result is consistent with Barclay and Smith (1995). The coefficient of abnormal earnings is also significantly negative as we discussed above. This result is consistent with Flannery (1986) that low-quality firms tend to prefer longer-maturity corporate debt. Assets Maturity and Regulation Dummy’s coefficients have the signs consistent with our prediction, even though insignificant in Table IV, Panel A. Signs of the coefficients of both Tax rate and Term structure are inconsistent with our prediction although it is insignificant. Moreover, we alter the dependent variable from DEBT5 to DEBT4 for robustness
checking in Panel B. Similar results of the coefficients of independent variables are obtained except that the coefficient of M/B ratio is significantly negative at the 10% level in Panel B. Hence, the result supplies support for our main inference about earnings management’s influence on debt maturity structure.
5.2 Two-stage Regression Results
The results of the two-stage regression analysis are reported in Table V. Panel A shows the second-stage regression on DEBT5 accompanied with the coefficients of independent variables. Because an ambiguous debate on Asset maturity exists in the review of previous literature and the definition of Tax rate in the empirical research is not absolutely rigorous, we discard Assets Maturity, Tax rate, and Regulation dummy. Hence, the second-stage regression of debt maturity is expressed as follows:
2 0 1 2 3 4 2 5 6 7 8 5 ( ) ( ) ( / ) ( ) ( ) ( ) ( ) ( )
DEBT DCA DCA M B Firm Size Firm Size Abnormal Earnings Term Structure Leverage β β β β β β β β β = + × + × + × + × + × + × + × + × (5.2.1) where Leverage is the predicted leverage estimated from the first-stage regression.
The coefficient of the discretionary current accruals is still significantly positive at the 10% level. While leverage is concerned in the model, the inference still has the compatible conclusion with single-equation regression in the previous section. Leverage, the endogenous variable predicted in the first-stage regression, is positive and significant at the 10% and the 5% levels. This result is consistent with Stohs and Mauer (1996) and Johnson (2003), which show that debt maturity increases with leverage. Log of Firm Value and the square of Log of Firm Value both accord with what we predict and the coefficients are highly significant. It is still consistent with Barclay and Smith’s (1995) research, which states that large firms prefer more long-term debt in their capital structure. Finally, we obtain that the coefficients of
M/B ratio, Abnormal Earnings, and Term structure are insignificant. Panel B reports the other regression that uses leverage as the explanatory variable. As expected, the coefficient of DEBT5 is positive and highly significant, which is consistent with Barclay, Marx, and Smith’s (1997) and Johnson’s (2003) results.
After controlling the determinants of debt maturity and modeling debt maturity and leverage as endogenous variables, the empirical result supports our hypothesis that the behavior of earnings management impacts on the maturity structure of corporate debt of firms positively. Firms with higher level of earnings management apparently have a larger amount of long-maturity debt in their capital structure. Our empirical result also supplies marked credibility in the aspects of the contracting cost, signaling and liquidity risk hypotheses.
5.3 Robustness Checks
In order to check the robustness of our empirical results in Table V, we alter the definition of some critical variables in the regressions. First, we use the percentage of total long-term debt that matures in more than 4 years (DEBT4) as the new dependent variable to repeat our two-stage least squares regression analysis. Similar to the above findings based on DEBT5, the results show that the coefficient of discretionary current accruals is still significantly positive. Other control variables also demonstrate the same conclusions when using the new measure of debt maturity. Further, following Stohs and Mauer (1996), we use the ratio of total debt to market value of assets as an alternative measure of leverage. The results, demonstrated in Table VI, still remain robust to this alternative.
6. Conclusion
In this study, we present that the behavior of earnings management by managers generally influences the debt maturity structure choice of corporations. The previous
literature of finance has supplied different theories to explain the determinants of debt maturity structure. We extend the concept of discrepancy of interests between managers and outside potential investors, and investigate whether the behavior of misleading outside investors impacts on the choice of debt issuing later. Previous studies about the impact of earnings management emphasize the relation between it and corporations’ stock performance. We reason that debt maturity choice is also influenced by earnings management. Corporations which mislead investors’ judgment about their quality have the incentive to lengthen their corporate debt maturity to avoid higher issuing costs in the future.
Using IPO firms as the sample, we show that corporations of aggressive activities in earnings management choose a larger portion of long-maturity debt. It is substantial to note that we combine the theory of earnings management with the factors influencing corporate debt maturity choice. Managers tend to concern the adequate debt maturity choice subsequently after they use earnings management to mislead outside investors’ judgment about corporations’ quality. The results demonstrate earnings management of aggressive firms in the IPO process brings about the higher proportion of long-maturity debt hereafter.
It is needed to note that we use only the discretionary current accruals of the IPO year, year 0, to explain the debt maturity structure choice of the next year, year +1. If managers tend to continue their behavior of earnings management, the discretionary current accruals in the year +1 probably also impact on the choice of debt maturity structure. Besides, we use the IPO firms as the sample because the behavior of earnings management apparently occurs in IPO process. It is believed that managers have different reasons to manipulate the reported earnings. We are hopeful that future research will provide more detailed and stable results which may explain the relation between debt maturity choice and earnings management from other dimensions.
References
Barclay, M. J., and C. W. Smith Jr., (1995), “The Maturity Structure of Corporate Debt,” Journal of Finance 50, 609-631.
Barclay, M. J., L. M. Marx, and C.W. Smith Jr., (1997), “Leverage and Maturity as Strategic Complements,” working paper, University of Rochester.
Berger, Allen N., Marco A. Espinosa-Vega, W. Scott Frame, and Nathan H. Miller, (2005), “Debt Maturity, Risk, and Asymmetric Information,” Journal of
Finance 60, 2895-2923.
Brick, Ivan E., and S. Abraham Ravid, (1985), “On the Relevance of Debt Maturity Structure,” Journal of Finance 40, 1423-1437.
Brick, Ivan E., and S. Abraham Ravid, (1991), “Interest Rate Uncertainty and the Optimal Debt Maturity Structure,” Journal of Financial and Quantitative
Analysis 26, 63-81.
Datta, Sudip, Mai Iskandar-Datta, and Kartik Raman, (2005), “Managerial Stock Ownership and the Maturity Structure of Corporate Debt,” Journal of Finance 60, 2333-2350.
Dechow, Patricia M., Richard G. Sloan, and Amy P. Sweeney, (1995), “Detecting Earnings Management,” The Accounting Review 70, 193-225.
Diamond, Douglas W., (1991), “Debt Maturity Structure and Liquidity Risk,”
Quarterly Journal of Economics 106, 709-737.
Flannery, Mark J., (1986), “Asymmetric Information and Risky Debt Maturity Choice,” Journal of Finance 41, 19-37.
Guedes, Jose, and Tim Opler, (1996), “The Determinants of the Maturity of Corporate Debt Issues,” Journal of Finance 51, 1809-1833.
Healy, Paul M., and James M. Wahlen, (1999), “A Review of the Earnings Management Literature and Its Implications for Standard Setting,” Accounting
Horizons 13, 365-383.
Johnson, Shane A., (2003), “Debt Maturity and the Effects of Growth Opportunities and Liquidity Risk on Leverage,” Review of Financial Studies 16, 209-236. Jones, Jennifer J., (1991), “Earnings Management During Import Relief
Investigations,” Journal of Accounting Research 29, 193-228.
Lewis, Craig M., (1990), “A Multiperiod Theory of Corporate Financial Policy Under Taxation,” Journal of Financial and Quantitative Analysis 25, 25-43.
Morris, James R., (1976a), “On Corporate Debt Maturity Strategies,” Journal of
Finance 31, 29-37.
Morris, James R., (1976b), “A Model for Corporate Debt Maturity Decisions,”
Journal of Financial and Quantitative Analysis 11, 339-357.
Myers, Stewart C., (1977), “Determinants of Corporate Borrowing,” Journal of
Financial Economics 5, 147-175.
Rangan, Srinivasan, (1998), “Earnings Management and the Performance of Seasoned Equity Offerings,” Journal of Financial Economics 50, 101-122.
Smith, C.W., Jr., (1986), “Investment Banking and the Capital Acquisition Process,”
Journal of Financial Economics 15, 3-29.
Stohs, Mark Hoven, and David C. Mauer, (1996), “The Determinants of Corporate Debt Maturity Structure,” Journal of Business 69, 279-312.
Teoh, Siew Hong, Ivo Welch, and T. J. Wong, (1998a), “Earnings Management and the Long-Run Market Performance of Initial Public Offerings,” Journal of
Finance 53, 1935-1974.
Teoh, Siew Hong, Ivo Welch, and T. J. Wong, (1998b), “Earnings Management and the Underperformance of Seasoned Equity Offerings,” Journal of Financial
Table I
Statistics for the Percentage of Long-term Debt That Matures in More Than One, Two, Three, Four, and Five Years from the Fiscal Year-End
The sample consists of 1,746 firms, including 873 IPO firms and 873 comparative non-IPO firms with SIC code between 2000 and 5999, in the period from 1991 through 2003. The sample firms must also have sufficient COMPUSTAT data to calculate discretionary current accruals in fiscal year 0. The data of long-term debt is also from COMPUSTAT.
Panel A. IPO Firms
Percentage of Debt That Matures in More Than
Mean Standard Deviation 25th Percentile Median 75th Percentile
One year Two years Three years Four years Five years 72.52 57.54 46.08 36.20 27.55 29.09 34.61 35.37 34.35 32.15 53.55 26.03 9.19 1.72 0.01 84.50 66.67 45.24 27.77 12.33 96.60 88.10 77.97 65.27 49.32
Panel B. Non-IPO Firms
Percentage of Debt That Matures in More Than
Mean Standard Deviation 25th Percentile Median 75th Percentile
One year Two years Three years Four years Five years 77.98 63.13 51.05 41.27 32.29 24.71 31.16 33.31 32.64 30.60 67.53 42.00 19.60 9.04 2.58 88.01 71.27 56.51 41.58 26.07 96.82 89.16 79.89 68.97 55.03
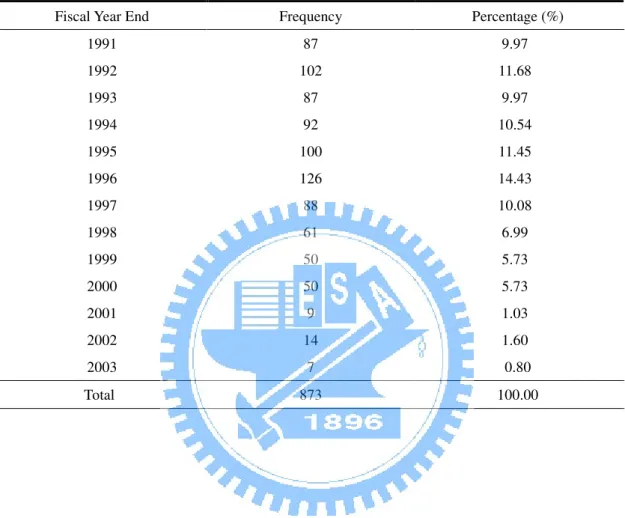
Table II
Characteristics of Sample
The sample consists of 873 IPO firms which go public in the period from 1991 through 2003 with SIC code between 1991 and 5999. The sample firms must also have sufficient COMPUSTAT data to calculate discretionary current accruals in fiscal year 0. Panel A reports time distribution of the sample by IPO calendar year, and Panel B reports SIC distribution of the sample by two-digit SIC code.
Panel A. Time Distribution
Fiscal Year End Frequency Percentage (%) 1991 1992 1993 1994 1995 1996 1997 1998 1999 2000 2001 2002 2003 87 102 87 92 100 126 88 61 50 50 9 14 7 9.97 11.68 9.97 10.54 11.45 14.43 10.08 6.99 5.73 5.73 1.03 1.60 0.80 Total 873 100.00
Table II (Continued) Panel B. SIC Distribution
Industry Two-digit SIC Codes Frequency % Oil and Gas
Food Products
Paper and Paper Products Chemical Products Manufacturing
Computer Hardware & software Electronic Equipment
Transportation Scientific Instruments Communications
Electric and Gas Services Durable Goods
Retail
Eating and Drinking Establishments All Others Total 29 20 24-27 28 30-34 35 36 37, 39, 40-42, 44, 45 38 48 49 50 53, 54, 56, 57, 59 58 22, 23, 46, 47, 51, 52, 55 9 41 42 84 68 78 92 82 70 77 23 40 74 37 56 873 1.03 4.70 4.81 9.62 7.79 8.93 10.54 9.39 8.02 8.82 2.63 4.58 8.48 4.24 6.41 100.00
Table III
Descriptive Statistics of Sample
The sample consists of 830 IPO firms which go public in the period from 1991 through 2003 with SIC code between 2000 and 5999. Discretionary current accruals (DCA) are calculated by a two-digit SIC industry cross-sectional modified Jones (1991) model. Panel A shows summary statistics of DCA and debt maturity structure of the sample. DCA is used to measure the extent of earnings management. Panel B shows the descriptive statistics of other exogenous we mention in this paper. The exogenous variables are also calculated from the items of COMPUSTAT. Firm Value is defined as the market value of total assets. The market value of total assets is calculated as (book value of total assets + market value of equity – book value of equity). M/B ratio is the ratio of firm value of total assets to book value of that. Abnormal Earnings is defined as (earnings in year t+1 – earnings in year t) / market value of equity in year t. Assets Maturity is already defined in the equation (3.3.5). Tax rate is defined as (tax income expense / pretax income). Leverage is defined as (total long-term debt / market value of total assets). Fixed Asset ratio is defined as (net property, plant, and equipment / book value of total assets). Profitability is defined as (operating income before depreciation / book value of total assets). Panel C reports the Pearson correlations of exogenous variables and p-value is reported in parentheses. * indicate significance at the 5% level.
Panel A. Summary Statistics of debt maturity structure by DCA Quartiles (1) 830 IPO Firms
DCA (%) Debt Maturity Structure (%)
Units Mean Median Standard Dev. Mean (DEBT3) Median
(DEBT3)
Mean (DEBT5) Median (DEBT5) Conservative Q1 (DCA<-4.7%) 207 -17.83984 -10.99692 16.88148 41.16244 35.50638 21.73723 5.43572 Quartile 2 (-4.7 %< DCA<1.2%) 208 -1.36577 -1.18094 1.60230 53.28712 56.91463 33.01489 22.47770 Quartile 3 (1.2 %< DCA<9.9%) 208 4.99594 4.85501 2.52254 50.56178 56.46644 30.24775 18.63081 Aggressive Q4 (9.9%<DCA) 207 28.12679 21.75780 18.79094 39.86916 34.97405 23.74578 7.00549 All firms 830 3.4753 1.1915 20.7951 46.23387 46.20306 27.19712 12.43985
Panel B. Descriptive Statistics of Exogenous Variables (1) 830 IPO Firms
Observations Mean Standard Dev. 25th Percentile Median 75th Percentile
M/B Log of Firm Value Abnormal Earnings (%)
Asset Maturity Tax Rate (%) Term Structure (%)
Leverage (%) Fixed Asset Ratio
Profitability 830 830 830 830 830 830 830 830 830 2.09 5.57 -1.33 8.43 29.97 1.74 15.21 0.32 0.07 1.70 1.81 46.50 15.67 32.62 1.04 15.36 0.22 0.28 1.18 4.34 -3.88 2.81 11.17 0.98 2.18 0.15 0.05 1.59 5.53 0.12 5.22 35.26 1.35 10.58 0.26 0.12 2.33 6.68 2.65 10.09 39.53 2.43 25.41 0.46 0.18
Table III (Continued)
(2) 404 IPO Firms
DCA (%) Debt Maturity Structure (%)
Units Mean Median Standard Dev. Mean (DEBT3) Median
(DEBT3)
Mean (DEBT5) Median (DEBT5) Conservative Q1 (DCA<-5.1%) 101 -19.62155 -11.89515 16.53800 41.67476 36.34776 21.42587 5.58005 Quartile 2 (-5.1 %< DCA<0.55%) 101 -2.16611 -2.07817 1.62124 50.14048 49.66333 30.92872 19.48283 Quartile 3 (0.55 %< DCA<8.7%) 101 4.30075 4.51733 2.55307 52.29002 57.26691 33.05504 17.25817 Aggressive Q4 (8.7%<DCA) 101 27.53433 19.82392 19.74368 40.93936 36.43973 25.47186 10.95068 All firms 404 2.5119 0.5657 21.2802 46.26116 45.28905 27.72037 13.60383
Table III (Continued)
(2) 404 IPO Firms
Observations Mean Standard Dev. 25th Percentile Median 75th Percentile
M/B Log of Firm Value Abnormal Earnings (%)
Asset Maturity Tax Rate (%) Term Structure (%)
Leverage (%) Fixed Asset Ratio
Profitability 404 404 404 404 404 404 404 404 404 2.09 5.57 -3.92 8.15 30.27 1.67 15.20 0.32 0.07 1.53 1.80 57.39 8.01 32.03 1.03 15.69 0.22 0.28 1.21 4.46 -4.55 2.82 14.88 0.98 1.84 0.15 0.06 1.63 5.59 -0.27 5.28 35.11 1.35 9.75 0.25 0.12 2.34 6.67 2.27 10.79 39.60 2.43 25.42 0.44 0.18
Table III (Continued)
Panel C. Pearson Correlations
Growth Option
Firm Size Firm Quality Assets Maturity
Tax rate Term structure
DCA Leverage Profitability Fixed assets ratio Growth Option 1.00000 0.10858* (0.0291) 0.05257 (0.2918) -0.14709* (0.0030) 0.10117* (0.0421) 0.04066 (0.4150) 0.03930 (0.4309) -0.39353* (<.0001) 0.04052 (0.4167) -0.19132* (0.0001) Firm Size 0.10858* (0.0291) 1.00000 -0.06108 (0.2206) 0.22060* (<.0001) 0.22819* (<.0001) -0.18099* (0.0003) -0.11970* (0.0161) 0.11699* (0.0187) 0.30607* (<.0001) 0.15399* (0.0019) Firm Quality 0.05257 (0.2918) -0.06108 (0.2206) 1.00000 0.00704 (0.8878) 0.02598 (0.6026) 0.06070 (0.2235) -0.04988 (0.3173) -0.09205 (0.0646) -0.10342* (0.0377) -0.04770 (0.3389) Assets Maturity -0.14709* (0.0030) 0.22060* (<.0001) 0.00704 (0.8878) 1.00000 -0.04820 (0.3338) -0.04482 (0.3689) -0.10217* (0.0401) 0.13805* (0.0054) 0.10386* (0.0369) 0.66398* (<.0001) Tax rate 0.10117* (0.0421) 0.22819* (<.0001) 0.02598 (0.6026) -0.04820 (0.3338) 1.00000 -0.04703 (0.3458) 0.01002 (0.8408) 0.01281 (0.7974) 0.22843* (<.0001) -0.07543 (0.1301) Term structure 0.04066 (0.4150) -0.18099* (0.0003) 0.06070 (0.2235) -0.04482 (0.3689) -0.04703 (0.3458) 1.00000 0.03161 (0.5264) -0.15473* (0.0018) 0.04742 (0.3417) 0.02036 (0.6833) DCA 0.03930 (0.4309) -0.11970* (0.0161) -0.04988 (0.3173) -0.10217* (0.0401) 0.01002 (0.8408) 0.03161 (0.5264) 1.00000 0.03161 (0.5264) -0.13867* (0.0052) -0.16243* (0.0011) Leverage -0.39353* (<.0001) 0.11699* (0.0187) -0.09205 (0.0646) 0.13805* (0.0054) 0.01281 (0.7974) -0.15473* (0.0018) 0.03161 (0.5264) 1.00000 0.05811 (0.2438) 0.24579* (<.0001) Profitability 0.04052 (0.4167) 0.30607* (<.0001) -0.10342* (0.0377) 0.10386* (0.0369) 0.22843* (<.0001) 0.04742 (0.3417) -0.13867* (0.0052) 0.05811 (0.2438) 1.00000 0.13620* (0.0061) Fixed assets ratio -0.19132* (0.0001) 0.15399* (0.0019) -0.04770 (0.3389) 0.66398* (<.0001) -0.07543 (0.1301) 0.02036 (0.6833) -0.16243* (0.0011) 0.24579* (<.0001) 0.13620* (0.0061) 1.00000
Table IV
Ordinary Least Squares Regression Estimating the Determinants of Debt Maturity
The table shows the regression results from an ordinary least squares regression. In Panel A, the percentage of long-term debt that matures in more than five years (DEBT5) is regressed on discretionary current accruals of the firm in IPO’s year, the firms’ market-to-book ratio, the natural log of firm value, the firm’s future abnormal earnings, the firm’s assets maturity, the firm’s tax rate, the risk-free term structure, and a dummy variable for firms in regulation industries. The single-equation regression is as follows: 2 0 1 2 3 4 2 5 6 7 8 9 10 5 ( ) ( ) ( / ) ( ) ( ) ( ) ( ) ( ) ( ) ( )
DEBT DCA DCA M B Firm Size
Firm Size Abnormal Earnings AssetsMaturity Tax rate Term Structure Regulation dummy
β β β β β β β β β β β = + × + × + × + × + × + × + × + × + × + × .
We alter the dependent variable from DEBT5 to DEBT4 for robustness checking. The sample contains 404 observations which have available data for all variables. White’s (1980) heteroskedasticity consistent t-statistics are reported in parentheses. ***, **, and * indicate significance at the 1%, 5%, and 10% levels each.
Panel A. Dependent Variable: DEBT5
Independent Variables Predicted Sign OLS Intercept DCA (DCA)2 Market-to-book ratio Firm size (Firm size)2 Abnormal earnings Asset maturity Tax rate Term structure Regulation dummy / + - - + - - + - + + -0.279183 (-3.121714)*** 0.155490 (2.266123)** -0.073175 (-0.521126) -0.019798 (-1.475873) 0.173100 (5.777444)*** -0.011017 (-4.373360)*** -0.030146 (-2.697851)*** 0.002185 (1.126211) 0.002609 (0.065844) -0.970360 (-0.648413) 0.087031 (1.328202) Adjusted R2 Number of observation 0.114585 404
Table IV (Continued)
Panel B. Dependent Variable: DEBT4
Independent Variables Predicted Sign OLS Intercept DCA (DCA)2 Market-to-book ratio Firm size (Firm size)2 Abnormal earnings Asset maturity Tax rate Term structure Regulation dummy / + - - + - - + - + + -0.250245 (-2.554145)** 0.203788 (2.833815)*** -0.192076 (-1.276598) -0.024079 (-1.669983)* 0.199276 (5.996698)*** -0.012909 (-4.585000)*** -0.020348 (-1.736705)* 0.001456 (0.714134) 0.014552 (0.288651) -1.419459 (-0.922699) 0.089297 (1.328919) Adjusted R2 Number of observation 0.134654 404
Table V
Two-stage Regression Coefficients Explaining the Percentage of Total Long-term Debt That Matures in More Than 5 Years
This table shows the results of the second-stage regressions from a two-stage regression analysis. In Panel A, the explanatory variable for the second-stage regression is the percentage of total long-term debt that matures in more than 5 years (DEBT5). The predicted leverage is obtained form the first-stage regression where leverage is defined as the dependent variable. Panel B reports the other second-stage regression where the explanatory variable is leverage. White’s (1980) heteroskedasticity consistent t-statistics are reported in parentheses. ***, **, and * indicate significance at the 1%, 5%, and 10% levels each. The regressions are as follows:
2 0 1 2 3 4 2 5 6 7 8 5 ( ) ( ) ( / ) ( ) ( ) ( ) ( ) ˆ ( )
DEBT DCA DCA M B Firm Size Firm Size Abnormal Earnings Term Structure Leverage β β β β β β β β β = + × + × + × + × + × + × + × + × , 0 1 2 3 4 5 6 7 8 ˆ ( 5) ( / ) ( ) ( ) ( ) ( ) ( ) ( )
Leverage DEBT M B Firm Size Fixed Assets Ratio Profitability Abnormal Earnings ITC dummy
Regulation dummy γ γ γ γ γ γ γ γ γ = + × + × + × + × + × + × + × + × . ˆ
Leverage and DEBTˆ 5 are both estimated from the first-stage regressions where Leverage and DEBT5 are regressed on all other exogenous variables.
Panel A. Dependent Variable: DEBT5
Independent Variables Predicted Sign 2SLS Intercept DCA (DCA)2 Market-to-book ratio Firm size (Firm size)2 Abnormal earnings Term structure Leverage (predicted) / + - - + - - + + -0.32002 (-2.99)*** 0.123025 (1.82)* -0.08557 (-0.62) 0.013747 (0.67) 0.115392 (2.81)*** -0.00646 (-2.02)** -0.01820 (-0.75) 0.749994 (0.49) 0.884497 (2.04)** Adjusted R2 Number of observation 0.14351 404
Table V (Continued)
Panel B. Dependent Variable: Leverage
Independent Variables Predicted Sign 2SLS Intercept
DEBT5 (predicted) Market-to-book ratio Firm size
Fixed Assets Ratio Profitability Abnormal earnings Investment tax credit dummy Regulation dummy / + - / + / + - + 0.132025 (4.87)*** 0.411294 (3.53)*** -0.02908 (-5.48)*** -0.00901 (-1.29) 0.065239 (1.88)* 0.002384 (0.09) 0.000094 (0.01) -0.05457 (-2.04)** 0.002641 (0.09) Adjusted R2 Number of observation 0.21626 404