國立交通大學
土木工程學系
碩士論文
反復扭轉剪力夯實造成之砂土密度及體
積變化
Change of Density and Volume in Sand Due to
Cyclic Torsional Shear Compaction
研究生 : 黃湘銘
指導教授 : 方永壽 博士
反復扭轉剪力夯實造成之砂土密度及體積
變化
Change of Density and Volume in Sand Due to Cyclic
Torsional Shear Compaction
研 究 生: 黃湘銘
Student:Xiang-Ming Huang
指導教授:方永壽 博士
Advisor:Dr. Yung-Show Fang
國 立 交 通 大 學
土 木 工 程 學 系
碩士論文
A Thesis
Submitted to the Department of Civil Engineering
College of Engineering
National Chiao Tung University
in Partial Fulfillment of the Requirements
for the Degree of
Master of Engineering
in Civil Engineering
August, 2013
Hsinchu, Taiwan, Republic of China
i
反復扭轉剪力夯實造成之砂土密度及體積
變化
研究生 : 黃湘銘 指導教授 : 方永壽 博士
Abstract (in Chin
ese)
國立交通大學土木工程學系碩士班
摘要
本論文以實驗方法探討反復扭轉剪力夯實造成砂質填土土體內相對密度的 改變及沉陷量。本研究使用自行設計建造直徑為 0.45 m 之剪力盤之反復扭剪夯 實儀,在土層表面施加靜態垂直應力與反復剪應力。本研究以氣乾之渥太華砂為 填土,填入整層高度為 1.5 m 或 5 層高度 0.3 m 之疏鬆砂土。填土初始相對密度 為 36 %。本研究採用雷射測距儀來量測土體表面沉陷量,採用密度控制盒埋置 於試體內部以量測各點土壤相對密度。根據實驗結果,本研究可獲得以下幾項結 論。在最初 5 次的反復扭轉夯實次數 (N = 5),表面沉陷量明顯地增加。進行反 復扭轉剪力夯實 20 次後 (N = 20),土壤顆粒排列趨於緊密,土體達到主要地表 沉陷量,後續扭剪造成之地表沉陷量趨緩。對 5 層厚度各 0.3 m 的土體分別進行 反復扭轉剪力夯實後 20 次後,各層之平均體積應變量為 9.77 %、10.53 %、10.37 %、10.05 % 與 10.32 %,顯示反復扭轉剪力夯實對各土層造成之體積變化是相 對地均勻。而整層的相對密度值都被成功的增加到大於 70 %。對 5 層土層施作 分層夯實,改良土體平均相對密度值為 76.3 %,標準差為 6.2 %。證明此反復扭 轉剪力夯實方法成功的將整層土層改良。 關鍵字:土壤夯實;反復扭轉剪力;相對密度;砂;地表沉陷;體積應變ii
Change of Volume and Density in Sand Due to
Cyclic Torsional Shear Compaction
Student: Xiang-Ming Huang Advisor: Dr. Yung-Show Fang Department of Civil Engineering
National Chiao Tung University
Abstract
This paper presents experimental data on the change of volume and relative density in a cohesionless soil mass due to static vertical load and cyclic torsional shearing compaction. A cyclic torsional shearing compactor was with a 0.45 m-diameter circular shearing disc was designed and constructed at National Chiao Tung University. Air-dry Ottawa sand was used as fill material. The initial relative density of the fill was 36 %. The static vertical load and cyclic torsional shearing were applied on the surface of a 1.5 m-thick lift, and then on another specimen with five 0.3 m-thick lifts, with the rotation angles be +5°. Surface settlement of the fill was measured with a laser distance meter. Soil density cups were buried in the cohesionless specimen to monitor the distribution of relative density of with depth soil. Based on the test results, the following conclusions were drawn.
In the first 5 cycles of cyclic torsional shearing application, the surface settlement increased significantly. However, after 20 cycles, the major part of settlement was accomplished, soil particle were sheared and reached a densely-packed condition. As a result, it was difficult to increase the surface settlement any further with more cyclic shear application. For shearing compaction on five 0.3 m-thick lifts, after 20 cycles of torsional shearing with the torsional angle of =±5˚, the average volumetric strain for the lift 1, 2, 3, 4, and 5 was 9.77, 10.53, 10.37, 10.05 and 10.32 %, respectively. It was
iii
clear that the cyclic torsional shearing compaction in each lift was relatively uniform. Most of the relative density measured in compacted fill were greater than 70 %. The entire soil body was successfully compacted with cyclic torsional shearing compaction. For five compacted lifts, the mean relative density was 76.3 % with a standard deviation of 6.2 %. It was obvious that the entire soil body was successfully compacted with this ground improvement technique.
Keywords:Compaction;Cyclic torsional shearing;Relative density;Sand;Surface
iv
Acknowledgements
The author wishes to give his sincere appreciation to his advisor, Dr. Yung-Show Fang for his enthusiastic advice, helpful discussions and continuous encouragement in past two years. If there is not the guidance from him, the thesis can not be accomplished. The author also wants to express his appreciation to the members of his supervisory committee, Dr. Huei-Wen Chang and Dr. Tao-Wei Feng for their valuable suggestions and discussions. Very special thanks are extended to Dr. Yi-Wen Pan, Dr. An-Bin Huang, Dr. Jyh-Jong Liao, Dr. Hsin-Yu Shan and Dr. Chin-Ping Lin for encouragement and teaching.
The author must extend his gratitude to Mr. Kuo-Hua Lee, Joe, Mr. Cheng-Yo Lee and Mr. Cheng Liu for their support and encouragement. Appreciation is extend to all my friends, classmates and roommates, especially for Mr. Cheng-Shao Wong, Mr. Chin-Yo Lin, Mr. Tung-Shin Lin, Mr. Wei-Shin Lin, Mr. Chi-Hsien Chung, Mr. Jhong-Yuan Huang, Mr. Tzu-Yang Lin, Mr. Chin-Hung Shen, Mr. Ming-Tzu Hung and Mr. Ki-Lin Lee for their encouragement and assistance.
Finally, the author would dedicate this to his parents, brother and sister for their continuing encouragement and moral support.
v
Table of Contents
Abstract (in Chinese) ... i
Abstract ... ii
Acknowledgements ... iv
List of Tables ... viii
List of Figures ... ix
List of Symbols ... xvii
Chapter 1 INTRODUCTION ... 1
1.1 Objectives of Study ... 1
1.2 Research Outline ... 2
1.3 Organization of Thesis ... 2
Chapter 2 Literature Review ... 3
2.1 Soil Improvement with Densification ... 3
2.1.1 Densification Techniques ... 4
2.1.2 Soil Densification with Vibratory Compactor ... 4
2.2 Cyclic Simple Shear Test ... 5
2.2.1 Study of Youd... 5
2.2.2 Study of Hsu and Vucetic ... 6
2.3 Cyclic Torsional Simple Shear Test ... 6
2.3.1 Study of Ishibashi et al. ... 7
2.4 Densification with Cyclic Torsional Shearing ... 8
2.4.1 Study of Yang ... 8
2.4.2 Study of Ren ... 8
2.4.3 Study of Huang ... 8
vi
2.4.5 Study of Liu ... 10
2.5 Requirements of Soil Improvement ... 11
2.6 Maximum Index Density and Unit Weight of Soils Using a Vibratory Table 12 Chapter 3 Experimental Apparatus ... 13
3.1 Soil Bin ... 13
3.2 Cyclic Torsional Shear Compactor ... 14
3.2.1 Shearing Disc ... 15
3.2.2 Surcharge Weight ... 15
3.2.3 Torque Loading Device ... 19
Chapter 4 Soil Characteristics ... 21
4.1 Soil Properties ... 21
4.2 Side-wall Friction... 22
4.3 Control of Soil Density ... 22
4.3.1 Air-Pluviation of Loose Sand ... 22
4.3.2 Measurement of Soil Density... 23
Chapter 5 Testing Procedure ... 25
5.1 Specimen Preparation ... 25
5.2 Application of Vertical Static Load ... 26
5.3 Application of Cyclic Torsional Shearing ... 26
Chapter 6 Test Results ... 28
6.1 Static Load Tests on a 1.5 m-thick Lift ... 28
6.1.1 Volume Change Due to Static Load ... 29
6.1.2 Relative Density after Static Load ... 30
6.1.3 Relative Density Increase Ratio ... 30
6.2 Cyclic Torsional Shear Compaction on a 1.5 m-thick Lift ... 31
vii
6.2.2 Volume Change Due to Cyclic Torsional Shear Compaction ... 32
6.2.3 Relative Density Distribution after Change Due to Surface Compaction ... 34
6.2.4 Relative Density Increase Ratio ... 34
6.3 Compaction on Five 0.30 m-thick Lifts ... 35
6.3.1 Compaction of Lift One ... 36
6.3.2 Compaction of Lift Two ... 36
6.3.3 Compaction of Lift Three ... 37
6.3.4 Compaction of Lift Four ... 38
6.3.5 Compaction of Lift Five... 38
6.4 Cyclic Torsional Shear Compaction with Different Shearing Angles ... 39
6.4.1 Applied Torque for Different Shearing Angles ... 39
6.4.2 Volume Change of Soil with Shearing Angles ... 40
Chapter 7 CONCLUSIONS ... 41
References ... 43
Tables ... 47
viii
List of Tables
Table. 2.1. Qualitative description of granular soil deposits ...47
Table. 3.1. Terzaghi’s Modified Capacity Factors 𝑁′𝑐, 𝑁′𝑞, and 𝑁′𝛾 ...48
Table. 3.2. Characteristics of normal loading discs ...49
ix
List of Figures
Fig. 2.1. Arrangement of uniform spheres (after Deresiewicz, 1958) ...51 Fig. 2.2. Unit weight vs. depth relation for vibratory roller compaction (after
D’Appolonia et al. 1969) ...52 Fig. 2.3. Compacted unit weight profiles for 8-ft lift heights for 2, 5, 15, and 45
vibratory roller passes (after D’Appolonia et al. 1969) ...53 Fig. 2.4. Approximate method for determining lift height required to achieve a
minimum compacted relative density of 75% with five roller passes using data for a large lift height(after D’Appolonia et al. 1969) ...54 Fig. 2.5. NGI cyclic simple shear apparatus (after Airey and Wood, 1987) ...55 Fig. 2.6. Stress conditions of a soil specimen cyclic horizontal shear stress ...56 Fig. 2.7. Void ratio versus cyclic displacement for densification of a sand with successive cycles of shear (after Youd, 1972) ...57 Fig. 2.8. Sketch of typical results of cyclic simple shear strain-controlled tests with
definitions of volumetric cyclic threshold strain (after Hsu and Vucetic, 2004) ...58 Fig. 2.9. Torsional simple shear device (after Ishibashi et al. 1985) ...59 Fig. 2.10. Variation of cyclic volumetric strain as a function of cyclic shear strain
(after Ishibashi et al., 1985) ...60 Fig. 2.11. Change of relative density with one-way and cyclic disc shearing versus
normal stress (after Yang, 2002) ...61 Fig. 2.12. Change of relative density due to cyclic disc shear with number of cycles
(after Ren, 2006) ...62 Fig. 2.13. Change of relative density due to cyclic disc shear at different depths with
x
Fig. 2.14. Change of relative density due to cyclic disc shear with normal stress
(after Huang, 2008) ...64
Fig. 2.15. Surface settlement due to static vertical load at N = 0 to N = 40 (after Chen, 2011) ...65
Fig. 2.16. Distribution of relative density due to cyclic torsional shearing (after Chen, 2011) ...66
Fig. 2.17. Distribution of relative density in lift 1 to 4 (after Chen, 2011) ...67
Fig. 2.18. Surface settlement as a function of shearing angle (after Liu, 2012) ...68
Fig. 2.19. Distribution of relative density after cyclic torsional shearing (after Liu, 2012) ...69
Fig. 2.20. Distribution of qc / qc,loose after cyclic torsional shearing (after Liu, 2012) ...70
Fig. 2.21. Special Cylindrical Metal Molds71 (after, ASTM D 4253) ...71
Fig. 3.1. NCTU non-yielding model retaining wall and soil bin (after Chen and Fang, 2008) ...72
Fig. 3.2 Relationship between footing width and influenced depth (after schebotarioff, 1973) ...73
Fig. 3.3. Dimensions of cyclic torsional shear compactor ...74
Fig. 3.4. Cyclic torsional shear compactor ...75
Fig. 3.5. Bottom of shearing disc with radial fins ...76
Fig. 3.6. Dimensions of a radial fin ...77
Fig. 3.7. Bottom of shearing disc with Safety-Walk ...78
Fig. 3.8. Nature of bearing capacity failure in soil: (a) general shear failure; (b) local shear failure; (c) punching shear failure (Radrawn after Vesic, 1973) ...79
Fig. 3.9. Modes of foundation failure in sand (after Vesic, 1973) ...80 Fig. 3.10. Bearing capacity failure in soil under a rough rigid continuous foundation
xi
(after Terzaghi, 1943) ...81
Fig. 3.11 Relationship between Unit Weight and Internal Friction Angle (after Chang, 2000) ...82
Fig. 3.12. Dimensions of normal loading disc for mass = 19.80 kg ...83
Fig. 3.13. Torque loading frame (after Chen, 2011) ...84
Fig. 3.14. Torque loading frame ...85
Fig. 3.15. Dimensions of extension tube...86
Fig. 3.16. CTSC and torque loading frame are connected by extension tube ...87
Fig. 3.17. Dimensions of torque wrench (after Chen, 2011) ...88
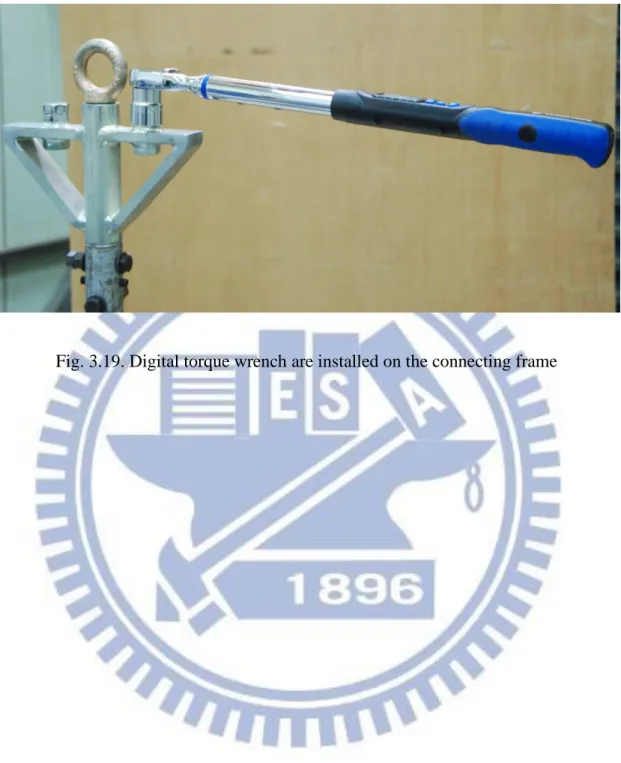
Fig. 3.18. Dimensions of digital torque wrench (after Chen, 2011) ...89
Fig. 3.19. Digital torque wrench are installed on the connecting frame ...90
Fig. 4.1. Grain size distribution of Ottawa sand (after Chen, 2003) ...91
Fig. 4.2. Lubrication layers on the side walls (after Chen, 2011) ...92
Fig. 4.3. Variation of friction angle with normal stress (after Fang et al., 2004) ...93
Fig. 4.4. Soil hopper ...94
Fig. 4.5 Pluviation of Ottawa sand into soil bin (after Chen, 2011) ...95
Fig. 4.6 Relationship among slot opening, drop height, and relative density (after Ho, 1999) ...96
Fig. 4.7. Dimensions of soil density cup (after Chen, 2011) ...97
Fig. 4.8. Soil density cup ...98
Fig. 4.9. Soil density cups buried at different elevations ...99
Fig. 4.10. Arrangement of soil density cups at same elevation ...100
Fig. 4.11. Measurement of soil mass in density cup ...101
Fig. 4.12. Distribution of relative density with depth ...102
Fig. 5.1. Soil storage ...103
xii
Fig. 5.3. Sand hopper lifted by overhead crane (after Chen, 2011) ...105
Fig. 5.4. Air-pluviation of Ottawa sand into soil bin ...106
Fig. 5.5. Portable ladders and bridge board hung on side walls ...107
Fig. 5.6. Leveling of soil surface with a brush...108
Fig. 5.7. Soil density cup placed on soil surface ...109
Fig. 5.8. Horizontal check of density cup with a bubble level...110
Fig. 5.9. Loading pattern on soil surface ...111
Fig. 5.10. Hoist of CTSC into the soil bin ...112
Fig. 5.11. Apply vertical static load on loose sand ...113
Fig. 5.12 Soil surface after a patterns of vertical static load ...114
Fig. 5.13. Cyclic torsional shear compactor with rotation angle indicator and Controller ...115
Fig. 5.14. Shearing disc at initial position = 0° ...116
Fig. 5.15. Shearing disc rotated to = +5° ...117
Fig. 5.16. Shearing disc rotated to = - 5° ...118
Fig. 5.17. The application of cyclic torsional shear to loose sand ...119
Fig. 5.18. Compacted soil surface after 3×3 formation of cyclic torsional shear ...120
Fig. 5.19. Soil density cup dug out of compacted soil mass ...121
Fig. 5.20. Scraping of soils toward edge of density cup with a spatula ...122
Fig. 5.21. Brush away soil particles from base plate of density cup ...123
Fig. 6.1. Density cups buried in soil mass at different elevations and locations ...124
Fig. 6.2. The application of vertical static loading formation ...125
Fig. 6.3. Settlement measurement with laser distance meter ...126
Fig. 6.4. Surface settlement and Volumetric strain due to static vertical load at N = 0 ...127
xiii
Fig. 6.6. Change of density due to vertical static load (N = 0) ...129
Fig. 6.7. Digital torque wrench on the connecting frame ...130
Fig. 6.8. The relationship between measured torque T’ and applied torque T ...131
Fig. 6.9. The cyclic torsional shear compactor ...132
Fig. 6.10. Variation of torque T with shearing disc angle for N = 1 ...133
Fig. 6.11. Variation of torque T with shearing disc angle ...134
Fig. 6.12. Variation of torque T with shearing disc angle Fig. 6.13. Variation of Torque T with number of cycle of cyclic torsional shearing .136 Fig. 6.14. Determine the maximum torsional shear stress at the edge of the shearing disc due to the applied torque ...137
Fig. 6.15. Maximum shear stress with number of cycle, N ...138
Fig. 6.16. Measurement points of surface settlement at N = 1 to 40 ...139
Fig. 6.17. Surface settlement and Volumetric strain due to cyclic torsional shear at N = 1 ...140
Fig. 6.18. Surface settlement and Volumetric strain due to cyclic torsional shear at N = 2 ...141
Fig. 6.19. Surface settlement and Volumetric strain due to cyclic torsional shear at N = 3 ...142
Fig. 6.20. Surface settlement and Volumetric strain due to cyclic torsional shear at N = 4 ...143
Fig. 6.21. Surface settlement and Volumetric strain due to cyclic torsional shear at N = 5 ...144
Fig. 6.22. Surface settlement and Volumetric strain due to cyclic torsional shear at N = 10 ...145
Fig. 6.23. Surface settlement and Volumetric strain due to cyclic torsional shear at N = 15 ...146
xiv
Fig. 6.24. Surface settlement and Volumetric strain due to cyclic torsional shear at N
= 20 ...147
Fig. 6.25. Surface settlement and Volumetric strain due to cyclic torsional shear at N = 30 ...148
Fig. 6.26. Surface settlement and Volumetric strain due to cyclic torsional shear at N = 40 ...149
Fig. 6.27-a. Variation of surface settlement and volumetric strain for N = 1 to 40 ...150
Fig. 6.27.-b Variation of surface settlement and volumetric strain for N = 1 to 40 ...151
Fig. 6.28. Variation of surface settlement and volumetric strain for N = 1 to 40 ...152
Fig. 6.29. Distribution of relative density after cyclic torsional shearing at N = 5 ...153
Fig. 6.30. Distribution of relative density after cyclic torsional shearing at N = 10 .154 Fig. 6.31. Distribution of relative density after cyclic torsional shearing at N = 20 .155 Fig. 6.32. Distribution of relative density after cyclic torsional shearing...156
Fig. 6.33. Change of density due to cyclic torsional shearing at N = 5 ...157
Fig. 6.34. Change of density due to cyclic torsional shearing at N = 10 ...158
Fig. 6.35. Change of density due to cyclic torsional shearing at N = 20 ...159
Fig. 6.36. Change of density due to cyclic torsional shearing ...160
Fig. 6.37. Soil density cups buried at different elevations in Lift 1 ...161
Fig. 6.38. Surface settlement and Volumetric strain after static load on Lift 1 ...162
Fig. 6.39. Surface settlement and Volumetric strain after shearing compaction for N = 20 on Lift 1 ...163
Fig. 6.40. Distribution of relative density in Lift 1 ...164
Fig. 6.41. Change of density after shearing compaction for N = 20 in lift 1 ...165
Fig. 6.42. Soil density cups buried at different elevations in Lifts 1 and 2 ...166
Fig. 6.43. Surface settlement and Volumetric strain after static load on Lift 2 ...167 Fig. 6.44. Surface settlement and Volumetric strain after shearing compaction for N =
xv
20 on Lift 2 ...168 Fig. 6.45. Distribution of elevation density in Lift 1 and 2 ...169
Fig. 6.46. Change of density after shearing compaction for N = 20 in Lift 1 and 2...170
Fig. 6.47. Soil density cups buried at different elevations in Lifts 1 to 3…171 Fig. 6.48. Surface settlement and Volumetric strain after static load on Lifts 3…172 Fig. 6.49. Surface settlement and Volumetric strain after shearing compaction for N =
20 on Lift 3 ...173 Fig. 6.50. Distribution of relative density in Lift 1 to 3……….174 Fig. 6.51. Change of density after shearing compaction for N = 20 in Lift 1 and 3 ..175 Fig. 6.52. Soil density cups buried at different elevations in Lifts 1 to 4………176 Fig. 6.53. Surface settlement and Volumetric strain after static load on Lift 4……177 Fig. 6.54. Surface settlement and Volumetric strain after compaction for N = 20 on Lift 4……….………...178 Fig. 6.55. Distribution of relative density in Lift 1 to 4………179 Fig. 6.56. Change of density after shearing compaction for N = 20 in Lift 1 to 4…..180 Fig. 6.57. Soil density cups buried at different elevations in Lift 1 to 5…………..181 Fig. 6.58. Surface settlement and Volumetric strain after static load on Lift 5……..182 Fig. 6.59. Surface settlement and Volumetric strain after shearing compaction for N = 20 on Lift 5……….……….183 Fig. 6.60. Distribution of relative density in Lift 1 to 5……….184 Fig. 6.61 Distribution of relative density with mean and standard deviation…….185 Fig. 6.62. Change of density due to cyclic torsional shearing in Lift 1 to 5…….186 Fig. 6.63. Controllers for different shearing angles ...187 Fig. 6.64. Variation of torque T for different shearing angles ...188
xvi
Fig. 6.66. Maximum shear stress for shearing angles ...190 Fig. 6.67. Surface settlement and Volumetric strain due to static vertical load ...191 Fig. 6.68. Surface settlement and Volumetric strain due to shearing angle = ±1˚ . 192 Fig. 6.69. Surface settlement and Volumetric strain due to shearing angle = ±2˚ ..193 Fig. 6.70. Surface settlement and Volumetric strain due to shearing angle = ±3˚ ..194 Fig. 6.71. Surface settlement and Volumetric strain due to shearing angle = ±5˚ ..195 Fig. 6.72. Surface settlement and Volumetric strain due to shearing angle
= ±10˚ ...196 Fig. 6.73. Surface settlement and Volumetric strain due to shearing angle
= ±15˚ ...197 Fig. 6.74. Surface settlement and Volumetric strain due to shearing angle
= ±20˚ ...198 Fig. 6.75. Surface settlement and Volumetric strain due to shearing angle
= ±30˚ ...199 Fig. 6.76. Variation of surface settlement and volumetric strain for = 1 to 30 ...200 Fig. 6.77. Variation of surface settlement and volumetric strain for = 1 to 30 ...201
xvii
List of Symbols
Cu = Uniformity Coefficient
Dr = Relative Density
D10 = Diameter of Ottawa Sand whose Percent finer is 10%
D60 = Diameter of Ottawa Sand whose Percent finer is 60%
emax = Maximum Void Ratio of Soil
emin = Minimum Void Ratio of Soil
f = Frequency Gs = Specific Gravity
N = Number of Cycle T = Torque
z = Depth from Surface = Normal Stress = Unit Weight of Soil
max = Maximum Torsional Shear Stress
= Disc Rotation Angle
= Angle of Internal Friction of Soil i = Angle of Interface Friction
sw = Angle of Side-Wall Friction
1
Chapter 1
INTRODUCTION
In the construction of highway embankments, earth dams, and many other engineering structures, engineers are often required to compact loose soils to increase their densities. The purpose of the compaction operation is to improve the engineering properties of soil such as increasing shear strength, reducing permeability and
compressibility. Various techniques had been used to increase the bearing capacity of shallow foundations, to increase the factor of safety against possible slope failure of embankments and earth dams, and to reduce the shrinkage and swelling of soils.
1.1 Objectives of Study
In the past commonly methods used for soil improvement included compaction, vibroflotation, dynamic compaction, compaction sand pile, blasting method, vibro rod, and stone columns. Most of these engineering methods may produce loud noise and vibration during compaction, thus not suitable for use in the metropolitan area. In this study, the cyclic torsional shear compaction was introduced as an alternative construction method. With this compaction method, the relative density of sand could increase from 36% up 85%. This method produced low noise and no low vibration. The purpose of this study is to investigate the change of volume and relative density in the soil mass due to cyclic torsional shear compaction.
2
1.2 Research Outline
This research utilizes the nonyielding soil bin facility at NCTU and the cyclic torsional shear compactor (CTSC) to investigate the relative density.
Previous studies by Chen (2011) and Liu (2012) indicated that for the CTSC with a 0.3m diameter shear disc could compact the loose sand to achieve a relative density of 70 to 75%. However, the effectively depth of compaction was only 0.15 m-thick. In NAVFAC DM7.2 (US Navy 1982), the compaction thickness of 0.2-0.3 m was generally recommended. To achieve the suggested compaction thickness, a new CTSC with a 0.45m-diameter shearing disc was designed, constructed and test in this study.
Air-dry Ottawa sand was used as fill material. The soil specimen used was 1.5m-long, 1.5m-wide, and 1.5-high.
This paper reports experimental data associated with the volume and relative density change due to the cyclic torsional shearing compaction.
1.3 Organization of Thesis
This thesis was divided into the following parts:
1. Review of past investigations regarding cyclic torsional shear compaction of cohesionless soils (Chapter 2)
2. Description of the National Chiao Tung University soil bin, and cyclic torsional shear compactor (Chapter 3)
3. Soil characteristic and soil density control technique (Chapter 4) 4. Testing procedure (Chapter 5)
5. Experimental results of surface settlement, volume change, and relative density distribution due to compaction (Chapter 6)
3
Chapter 2
Literature Review
Das (2010) stated that the soil at a construction site may not always be totally suitable for supporting structures such as buildings, bridges, highways, and dams. For example, in granular soil deposits, the in situ soil may be very loose and perform a large settlement under loading. In such a case, the soil needs to be improved to decrease it deformability.
Sometimes the top soil layers are undesirable and must be removed and replaced with better soils on which the structural foundation can be built. The soil used as fill should be well compacted to sustain the desired structural load. Compacted fills may also be required in low-lying areas to raise the ground elevation for the construction of foundation.
To improve its engineering properties, contractors are generally required to compact the loose soils to increase their unit weights and reducing settlements. Previous studies associated with the compaction-induced effects such as the change of soil density, the volume change in the soil mass and mechanism of soils under compaction are discussed in this chapter.
2.1 Soil Improvement with Densification
Kramer (1996) defined the common soil improvement techniques to mitigate seismic hazards. Soil improvement methods were divided into four categories including, (1) densification techniques (vibrofloatation, vibro rod, dynamic compaction, blasting,
4
and compaction grouting); (2) reinforcement techniques (stone columns, compaction piles, and drilled inclusions); (3) grouting and mixing techniques (permeation grouting, intrusion grouting, soil mixing, and jet grouting), and (4) drainage techniques. In this thesis, only the densification of cohesionless soil was discussed.
2.1.1 Densification Techniques
Fig. 2.1 shows two of the many possible ways that a system of equal-sized spheres can be packed. The simple cubic packing in Fig. 2.1 (a) is the loosest of the stable arrangements. The dense packings in Fig. 2.1 (b) represent the densest possible state for such a system. A dense packing of soil spheres can be reached by soil densification techniques.
2.1.2 Soil Densification with Vibratory Compactor
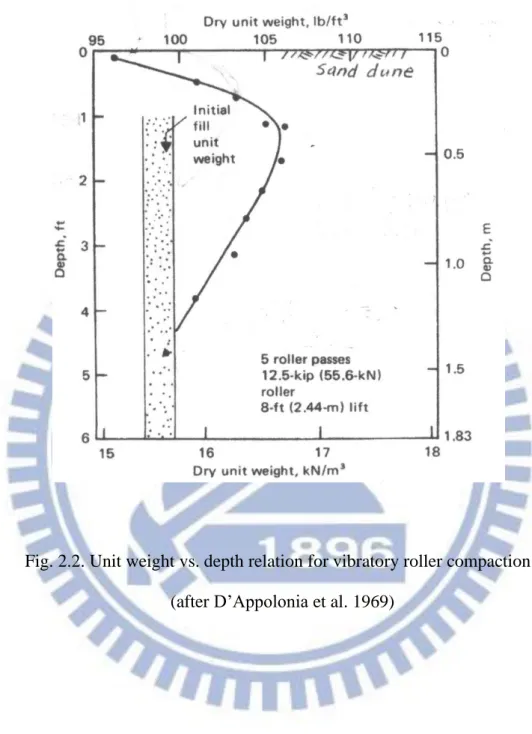
D’Appolonia et al. (1969) proposed the vibratory rollers are particularly useful for compacting granular soils. Fig. 2.2 shows the effects of compaction of a 8-ft lift dune sand after five passes by a vibratory roller. The low unit weight that remains in the uppermost zone is due to vibration and lack of confinement in sand. Fig. 2.3 shows the compacted unit-weight profiles for the same dune sand after 2, 5, 15, and 45 roller passes. For field compaction work, the specification requires that the granular soil be compacted to a certain minimum relative density at all depths. Determination of the height of each lift depends on the type of roller and the economic number of passes. The method for determination of the lift height is shown in Fig. 2.4. For soils at all depths to reach a minimum relative density Dr = 75%, the lift thickness should be
5
2.2 Cyclic Simple Shear Test
The cyclic simple shear test is a convenient method for determining the shear modulus and damping ratio of soils. It is also a convenient device for studying the liquefaction behavior of saturated cohesion less soils. In Fig.2.5, Airey and Wood (1987) showed the NGI cyclic simple shear apparatus. In the cyclic simple shear test, a soil specimen, usually 20-30 mm high with a diameter of 60-80 mm, is subjected to a vertical effective stress v and a cyclic shear stress τ, as shown in Fig. 2.6. The
horizontal load necessary to deform the specimen is measured by the horizontal load cell (Fig. 2.5), and the shear deformation of the specimen is measured by the linear variable differential transformer (LVDT).
2.2.1 Study of Youd
Youd (1972) reported the experimental results regarding the void-ratio reduction of sand due to cyclic simple shearing. Fig. 2.7 shows the gradual densification of sand by repeated shear displacement in a simple shear test. Each cycle of shear straining reduces the void ratio of the soil by a certain amount, although at a decreasing rate. Decrease in volume of the sand, as shown in Fig. 2.7, can take place only if drainage occurs freely. In the figure, after 10,000 cycles, the void ratio of sand was reduced from 0.54 to 0.42. It is obvious from the figure that cyclic shearing is an effect measure to densify the cohesionless soil.
6
2.2.2 Study of Hsu and Vucetic
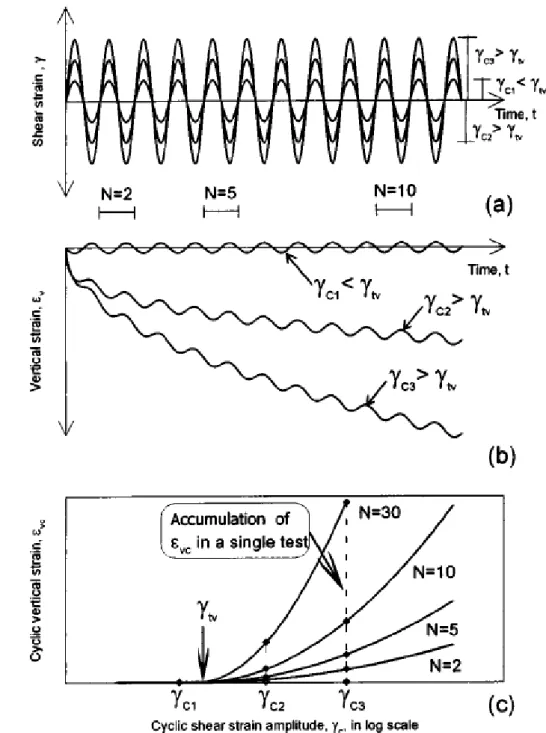
Hsu and Vucetic (2004) studied the volume decrease of dry or partially saturated sands subjected to several cycles of cyclic shear strain amplitudes c. If the cyclic shear
strain amplitudesc1 are smaller than a certain threshold value called the volumetric
cyclic threshold shear strain tv (c1 <tv), their volume will not change. Such cyclic
behavior is depicted schematically in Fig. 2.8. In the figure the results of three cyclic strain-controlled direct simple shear (DSS) tests conducted on dry or partially saturated specimens are sketched. The variations of shear strain over time t are presented in Fig. 2.8(a). The resulting variations of vertical strain v are presented in Fig. 2.8(b). The
relationship betweenc , the permanent cyclic vertical strainvc, and the number of
cycles N, is presented in Fig. 2.8(c). The cyclic vertical strain vc in Fig. 2.8(c) is taken
asv at the end of cycle N, and it is also called the cyclic settlement strain.
It can be seen in Fig. 2.8(c) how below certaintv the soil does not settle (vc = 0),
while above it, it settles significantly (vc > 0). Accordingly, the amplitudetv represents
the boundary between two fundamentally different types of volume change behavior. Belowtv , the soil particles are not displaced with respect to each other and the soil’s
mineral skeleton and volume remain practically unchanged during cycling loading. When the soil is subjected toc >tv , the particles are displaced with respect to each
other irreversibly, resulting in permanent changes of the soil’s volume and microstructure. It is clear in Fig. 2.8 that the cyclic shearing is an effective method to reduce the vertical strain of soil, and to densify the soil mass.
2.3 Cyclic Torsional Simple Shear Test
Fig. 2.9 shows the cyclic torsional simple shear device proposed by Ishibashi et al. (1985). In this device, with a hollow cylindrical specimen 71.1 mm in outside diameter,
7
50.8 mm in inside diameter, and 142.2 mm in height, can be subjected to independent variations of axial stress, inner and outer confining pressure, and torsional shear stress or strain. The device could closely simulates the in-situ stress condition.
2.3.1 Study of Ishibashi et al.
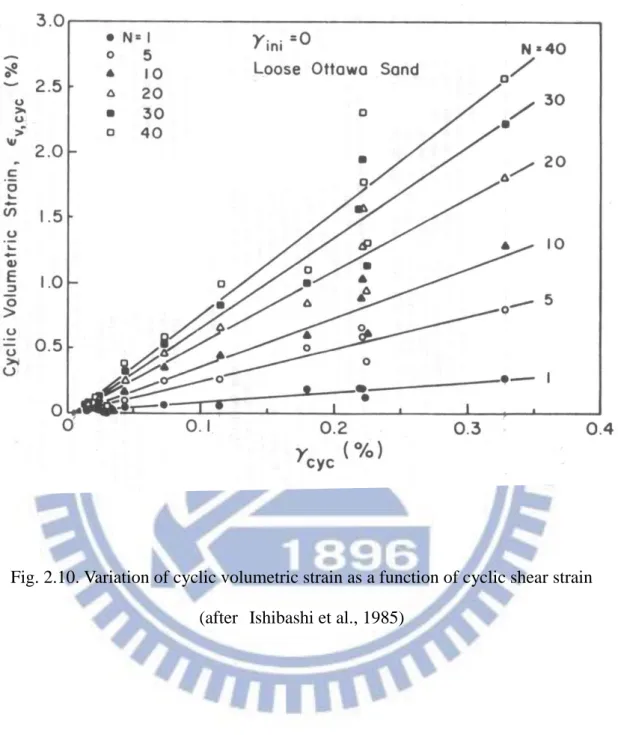
Ishibashi et al. (1985) studied the volume change of a hollow cylindrical Ottawa sand specimen subjected to cyclic torsional shearing in drained conditions. The experiments were conducted under uniform cyclic shear strains and the following conclusions were drawn. In Fig. 2.10, relationships between the induced cyclic volumetric strain the uniform cyclic shear straincyc for a given number of cycle is
nearly linear. It is clear in Fig. 2.10 that the volume reduction of the soil specimen is significantly influenced by the cyclic shear strain cyc and the number of cyclic shear
8
2.4 Densification with Cyclic Torsional Shearing
2.4.1 Study of Yang
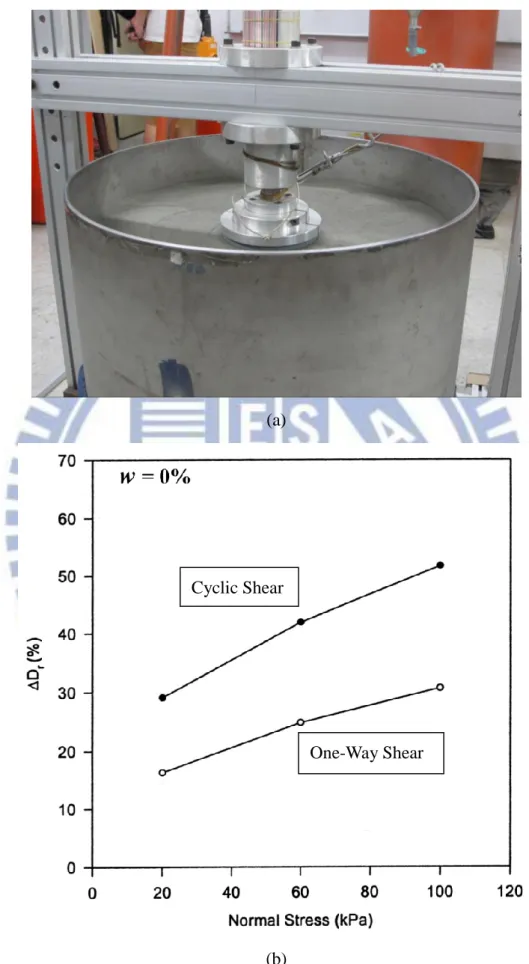
Yang (2002) used the disc-shearing instrument (Fig. 2.11(a)) at Chung-Yuan University to study the soil settlement due to cyclic torsional shearing. The diameter of the circular shearing disc was 198 mm. The diameter of the cylindrical sandy specimen was 200 mm, and the height of the soil specimen was 105 mm. The cyclic shear tests were carried out with initial relative densities from 30 % to 50 %, and normal stresses applied from 7 kPa to 150 kPa. One-way and cyclic (N=1) shear stresses were applied on Mailiao sand, Vietnam sand, and Ottawa sand. Fig. 2.11(b) shows the relative density increase ∆𝐷𝑟 due to cyclic shearing (N=1) was about twice that due to one-way shearing.
2.4.2 Study of Ren
Ren (2006) studied the soil densification due to cyclic torsional shearing. The diameter of the sandy specimen was 200 mm and the height was 105 mm. The diameter of the shear disc was 198 mm. Mailiao sand, Ottawa sand and Vietnam sand were tested with an initial relative density of 30 %. Normal stresses of 20, 60 and 100 kPa, and the shear angle 10˚, 20˚, 30˚, 60˚ and 90˚ were used for testing.
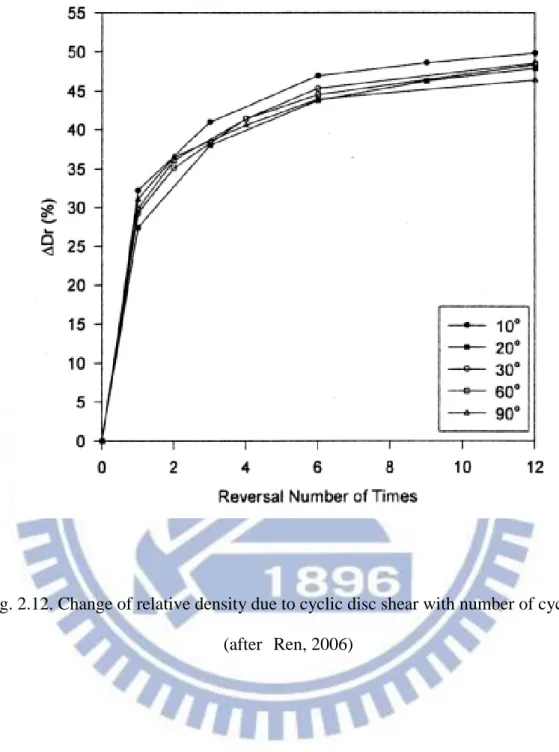
Fig. 2.12 showed the relative density of sand increased with increasing number of cyclic shear stress application N. The first 6 cycles ofτcyc application was most effective.
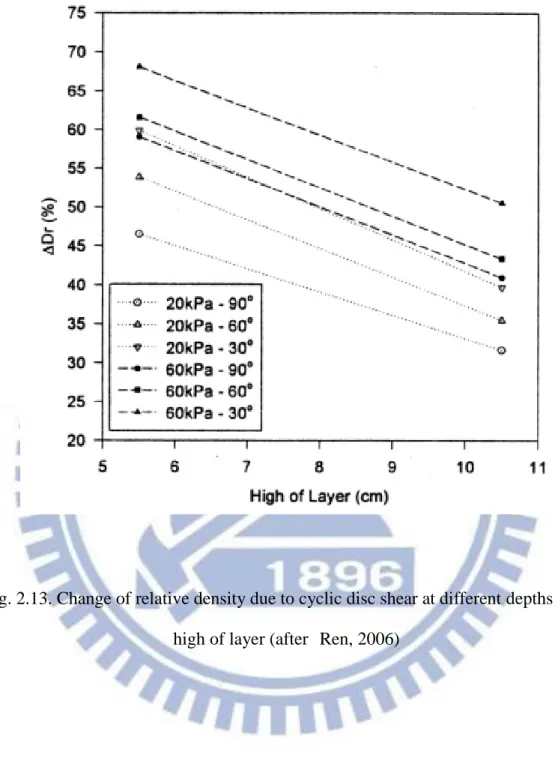
Fig. 2.13 showed a greater relative density increment was achieved at a shallow depth. Less Dr increment due to the cyclic shear stress was observed at a deeper depth.
2.4.3 Study of Huang
9
mm-diameter, 150 mm-high soil bin. The diameter of the shearing disc was 200 mm, and the (tank diameter)/ (disc diameter) ratio was 3.0.
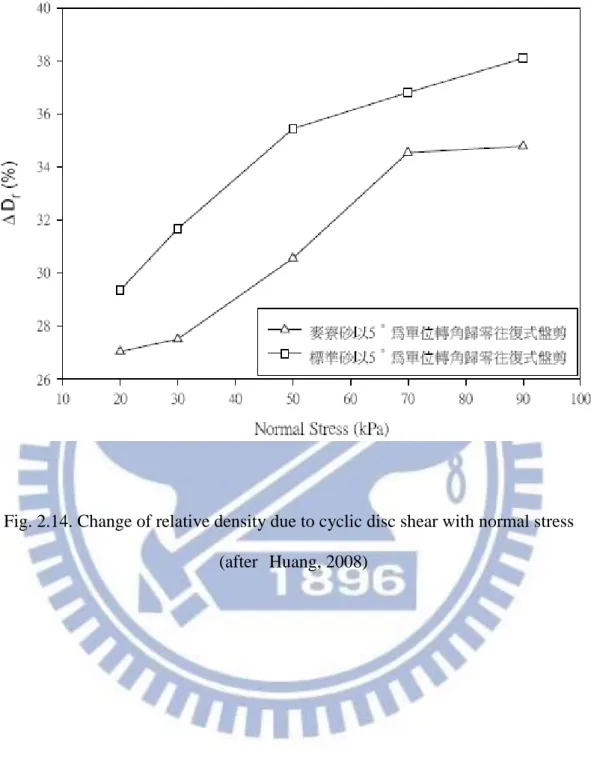
To include two different grain characteristics, Mailiao sand and Ottawa sand were selected as soil specimen. The initial relative density of the soil sample before shearing was 50 %. The applied vertical normal stress varied 10 to 90 kPa, the cyclic shearing angle varied from 5∘to 45∘. Fig. 2.14 indicated, for both Mailiao and Ottawa sand, the relative density of sand increased with increasing normal stress σ.
2.4.4 Study of Chen
Chen (2011) presents experimental data on the settlement and relative density change due to cyclic torsional shearing compaction. A new cyclic torsional shearing compactor was designed and constructed at NCTU. The thickness (T) of the soil after compaction was 0.6 m. The initial relative density was 34.5% ± 2.3% and the vertical pressure on the surface loading was 9.2 kPa. Fig. 2.15 showed the soil surface settlements after 1, 2, 5, 10, 20, 30 and 40 cycles of cyclic torsional shearing. It was obvious that the soil settlement increased with increasing number of cycles (N) of torsional shearing.
In the first 2 cycles of torque application, surface settlement increased significantly. However, after N = 20, the major part of settlement has accomplished, soil particles were sheared and reached a densely-packed condition. Therefore, it was difficult to increase the settlement any further with more cyclic shear application.
Fig. 2.16 showed the relative density distributions of the compacted specimen for N = 1, 2, 5, 10, 20 and 40. Test results showed that the density distribution increased with increasing number of cycles of torsional shearing.
0.15m-10
thick lift, and the distribution of relative density in Lifts 1 to 4. Test results revealed that the trend of pressure distribution in each 0.15 m-thick lift was similar. The average relative density achieved in each lift was greater than the required value of 70 %~75% (US Navy DM-7 1982).
2.4.5 Study of Liu
Liu (2012) presents experimental data on the settlement, relative density and earth pressure due to cyclic torsional shearing compaction (CTSC). The CTSC was designed and constructed by Chen (2011) at NCTU. The vertical static load (q = 9.2 kPa) and cyclic torsional shearing were applied on the surface of the four 150 mm-thick lifts. Then cyclic shearing was applied with rotation angles of +1°, +3°, +5°, +7° and +10° for 20 cycles. It was obvious that the soil surface settlement increased with increasing rotation angles (θ) of torsional shearing. A cone penetrometer was used to measure cone resistance qc with depth in the compacted soil mass. Based on the test results, the
following conclusions were drawn.
Fig. 2.18 showed that the variation of surface settlement with the disc rotation angle from 0° to +10°. After 20 cycles of torsional shearing with the rotation angle of
= ±10° on the surface of the four 150 mm-thick lifts, the average surface settlement was 38.2 mm (volumetric strain = 6.4%). The surface settlement due to the static load q was 19.0mm. The extra surface settlement due to the torsional shearing compaction was about 19.2 mm. It is obvious that the cyclic torsional shearing compaction (static plus cyclic loads) is an effective method to densify loose soil.
Fig. 2.19showed that relative density distribution for θ = 0° to +10°. In the figure,
the relative density of compacted fill increased with increasing disc rotation angle θ. With static load q = 9.2 kPa and the lift thickness of 150 mm, after 20 cycles of torsional
11
shearing with angle of ±5°, the relative density achieved was 72 to 84%. The compacted relative density increased with increasing angle.
Fig 2.20 showed the distribution of normalized qc for the compacted fill. For the
loose fill, the qc/ qc,loose was 1.0. In Fig 2.20, the cone resistance ratio qc/ qc,loose increased
from 4.6 to about 9.0 due to cyclic torsional shear compaction. Test results showed the effect of static vertical load and the cyclic torsional shearing on the cone resistance of soil were quite obvious.
2.5 Requirements of Soil Improvement
ASTM Test Designation D-4253 (2007) provide a procedure for determining the minimum and maximum dry unit weights of granular soils. These unit weights can be used to determine the relative density of soil compacted in the field. The term relative density is commonly used to indicate the in situ denseness or looseness of a granular soil. The relative density of soil is defined as :
x 100% ( 2.1 )
where e = in situ void ratio of the soil, emax = void ratio of the soil in the loosest state,
emin = void ratio of the soil in the densest state.
Das (2010) reported that the value of Dr may vary from a minimum of 0 % for
very loose soils to a maximum of 100 % for very dense soils. Soils engineers qualitatively describe the granular soil deposits according to their relative densities. In-place soils seldom have relative densities less than 20 to 30 %. Compacting a granular soil to a relative density greater than about 85 % is difficult. Lambe and Whitman (1969)
12
reported that for dense soils the value of Dr was 65 to 85 % as shown in Table. 2.1. In
the compaction requirements and procedure, US Navy Design Manual NAVFAC DM-7 (1982) reported that DM-70 to DM-75 % relative density can be obtained by proper compaction procedures. For coarse-grained, granaler well-graded soil, vibratory compaction generally is the most effective procedure.
2.6 Maximum Index Density and Unit Weight of Soils
Using a Vibratory Table
ASTM Test Designation D 4253 – 93 (2007) provided a test method for determining the maximum index density/unit weight of cohesionless, free-draining soils using a vertical vibrating table.
The maximum index density/unit weight of a given free-draining soil is determined by placing either oven-dried or wet soil in a mold, applying a 2-lb/in2 (13.78 kPa)
surcharge (dead weight) to the surface of soil, and then vertically vibrating the mold, soil, and surcharge (see Fig. 2.21). Without the surcharge on the soil surface, a low unit weight zone might remain in the upper most part of the compacter soil due to lack of confinement in sand. Use either an electromagnetic, eccentric, or cam-driven vibrating table having a sinusoid-like time-vertical displacement relationship at a double amplitude of vertical vibration (peak-to-peak) of about 0.013 in. (0.33 mm) for 8 min at 60 Hz, or 0.019 in. (0.48 mm) for 10 min at 50 Hz. The maximum index density/weight is calculated by dividing the oven-dried mass/weight of the densified soil by it volume (average height of densified soil times area of mold).
13
Chapter 3
Experimental Apparatus
To investigate the effects of cyclic torsional shear compaction on the relative density of a cohesionless soil mass, the instrumented non-yielding model retaining wall facility at National Chiao Tung University (NCTU) was used. All soil improvement experiments described in this chapter were conducted in the soil bin of the NCTU non-yielding model retaining wall facility. This chapter introduces the soil bin, cyclic torsional shear compactor used for laboratory experiments.
3.1 Soil Bin
The soil bin shown in Fig. 3.1, which was fabricated with steel plates with inside dimensions of 1,500 mm ×1,500 mm ×1,600 mm. The model wall in Fig. 3.1. is 1.5 m-wide, 1.6 m-high, and 45 mm-thick. To achieve an at-rest condition, the wall material should be nearly rigid. It is hoped that the deformation of the walls could be neglected when the soil bin is filled with cohesionless soil. In Fig. 3.1, twenty-four 20 mm-thick steel columns were welded to the four sidewalls to reduce any lateral deformation during loading. In addition, twelve C-shaped steel beams were welded horizontally around the box to further increase the stiffness of the box.
Assuming a 1.5 m- 3,
o was pluviated into the soil bin. A 45 mm-thick
solid steel plate with a Young’s modulus of 210 GPa was chosen as the model wall material. The estimated deflection of the model wall would be only 1.22 × 10⁻³ mm.
14
Therefore, it can be concluded that the lateral movement of the wall is negligible. The end-wall and sidewalls of the soil bin were made of 35 mm-thick steel plates. Outside the steel walls, vertical steel columns and horizontal steel beams were welded to increase the stiffness of the end-wall and sidewalls. If the soil bin was filled with dense sand, the estimated maximum deflection of the sidewall would be 1.86 × 10⁻³ mm.
From a practical point of view, the deflection of the four walls around the soil bin can be neglected.
3.2 Cyclic Torsional Shear Compactor
In previous studies Chen (2011), and Liu (2012) showed that cyclic torsional shearing compaction is an effective method to improve the engineering properties of loose sand. However, since the diameter of the shearing, disc was only 300mm, the compaction was effective for only the relatively-thin top soil layer.
Fig 3.2 shows, under the application of the same vertical pressure p, the settlement S1 of a full sized footing of width b1 in a structure will always be greater than the
settlement S2 of a smaller test plate of width b2. This is because the depth to which
vertical pressure of the same intensity p will penetrate is a function of the width b of the footing.
The effective depth of compaction plays an important role in field earthwork. The effects of compaction with a smooth-wheel vibratory roller can easily reach an effective depth of 0.3 m. In this study, the effective depth of compaction was increased by adjusting the diameter of the shearing disc D up to 450 mm.
To enhance an effective soil compactor with less noise, and less vibration, a cyclic torsional shear compactor (CTSC) was developed at National Chiao Tung University (NCTU). To increased effective compaction depth, the diameter of the shearing disc
15
was enlarge to 450 mm. Fig 3.3. and Fig 3.4. show the cyclic torsional shear compactor. The entire cyclic torsional shear compactor consists of four components, namely: (1) shearing disc; (2) surcharge weight; and (3) torque loading device. The design and construction of cyclic torsional shear compactor is introduced as follows. The new compactor was designed by the author of thesis.
3.2.1 Shearing Disc
Fig. 3.3 shows the disc diameter is 450 mm, and the steel base disc is 25 mm-thick. To efficiently carry the applied cyclic shear stress from the disc to the soil, 12 radial steel fins were carved on the bottom of the shearing disc as shown in Fig. 3.5. Fig. 3.6 shows the steel radial fin was 3 mm-thick, 6 mm-wide and the wedge angle of the fin was 90∘. Under the vertical pressure, the steel fin would bite into the soil mass. To provide adequate friction between the disc and the soil, the bottom of the shearing disc was covered with a layer of anti-slip frictional material called Safety-Walk (3M). The slip resistant tape was attached to the disc bottom on the fan-shaped areas between the steel fins as shown in Fig. 3.7.
3.2.2 Surcharge Weight
1. Ultimate Bearing Capacity of a Circular Footing
Vesic (1973) proposed three failure modes of shallow foundations, which included general shear failure, local shear failure and punching shear failure. Fig. 3.8 showed a strip foundation with a width of B resting on the surface of soil, and the nature of bearing capacity failures Fig 3.8 illustrated the relationship between the load per unit area q and the foundation settlement for three failure modes. The load per unit area of
16
foundation at which shear failure in soil occurred was called the ultimate bearing capacity.
Vesic (1973) proposed a relationship for the mode of bearing capacity failure of foundations on resting on sands (shown in Fig. 3.9). The mode of failure was affected by the relative density of sand, depth of foundation embedment and the effective footing width. In this study, the initial relative density of loose sand was 36 % (see Fig. 4.12 in chapter 4), the static was applied on the surface of sand (Df = 0). To determine the failure mode of the circular loading disc used in this study, with Dr = 36%, Df = 0, and B* = B = the diameter of shearing disc. In fig. 3.9, the point was located between the punching and local shear failure zone.
Terzaghi (1943) suggested that for a continuous foundation, the failure surface in soil at the ultimate load may be assumed to be similar to that shown in Fig. 3.10. The effect of soil above the bottom of the foundation may be replaced by an equivalent surcharge, 𝑞 = 𝛾𝐷𝑓, where γ is a unit weight of soil and 𝐷𝑓 is the depth of embedment of the footing.
Using the equilibrium analysis, Terzaghi expressed the ultimate bearing capacity 𝑞𝑢 in the form
𝑞𝑢 = 𝑐′𝑁𝑐+ 𝑞𝑁𝑞+ 1
2𝛾𝐵𝑁𝛾 (3.1)
where 𝑐′ = cohesion of soil
𝛾 = unit weight of soil
𝑁𝑐, 𝑁𝑞, 𝑁𝑟 = bearing capacity factors that are non-dimensional and are functions only of the soil friction angle ∅′.
To estimate the ultimate bearing capacity of a circular foundation, Eq. (3.1) may be modified to:
𝑞𝑢 = 1.3𝑐′𝑁
17
In Eq. (3.2), B equals the diameter of foundation. In this study, B equals the diameter of the shearing disc of the CTSC. For the foundations that exhibited the local shear failure mode in soils, Terzaghi suggested the following modification to Eq. (3.2)
𝑞𝑢 = 0.867𝑐′𝑁′
𝑐 + 𝑞𝑁′𝑞+ 0.3𝛾𝐵𝑁′𝛾 (3.3)
𝑁′𝑐, 𝑁′𝑞, and 𝑁′𝛾, the modified bearing capacity factors, can be calculated by using
the bearing capacity of factors equations (for Nc, Nq, Nr, respectively) by replacing ϕ =
tan−1(2 3tan
−1𝜙′). The variation of N
c, Nq and Nr with the soil friction angle’ is given
in Table 3.1.
Ho (1999) conducted the direct shear tests to establish the relationship between the internal angle and unit weight of Ottawa sand used for this study, as shown in Fig. 3.11. For the air-pluviated fill, the empirical relationship between soil unit weight andangle was formulated by Chang (2000) as follows
(3.4) where
= angle of internal friction of soil (degree) = unit weight of fill (kN/m3)
Eq. (3.4) is applicable for = 15.45 ~ 17.45 k/m3 only.
Based on equation (3.4), corresponding to= 15.6 kN/m3 for loose sand, the
corresponding internal friction angle = 31.3˚.
To calculate the ultimate bearing capacity of the circular loading disc eqn. (3.3) was rearranged.
For a circular disc with diameter 0.45m (B = 0.45 m), acting on the surface (q = Df = 0) of a cohesionless soil (C’ = 0), Equation (3.3) became:
𝑞𝑢 = 0.3𝛾BN𝛾
18
3.30 kPa.
ASTM Test Designation D 4253 – 93 (2007) provided a test method for determining the maximum index density/unit weight of cohesionless, free-draining soils using a vertical vibrating table. In this method, a 2-lb/in2 (13.78 kPa) surcharge (dead weight) was applied to the surface of soil, then vertically vibrating was applied. Without the surcharge vertical stress of 13.78kPa on the soil surface, a low unit weight zone might remain in the upper most part of the compacter soil due to lack of confinement.
In this study, a surcharge pressure of q = 10.35 kPa was applied on the soil surface during the cyclic shearing process. This q = 10.35 kPa was about 3.1times the ultimate bearing capacity of circular disc on loose sand (qu = 3.30 kPa). This q=10.35 kPa was
only about 75% of the surcharge pressure suggested by the ASTM D4235-93. This loading was selected because the shear stress applied was directly proportion to the normal stress applied. A light normal stress would induce a low cyclic shear stress, which might be hard to compact the loose fill. A heavy stress would induce a high cyclic shear stress, which might make it impossible to operate the CTSC test manually. It should be mentioned that the effects of compaction might be strongly affected by the applied surcharge stress. It was assumed that the contact pressure between the load disc and the soil was uniform. For this study, the vertical surcharge pressure of 10.35 kPa was used throughout the investigation.
2. Design of Surcharge Weight
The surcharge weight of the CTSC is loaded by normal loading discs. Table 3.2 shows the mass, thickness, and radius of the normal loading discs available for this study. As shown Fig 3.12, the outside-diameter steel disc is 290 mm. The diameter of the screw rod hole is 21.6 mm, the diameter of the torque shaft hole is 43 mm, and the
19
diameter of the hoist screw hole is 10.25 mm.
3.2.3 Torque Loading Device
The entire torque loading device consists of two components, namely: (1) Torque shaft and connecting frame, and (2) Torque wrench.
1. Torque Shaft and Connecting Frame
Fig. 3.13 and 3.14 show the dimensions of the torque loading frame at the top of the torsional shear device. The hoist ring was placed on top of the frame so that torsional shear compactor be lifted and lowered by the overhead crane in the laboratory. Two hexagon caps were fixed on the arms of the connecting frame, which enable the torque wrench to be hooked up to the connecting frame. The applied torque was transmitted from the torque wrench, to the connecting frame, then to the torque shaft and shear disc as illustrated in Fig. 3.2
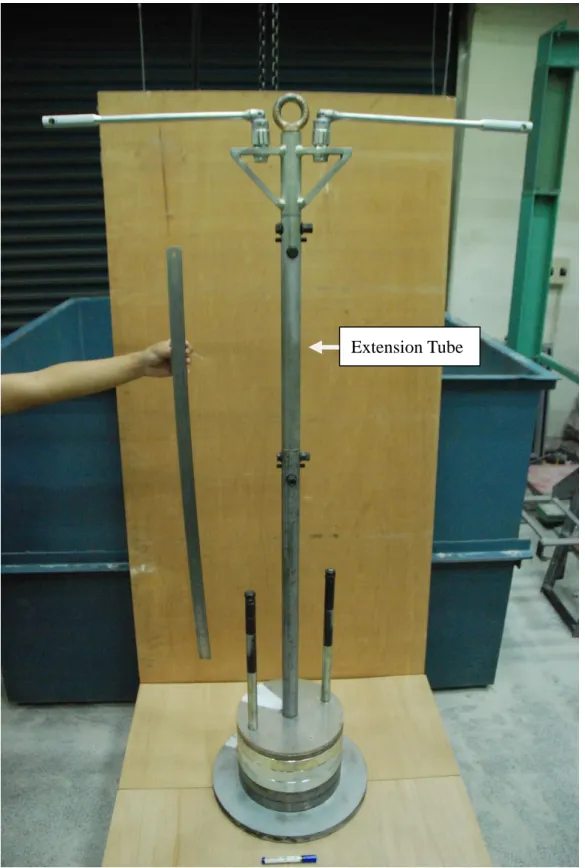
Fig 3.15 (a) and Fig 3.15 (b) the show the dimensions of the extension tube. It can use to connect the CTSC and the connecting frame to lengthen the height of the CTSC. The mass of extension tube is 4.80 kg, which can be the surcharge weight of the CTSC. Fig 3.16show the CTSC is connected by the extension tube. It can use to compact the deep of the soil bin when the CTSC cannot shear with two torque wrenches.
2. Torque Wrench
Fig. 3.17 (a) shows, the torque wrench is 430 mm long. Fig. 3.17 (b) shows the torque wrench made of stainless steel. During testing, proper wrench length was selected so that no collision between the torque wrench with the sidewall of the soil bin would occur. The torque wrench was attached to the torque loading frame to induce torsional shear on the loose fill.
The digital torque wrench shown in Fig. 3.18 and Fig. 3.19 was used to measure torque applied to the soil. The digital torque wrench has a digital torque value readout.
20
Accuracy in the clockwise direction was +/- 1%, and the accuracy in the counterclockwise direction was +/- 2%. Readout units included N-m, ft-lb, in-lb and kg-cm. The digital torque wrench made by OLY SCIENTIFIC Equipment Ltd. (model 921/200E) was 530 mm. The maximum operation range is 200 N-m. The square drive is 12.7 mm x 12.7 mm.
Without any normal loading disc, the mass of the CTSC frame is 49.4 kg. Adding 5 pieces of 19.80 kg, 1 piece of 9.6 kg, 1piece of 4.8 kg, 1 piece of 1.55 kg, 3 pieces of 1.05 kg and 1 piece of 0.5 kg loading normal discs, the total mass of the entire CTSC became 168.0 kg.
The weight of the entire CTSC is equal to 1.65 kN. The diameter of the shearing disc is 0.45 m, and the area of the bottom of the shearing disc is 0.159 m2. The vertical
pressure acting on the surface of the fill due to the weight of the CTSC is q = weight / area = 10.35 kPa. For all tests, the vertical pressure of 10.35 kPa, which is equal to the ultimate bearing capacity of the loose sand under circular shearing disc, was used throughout the investigation. It should be mentioned that this thesis is intended to report the preliminary experimental results obtained from a light-weight cyclic torsional shear compactor.
21
Chapter 4
Soil Characteristics
This chapter introduces the properties of the fill, and the reduction of friction between the soil and lubricated side wall. The control and measurement of soil density distribution in the fill are also introduced.
4.1 Soil Properties
Air-dry Ottawa sand (ASTM C-778) was used throughout this investigation. Table 4.1. showed that physical properties of the soil include Gs = 2.65, emax = 0.76, emin =
0.50, D60 = 0.39 mm, and D10 = 0.26 mm. Grain-size distribution of the soil is shown in
Fig. 4.1. Major factors considered in choosing Ottawa sand as the fill material are summarized as follows.
1. Its round shape, which avoids the effect of angularity of soil grains.
2. Uniform distribution of grain size (coefficient of uniformity Cu = 1.5), which avoids the effects due to soil gradation.
3. High rigidity of solid grains, which reduces possible disintegration of soil particles under loading.
4. Its high permeability, which allows fast drainage and therefore reduces water pressure behind the wall.
22
4.2 Side-wall Friction
To simulate the field condition of a infinite half space for compaction, the shear stress between the fill and the side walls of the soil bin should be minimized to nearly frictionless. To reduce the friction between sidewall and fill Fang et al. (2004) suggested to use a lubrication layer fabricated with plastic sheets. Two types of plastic sheeting, one thick and two thin plastic sheets, were adopted to reduce the interface friction. All plastic sheets were hung vertically on the side walls before the soil was deposited as shown in Fig. 4.2.
In this study, two thin (0.009 mm-thick) and one thick (0.152 mm-thick) plastic sheets were adopted for the soil improvement experiments. Fig. 4.3 shows the variation of side-wall friction angle sw as a function of the normal stress for the plastic sheet
method (1 thick + 2 thin sheeting) reported by Fang et al. (2004). The measured side-wall friction angle with this method was about 7.5°. For all experiments in this paper, the lubrication layers were applied on four side walls of the soil bin.
4.3 Control of Soil Density
4.3.1 Air-Pluviation of Loose Sand
To achieve a uniform soil density in the fill, Ottawa sand was deposited by air-pluviation method into the soil bin. The air-air-pluviation method had been widely used for a long period of time to reconstitute laboratory sand specimens. Rad and Tumay (1987) reported that pluviation is the method that provides reasonably homogeneous specimens with desired relative density. Lo Presti et al. (1992) reported that the pluviation method could be performed for greater specimens in less time.
23
Das (2010) suggested that, for granular soil deposits, the relative density Dr of
15~50% is defined as loose, Dr = 50~70% is defined as medium, and Dr = 70~85% is
defined as dense. For the air-pluviation method, Fig. 4.4 shows the soil hopper let the sand flow through a calibrated slot opening at the lower end. A picture of the soil pluviating processes is shown in Fig. 4.5. To achieve a loose fill, Chen (2003) adopted the drop height of 1.0 m and hopper slot opening of 15 mm. In this study, the drop height of 1.0 m and the hopper slot-opening of 15 mm were also selected to achieve the loose fill. In Fig. 4.6, under such a condition, Ho(1999) indicated that the expected relative density of soil was about 35%.
4.3.2 Measurement of Soil Density
To observe the distribution of soil density in the soil bin, soil density cups were made. The soil density cup made of acrylic is illustrated in Fig. 4.7. The cylindrical cup wall was only 10 mm-high, so that the shear deformation and volume reduction could occur in the cup during testing. A picture of the soil density cup is shown in Fig. 4.8. During the preparation of the 1.5 m-thick loose soil specimen, density cups were buried in the soil mass at different elevations and different locations in the fill as shown in Fig. 4.9 and Fig. 4.10. After the loose soil had been filled up to 1.5 m from the bottom of the soil bin by air-pluviation, density cups were dug out from the soil mass carefully. Fig. 4.11 shows the mass of the cup and soil in the cap was measured with an electrical scale.
For a 1.5 m-thick air-pluviated Ottawa sand layer, the distribution of soil density with depth is shown in Fig. 4.12. For the loose sand, the mean unit weight is 15.6 kN/m2, the mean relative density is D
r = 36 % with the standard deviation of 2.0 %. Das
24
50% is defined as loose sand. The loose relative density Dr = 36 % achieved by the
25
Chapter 5
Testing Procedure
The procedure to conduct the cyclic torsional shear test is introduced in this chapter. The testing procedure can be divided into three parts: (1) specimen preparation; (2) application of vertical static load; and (3) application of cyclic torsional shearing. These parts will are illustrated in the following sections with pictures.
5.1 Specimen Preparation
Fig. 5.1 shows air-dry Ottawa sand in the soil storage.The soil was shoveled from the soil storage to the sand hopper, and the mass of the fill was measured with an electrical scale (Fig 5.2). Fig. 5.3 shows the sand hopper was lifted by the overhead crane in the laboratory. Fig. 5.4 shows Ottawa sand was deposited by air-pluviation method into the soil bin. To achieve the loose backfill, the drop height was controlled to be 1.0 m and the hopper slot-opening of 15 mm were selected. The 1.0 m-long rope next to the hopper was used to control the drop distance. Fig. 5.5 (a) and (b) show portable ladders were placed on top of the sidewalls, and a bridge board was placed between the ladders. Throughout the test, the operator stayed on the bridge board to avoid any unexpected surcharge on the soil specimen.
Fig. 5.6 shows the leveling of the pluviated soil surface by the student with a brush. Fig. 5.7 shows density cups were buried in the soil mass at different elevations in the fill. Fig. 5.8 shows how check the density cup horizontal with a bubble level. The empty eight density cups were placed on the surface of the soil layer. The air-pluviation of soil
26
and density cup placement operations were repeated unit a fill thickness T = 1.5 m was reached.
5.2 Application of Vertical Static Load
The procedure to apply the vertical static load on top of the air-pluviated loose sand is introduced. The cyclic torsional shear compactor (Fig. 3.4) used to apply static load has a footing diameter of 0.45 m and the vertical static load q = 10.35 kPa. Fig. 5.9 (a), (b), (c), and (d) illustrates the loading pattern on soil surface. For applying four times of vertical static load, the 3x3 loading formation is based four points A, B, C, and D.
Fig. 5.10 shows the CTSC was hoisted with overhead crane into the soil bin. Fig. 5.11 shows the vertical static load was applied on the loose sand with four different loading pattern shown in Fig. 5.9 (a) to (d). The combination of static load footprint caused a uniform surcharge on the soil structure. Fig. 5.12shows the soil surface of the 4 patterns of vertical static load.
5.3 Application of Cyclic Torsional Shearing
In this study, the cyclic torsional shear was applied on the soil surface with a rotation angle of +5∘to -5∘. Fig. 5.13 show that applied the CTSC with the rotation angle controller on the loose fill. In Fig. 5.14, 5.15 and 5.16, with a rotation angle indicator and controller, the rotation angle of the shearing disc could be effectively controlled to be from 0∘to +5∘and -5∘. The application of cyclic torsional shear to loose sand is shown inFig. 5.17.
For the test with N = 20, the soil surface after the torsional shear for the 3x3 loading formation (Fig. 5.9 (a)) for the first 5 cycles is shown in Fig. 5.18 (a). To prevent disc penetration due to continuous shearing at the same location, the shearing was moved to
27
another 3x3 formation (Fig. 5.9 (b)) for N = 6 to 10. The soil surface after shearing compaction for N = 6 to 10 is shown inFig.5.18 (b). Fig. 5.18 (c) and (d) show that the soil surface after the loading pattern for N = 11 to 15 (Fig. 5.9(c)) and N = 16 to 20 (Fig. 5.9 (d)).
To determine the relative density of soil in the cup, Fig. 5.19 shows the density cup was carefully dug out of compacted soil mass. Fig. 5.20 (a) to (c) show the scraping of soil toward the edge of the density cup with a spatula. Fig. 5.21 shows the brush away of soil particles from the base plate of cup. Soil mass in the cup was measured with an electrical scale and the relative density of the compacted soil could be calculated.
28
Chapter 6
Test Results
This chapter showed experimental results regarding soil densification due to static load and cyclic torsional shearing. The vertical static load applied of the fill was q = 10.35 kPa. The cyclic torque T and shear stress 𝜏𝑚𝑎𝑥 applied on the soil surface was
measured and calculated, respectively. Experiments were first conducted on the surface of a 1.5 m-thick soil lift. The surface settlement S and relative density Dr distribution of
the soil layer due to the static load and cyclic torsional shear were measured. The rotation angleof the shearing disc varied between +5∘and -5∘, and the number of loading cycle N varied from 1 to 40. In the second part of this chapter, to obtain a soil mass with a relative density greater than 70 to 75%, experiments were applied on the fill for five 0.30 m-thick lifts. Each lift was compacted with the cyclic torsional shear compactor with q = 10.35 kPa, = +5∘, and N = 20.
6.1 Static Load Tests on a 1.5 m-thick Lift
To separate the densification effects due to static and cyclic loadings, in this section, the surface of a 1.5 m-thick soil lifts was compressed with the static vertical loading q only. Effects of soil densification such as the volume change, change of relative density in the compressed fill were investigate.
For this test, a 1.5 m-thick lift was prepared by air-pluviation method. Fig 6.1 (a) and (b) showed that the density cups were buried in the soil mass at different elevations and locations in a 1.5 m-thick fill. Fig 6.2 showed that measure points A to I for surface
29
settlement. The surface settlements of a 1.5 m-thick compressed soil lift due to the static load of the compactor were investigated. The initial relative density of the loose fill was 36 ± 2% (see Fig. 4.12.) The applied static normal stress was q = 10.35 kPa. To achieve a uniform settlement, the vertical loading was applied on the surface with four different 3x3 formations as indicated in Fig. 5.9.
6.1.1 Volume Change Due to Static Load
Fig. 6.3 showed the settlement measurement was carried out with the laser distance meter placed between two steel beams. The surface settlements were measured at measure at points A to I indicated in Fig 6.2. Fig. 6.4 (a) showed that surface settlement of Lift1 due to static load, the minimum and maximum values were 14.1 mm and 17.4 mm. The average of surface settlement was 15.4 mm.
To express the dimensional volume change characteristics, the volume change data was normalized by dividing the volume change ∆V by the original volume V0 to obtain
the volumetric strain v. The fill in the soil bin does not allow any lateral deformation.
Only vertical compression was allowed for volume change. The horizontal cross-section of soil mass was kept a constant A. The volumetric strain v of the soil mass is
defined as: v, % = ∆V V0 × 100 = ∆H×A H0×𝐴 × 100 = ∆H H0 × 100 (6.1)
Fig. 6.4 (b) showed the volumetric strain of Lift 1 due to static loading. The induced volumetric strain v was about 1.02 %. It is obvious that static vertical loading
is an effective method to compress the loose fill. To limit the scope of thesis, only the vertical stress q = 10.35 kPa was used throughout this study.
30
6.1.2 Relative Density after Static Load
To investigate the relative density distribution in the compressed fill, density cups were buried in soil mass at different elevations and locations as shown in Fig. 6.1. (a) and (b). For the un-compacted loose soil, the initial relative density was about 36 % (see Fig 4.12). Fig. 6.5 showed the distribution of relative density with depth due to the application static vertical load = 10.35 kPa on the 1.5 m-thick lift. The segmental line was obtained by connecting data point closet to the average Dr for at the depth. It
is obvious show that the relative density increase at the top of the lift. The relative density increase was most apparent in the upper 0.45m of the lift, was equal to the diameter of the shearing disc. However, in the lower part the lift the relative density did not enough to reach the target value of Dr = 70 to 75 % required by NAVFAC DM-7
(US Navy 1982).
6.1.3 Relative Density Increase Ratio
To investigate the effects of the cyclic torsional shear compaction, the relative density increment ∆𝐷𝑟 = 𝐷𝑟,𝑁− 𝐷𝑟,𝑙𝑜𝑜𝑠𝑒 is defined, where 𝐷𝑟,𝑁 = the relative density due to compaction with N cycles of shearing, 𝐷𝑟,𝑙𝑜𝑜𝑠𝑒 = the relative density of
loose sand. Fig 6.6 (a) showed that the distribution of relative density increment due to static load with depth. In the figure, near on the top of the fill, the relative density increased significantly. Little Dr increase was observed near the bottom of the 1.5
m-thick fill.
To study the effects due to cyclic torsional shearing compaction, a new index was defined in this section. The relative density increment was normalized by the relative density of loose sand. The Relative Density Increase Ratio, RDIR, was defined as: