國
立
交
通
大
學
環境工程研究所
碩士論文
分子拓印暨光子晶體感測器開發與酚甲烷分析之應用
Fabrication of molecularly imprinted photonic crystals for
detection of bisphenol A
研 究 生:陳姿吟
指導教授:張淑閔 博士
分子拓印暨光子晶體感測器開發與酚甲烷分析之應用
Fabrication of molecularly imprinted photonic crystals
for detection of bisphenol A
研 究 生:陳姿吟 Student:Tzu-Yin Chen
指導教授:張淑閔 Advisor:Sue-Min Chang
國 立 交 通 大 學
環 境 工 程 研 究 所
碩 士 論 文
A ThesisSubmitted to Institute of Environmental Engineering College of Engineering
National Chiao Tung University In partial Fulfillment of the Requirements
for the Degree of Master
in
Environmental Engineering
June 2010
Hsinchu, Taiwan, Republic of China
I
中文摘要
酚甲烷(BPA)已被認定為環境荷爾蒙且會存在環境中而影響人體荷爾蒙,本研究針 對 BPA 開發新穎性分子拓印暨光子晶體型元件,並藉由元件與目標化合物結合所引起 的折射率與光子能隙變化產生的繞射波長位移量,對標的物進行定量分析。分子拓印利 用模板分子-BPA 以 π-π 作用力與官能基單體-苯基三甲氧基矽氧烷(PTMOS)鍵結,並與 交連劑-正丙醇鋯(ZPO)聚合形成無機高分子材料。當 BPA/PTMOS 莫耳比為 1 時,分子 拓印材料對 BPA 具有良好的吸附能力(4.62 mg/g)以及拓印因子(20.8)。另外,無機分子 拓印光子晶體利用模版溶膠凝膠法製備,聚苯乙烯小球(163 nm)先以重力沉降法,於溫 度 50o C 下在玻片上自組裝形成六角最密堆積的蛋白石結構,隨後添加體積為 2.5 L 之 拓印溶膠溶液充填聚苯乙烯模板間隙,待固化後以溶劑移除模板,便可得到 BPA 分子 拓印暨光子晶體型感測元件,此二氧化鋯反蛋白石結構具有高規則性三維孔洞以及光子 能隙 4.8 eV(波長 = 257 nm)。當拓印溶膠溶液之 ZPO/PTMOS/BPA/乙醇莫耳比為 30/1/1/80 時,有最佳化微結構,可使分子拓印暨光子晶體元件在偵測 50 mg/L BPA 過程 中於 4 分鐘內達到吸附平衡,且產生最大波長位移 3.2 nm,此元件擁有良好的重複使用 性與高線性偵測範圍(1-60 mg/L),而方法偵測極限為 0.41 mg/L。另外,由類似分子酚 (phenol)、丁基苯酚(4-tert-butylphenol)以及 1-奈酚(1-naphthol)近乎零的波長位移結果可 證明感測元件對於目標分子 BPA 具有高度的選擇性。本研究最後利用寶山水庫原水添 加 BPA 來模擬實際偵測情況,發現感測元件於真實樣品中的線性分析範圍為 1 至 100 mg/L。綜合上述實驗結果,證明本研究製備之分子拓印光子晶體感測器兼具高選擇性及 反應快速的特性,為未來極具發展潛力的新型態先進感測器。II
Abstract
Bisphenol A (BPA) is an endocrine disruptor which could cause hormone-related cancers. In this study, a novel imprinted photonic crystal (IPC) was developed for the detection of bisphenol A (BPA). The shifts in the wavelength of the diffraction peaks, resulting from the changed refractive index (n) of the IPC after rebinding of BPA, were adapted for the quantification of the target compound. The molecularly imprinted polymer (MIP) was prepared using a sol-gel method in which zirconium propoxide (ZPO) was used as the cross-linker and phenyltrimethoxysilane (PTMOS) was used as the functional monomer which bound BPA via π-π stacking interaction. The MIP with the PTMOS/BPA molar ratio of 1 had the high adsorption capacity of 4.62 mg/g and imprinted factor of 20.8. Inverse opal photonic crystal was prepared using polystyrene (PS) microspheres (163 nm) as the template. Hexagonal PS colloid crystals was formed through a heat-assisted self-assembly method at 50oC. After infiltration of the colloidal crystals with 2.5 L imprinted sol solution, the PS microspheres were subsequently removed using solvent extraction. The obtained inverse opal ZrO2 exhibited a photonic bandgap of 4.8 eV ( = 257 nm). The IPC prepared with the ZPO/PTMOS/BPA/EtOH molar ratio of 30/1/1/80 exhibited the optimal microstructures for the largest wavelength shift of 3.2 nm at 50 mg/L BPA. The detection can be completed within 4 min. In addition, a small variation of 4.6% was obtained in 5 detection cycles. The linear detection range in pure water and the raw water from Pao-Shan reservoir was 1-60 and 1-100 mg/L, respectively. The IPC performed insignificant response for BPA analogues including phenol, 1-naphthol and 4-tert-butylphenol (BP), indicating its high selectivity. These results clearly demonstrated that the IPC is an advanced sensing device which can be applied for in-situ and on-site analysis in the future.
III
誌謝
三年來的學習歷程,承蒙指導教授張淑閔老師辛勤指導,給予培養獨立思考以及磨 練的機會,更要感謝口試委員董瑞安教授與孫毓璋教授,在論文的撰寫和修改上給予我 很多寶貴的指正與建議,使論文得以更臻完善,特別感謝大學老師郭茂松教授,無時給 予的鼓勵與關心。 也要謝謝清大醫環所董家實驗室的 Judy、Michelle、Barry 與 Ruby 不厭其煩的協助 與提攜;實驗室的學長姊 Evelyn、Brad、Claire、Wes,在我實驗上的指引與生活的關照, 學弟妹 Adam、Karen、Ian、Ashley、Jiphi、Jerome 的每日小劇場,在我苦悶的研究上 充滿樂趣;陪我一路走來的好搭檔雞雞姊姊,在我研究與生活陷入窘狀時的即時相救; 自美國飛來的候鳥 Charles,丁丁般的搞笑讓我又氣又笑;親愛的同學百百、狗狗、安 安、馬路、金門、OK 還有一樓最正靖宜,給我的支援與歡樂;朋友淑淑、玉芬、媛媛、 屁屁、雅婷、庭瑛、億伶、巧于,在我茫然無助時聽我牢騷和給予打氣。更要由衷感謝 我的家人默默地在背後,給予無虞的精神支持與無匱乏的經濟,讓我心無旁騖專注於學 業,更是我漫長研究生涯所持的毅力支柱與前進動力,最後謝謝你陪伴在我身邊,給予 包容與一起分享喜悅,衷心地感謝給予我幫助的所有人。 僅謝給每一個曾經在我人生路上給予鼓勵的家人與朋友。IV
Contents
中文摘要 ... I Abstract ... II 誌謝 ... III Contents ... IVTable Index ... VIII
Figure Index ... IX
Chapter 1 Introduction ... 1
1-1 Motivation ... 1
1-2 Objectives ... 3
Chapter 2 Background and Theory ... 5
2-1 Endocrine disruption chemicals ... 5
2-1-1 Introduction... 5
2-1-2 Environmental monitoring for Bisphenol A ... 7
2-2 Sensor devices ... 9
2-2-1 Sensing materials ... 10
V
2-3 Molecularly imprinted polymer (MIP) ... 12
2-3-1 Strategy of molecularly imprinted polymer ... 13
2-3-2 Imprinted methods ... 14
2-4 Photonic crystal ... 17
2-4-1 Principle of photonic crystal ... 17
2-4-2 Preparation of photonic crystal ... 19
2-5 Sensing applications ... 21
2-5-1 Photonic crystal sensor ... 21
2-5-2 Molecular imprinted polymer ... 22
2-5-3 Imprinted photonic crystal sensing devices... 23
Chapter 3 Materials and Methods ... 25
3-1 Chemicals ... 25
3-2 Photonic crystal ... 30
3-2-1 Synthesis of monodisperse PS microspheres ... 30
3-2-2 Fabrication of the opal structure... 32
3-2-3 Fabrication of the inverse opal structure ... 32
3-3 Preparation of molecularly imprinted polymer ... 34
3-4 Fabrication of imprinted photonic crystal (IPC) ... 36
3-5 Characterization ... 38
VI
3-5-2 Transmission Electron Microscopy (TEM) ... 38
3-5-3 UV-visible Spectrometry (UV-visible) ... 38
3-5-4 Dynamic Light Scattering (DLS) ... 39
3-5-5 Fourier Transform Infrared Spectrometer (FTIR) ... 39
3-5-6 Specific Surface Area (BET) ... 39
3-5-7 X-ray photoelectron Spectroscopy (XPS) ... 40
3-5-8 Adsorption ... 41
3-5-9 Selectivity ... 42
3-6 Sensing capability of imprinted photonic crystal (IPC) ... 44
Chapter 4 Results and Discussion ... 46
4-1 Molecularly imprinted polymer ... 46
4-1-1 Adsorption ... 46
4-1-2 Characterizations ... 51
4-2 Photonic crystal ... 54
4-2-1 Opal structure ... 54
4-2-2 Inverse opal structure... 58
4-3 Optimization of imprinted photonic crystal (IPC) ... 63
VII
4-3-2 Solvent ... 65
4-3-3 Functional monomer ... 70
4-4 Sensing capability of imprinted photonic crystal (IPC) ... 72
4-4-1 Molecularly imprinted affinity ... 72
4-4-2 Response time ... 73 4-4-3 Selectivity ... 74 4-4-4 Sensitivity ... 76 4-4-5 Applications ... 79 Chapter 5 Conclusions ... 82 References ... 83 Appendix ... 90
VIII
Table Index
Table 2-1 List of some chemical compounds assorted as EDCs ... 6
Table 2-2 Reported analytical methods have been employed for the determination of BPA. ... 8
Table 2-3 Comparison of different detection methods. ... 11
Table 2-4 Comparison of covalent and non-covalent imprinting.[41] ... 16
Table 2-5 Reported sensing devices have been developed using imprinting method and photonic crystal. ... 23
Table 3-1 Structures of the major reagents used in photonic crystal and imprinted polymers. ... 28
Table 3-2 Physicochemical properties of compounds used for selective adsorption test. ... 43
Table 4-1 The surface properties of the MIP and its corresponding NIP. ... 52
Table 4-2 Structural properties of the IPC. ... 69
IX
Figure Index
Figure 1-1 Chemical structure of BPA. ... 1
Figure 1-2 Fabrication of an IPC for detection of BPA... 4
Figure 2-1 Concept of the representation of a sensor. ... 9
Figure 2-2 Molecular imprinting by Fischer’s lock-and-key concept. ... 12
Figure 2-3 Synthesize process of MIP. ... 13
Figure 2-4 Representation of the covalent and non-covalent imprinting processes. ... 15
Figure 2-5 Models for one-dimensional, two-dimensional and three-dimensional periodicities in a medium. ... 17
Figure 2-6 Scheme of the optical path of incident light in photonic crystal. ... 19
Figure 3-1 Flow chart of experimental design in this study. ... 27
Figure 3-2 Experimental apparatus for the polymerization. ... 31
Figure 3-3 Mechanism of oil-in-water emulsion polymerization of PS. ... 31
Figure 3-4 Formation of PS array through a heat-assisted sedimentation on a glass substrate. ... 32
X
microspheres. ... 33
Figure 3-6 Preparation procedure of the molecularly imprinted sol solution. ... 34
Figure 3-7 Mechanism of the formation of BPA imprinted ZrO2. ... 35
Figure 3-8 Time scale of the preparation process of IPC. ... 37
Figure 3-9 Detection process of BPA using the IPC. ... 44
Figure 4-1 Equilibrium adsorptions of the MIP toward BPA (50 mg/L)... 46
Figure 4-2 Adsorption isotherm of the MIP toward BPA. ... 48
Figure 4-3 (a) Adsorption capacity and (b) selectivity factor of the MIP and its corresponding NIP for 50 mg/L of BPA and its analogues. ... 50
Figure 4-4 SEM images of the MIP and the NIP. ... 51
Figure 4-5 FTIR spectra of (a) BPA, the NIP, and the MIP before and after rebinding at 400-4000 cm-1 and (b) the magnification of the IR spectra of the MIP at 600-1500 cm-1. ... 53
Figure 4-6 Photo image of the home-made PS suspensions. ... 54
Figure 4-7 Particle distribution of the PS microspheres. ... 55
Figure 4-8 SEM images of the PS opal structures dried at different temperatures. (a) 40oC, (b) and (c)50oC, (d) 60oC and (e) 70oC. ... 56
XI
Figure 4-9 UV-visible reflection spectra of the PS opal structures dried at different
temperatures (40-70oC). ... 57
Figure 4-10 SEM images of inverse opal ZrO2 prepared with different volumes of the sol solution (a) 10 μL, (b) 5 μL, (c) 3 μL, (d) 2.5 μL and (e) the low
magnification of (d). ... 59
Figure 4-11 TEM image of the inverse opal ZrO2 prepared with 2.5 μL sol solution... 60
Figure 4-12 UV-visible reflection spectra of the porous and non-porous ZrO2. The
insert figure was the UV-visible spectra of non-porous ZrO2. ... 61
Figure 4-13 UV-visible reflection spectra of the IPC prepared using various amounts
of ZPO when the PTMOS/BPA/EtOH molar ratio was controlled at 1/1/100. ... 64
Figure 4-14 UV-visible reflection spectra of the IPC prepared using 30 and 40 mM
ZPO before and after rebinding of BPA. ... 65
Figure 4-15 UV-visible reflection spectra of the IPC, which were prepared using
various amounts of EtOH, before and after binding of BPA. ... 67
Figure 4-16 SEM images of the IPC prepared using different amounts of EtOH. (a)
and (b) 50 mM, (c) 60 mM, (d) 70 mM, (e) 80 mM, (g) 90 mM and (g) 100 mM. ... 69
Figure 4-17 UV-visible reflection spectra of the IPC prepared using various PTMOS
amounts of before and after rebinding of BPA. ... 71
XII
mM. ... 71
Figure 4-19 UV-visible reflection spectra of the NIPC before and after rebinding of BPA. ... 72
Figure 4-20 Wavelength shifts of the IPC at different binding time. ... 74
Figure 4-21 UV-visible reflection spectra of the IPC before and after adsorption of different BPA analogues (the concentrations were all controlled at 50 mg/L). ... 76
Figure 4-22 Wavelength shifts of the IPC in response to BPA in DI. ... 77
Figure 4-23 Wavelength shifts of the IPC in response to BPA in Pao-Shan raw water. ... 79
Figure 4-24 The recoverability of IPC in 30 mg/L BPA. ... 80
Figure 4-25 The wavelength shifts of the IPC for detection of 30 mg/L BPA at various pH. ... 81
1
Chapter 1 Introduction
1-1 Motivation
Endocrine disrupting chemicals (EDCs) are the new emerging environmental contaminants because they may cause disruption of endocrine systems as well as affect hormonal control in mankind even at very low concentration level. Bisphenol A (BPA) has been recently suspected as one of endocrine disruptors and presented in environment to cause hormone-related cancers in humans. Figure 1-1 shows the chemical structure of BPA. High performance liquid chromatography (HPLC)[1-10] and gas chromatography-mass spectrometry (GC-MS)[11-13] are two analytical instruments mostly applied for the detection of EDCs. Even though they are able to reach high accuracy and precision, these traditional techniques are high cost, time-consuming, sample pre-treatment and skilled technicians needed, and in-situ application limited.[14] Therefore, it is highly desirable to develop a novel approach which is easy and rapid for in-situ and on-site environmental monitoring of EDCs. C CH3 CH3 OH HO
Figure 1-1 Chemical structure of BPA.
Photonic crystal and molecular imprinting are two promising techniques developed for advanced chemical/biosensors.[15,16] Molecular imprinting is a kind of nano-manipulating methods which patterns polymer matrixes with the sizes, shapes and chemical functionality similar to those of target templates. Because molecularly imprinted polymer (MIP) greatly
2
reduces matrix interference through selectively binds target compound, such materials have been adapted for separation of analogues and pre-concentration of analytes. The usages of MIP for sensing BPA has been demonstrated in many researches.[6,7,17-19] Uniformly sized BPA-imprinted polymers have been prepared using ethylene glycol dimethacrylate (EDMA) and 4-vinylpyridine (4-VPY) as a cross-linker and a functional monomer, respectively. It performed high selectivity factor of 9.4 due to the hydrophobic and hydrogen bonding interactions.[20] Yang et al. have been fabricated BPA-imprinted polyethersulfone (PES) microspheres and proved that the recognition of microspheres toward BPA was effective due to the binding to specific recognition sites.[21]
Transducer is responsible for translating the binding events into readable signals by a physicochemical response including mass, resistance, capacitance or refractive index. Photonic crystal is periodically structured lattices with a photonic band gap, that ranges of frequency and lights cannot propagate in any direction within the structure.[22] Three-dimensional opal and inverse opal structures have been demonstrated to optically determine analytes by the shift in the Bragg diffraction wavelengths.[23-26] Asher et al.[26] developed a polystyrene (PS) colloidal crystalline array which was filled with a hydrogel within its interstitial space. The composite swelled and shrank reversibly in the presence of metal ions and the quantities of the analyses were determined by the changes in the lattice spacing of the colloidal crystals. Qian et al.[25] designed a biosensor based on three-dimensional PS substrate and measured the change in the refractive index during analyte binding.
The combination of MIP and photonic crystal has been applied to fabricate highly sensitive and miniaturized sensors. Hu et al.[27] constructed a silica colloidal crystal with molecularly imprinted structures on each constituent microsphere for protein detection. The
3
advanced sensor reached the detection limit of 1.0 ng/mL. Wu et al.[28] built up a three-dimensionally ordered macroporous structures which contained imprinted polymers on the pore walls for efficient detection of atrazine in aqueous solutions. These current imprinted phonic crystal polymer-based sensors were primarily constructed by organic polymeric materials. They could be deformed or decomposed after periodical usage because of chemical corrosion. In addition, the binding sites for analytes only limited on the surface of the opal or inverse opal crystals. Therefore, analysis of EDCs by the conventional imprinted phonic crystal polymer-based sensors was challenged. Imprinting target compound into inorganic photonic crystal is advanced for sensor because inorganic materials including titanium dioxide (TiO2) and zirconium dioxide (ZrO2) were chemically and mechanically stable under harsh environmental conditions such as pH, temperature and humidity.[29] Moreover, the hierarchical structure provides high quantity of binding cavities for analytes to greatly improve the sensitivity.
1-2 Objectives
In this study, a novel imprinted photonic crystal (IPC) was developed for the detection of BPA. Figure 1-2 schematically illustrate the fabrication of an IPC for the detection of BPA. Three-dimensionally macroporous ZrO2 backbone imprinted with BPA was fabricated using a templating sol-gel method while the PS colloidal crystals were taken as the template. The PS templates and imprinted BPA molecules were removed through solvent extraction using toluene and methanol. The shifts in wavelength resulting from the changes in the refractive index of the IPC after binding with BPA were measured to quantify the target compound. This study optimized the relative concentrations of cross-linker, solvent and functional monomer to reach the highest sensitivity of IPC toward BPA. Furthermore, the sensing
4
capability of the IPC was examined in terms of its detection limit, linear range, response time and selectivity in analogues solutions.
5
Chapter 2 Background and Theory
2-1 Endocrine disruption chemicals
2-1-1 Introduction
Emerging contaminants have existed in the environment for decades, but their implications to the ecosystem and human beings are not attracted much attention until now.[30] Recently, scientists found that some chemicals in the environment have high potential to interfere the endocrine system, which called “endocrine disrupters” or “endocrine disrupting chemicals” (EDCs). EDCs can be defined as an exogenous agent that interferes the synthesis, secretion, transport, bind, action, or elimination of natural hormones in the body that are responsible for the maintenance of homeostasis, reproduction, development, and behavior.[31] Several environmental pollutants are referred to as EDCs by the Environmental Agency of Japan. All people are exposed to chemicals with estrogenic effects in their everyday life, because endocrine disrupting chemicals are found in low doses in literally thousands of products. Chemicals commonly detected in people include alkylphenols, bisphenol A (BPA), dichlorodiphenyltrichloroethane (DDT), polychlorinated biphenyls (PCBs), polybrominated diphenyl ethers (PBDEs) and a variety of Phthalates. Table 2-1 shows the list of common types of EDCs.
EDCs are highly toxic and carcinogenic. They remain in the environment for a long time due to their stability and bioaccumulation. The effects associated with the presence of EDCs in the environment are: (1) increases in the breakage of eggs of birds, fishes and turtles, (2) feminization of male fishes, (3) problems in the reproductive systems in fishes, reptiles, birds and mammals, and (4) changes in the immunologic system of marine mammals.[19] Moreover, EDCs affect the function of the endocrine system by binding to nuclear receptors.[30] The effects of EDCs in human beings reported so far have been: (1) reduction
6
of the amount of sperm, (2) increases in the incidences of breast cancer, (3) testicle and prostate cancers, and (4) the endometriosis.[19] Therefore, EDCs are of great concern because of their potential in altering the normal endocrine function and physiological status of organism.
Table 2-1 List of some chemical compounds assorted as EDCs.[32]
Type Use/Origin
Dichlorodiphenyltrichloroethane (DDT)
Insecticide
Polychlorinated biphenyls (PCBs)
• A class of chlorinated compounds
• Heat medium, non-carbon paper, electric product, industrial coolants and lubricants
Bisphenol A (BPA)
• Raw material for resins
• Found in some plastic water and baby bottles, plastic food containers, dental materials, and the linings of metal food and infant formula cans
Polybrominated diphenyl ethers (PBDEs)
• A class of compounds found in flame retardants • Plastic cases of televisions and computers,
electronics, carpets, lighting, bedding, clothing, car components, foam cushions and other textiles
Phthalates
• Found in some soft toys, flooring, medical equipment, cosmetics and air fresheners
7
2-1-2 Environmental monitoring for Bisphenol A
BPA is a commonly used name for 2,2-(4,4-dihydroxydiphenyl) propane. Among EDCs, BPA is the most frequently detected compounds.[33] BPA is found to be bound to estrogen receptors and causes a weak estrogenic activity in animal experiments. It is a synthesis monomer used in the production of the production of epoxy resins, polysulfones and polycarbonates plastic such as baby bottles; and is one of the highest production synthetic compounds worldwide.[34] At manufacturing and processing facilities, low levels of BPA are directly released to surface waters and the atmosphere via permitted discharges. Therefore, BPA is often contained in environmental water and now is attracting attention. The European Union has assessed a tolerance daily intake (TDI) of BPA at 0.01 mg/g/day, and Japan assessed its TDI of BPA at 0.05 mg/kg/day.[35]
A number of physical and chemical methods for treating wastewater containing BPA have been reported. BPA was efficiently removed and only simple short-chain aliphatic acids were left. Additionally, various techniques appear to effectively aid the monitoring of BPA from wastewater. The useful technique for analyzing BPA in environmental samples has been gas chromatography-mass spectrometry (GC-MS).[11-13] High performance liquid chromatography (HPLC) has also been used, especially with toxicity test samples and atmospheric samples.[1-10] Table 2-2 shows the reported analytical method have been employed for the determination of BPA. These traditional techniques are expensive, time-consuming, sample pre-treatment and skilled technicians needed for operation, thus limiting their practical application in-situ detection.[14] Hence, it is highly desirable to develop a novel approach which is easy and rapid for in-situ and on-site environmental monitoring of BPA without costly instruments.
8
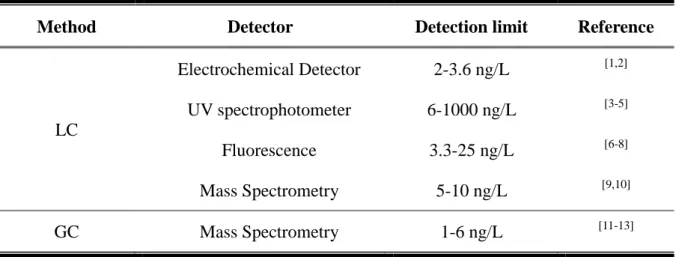
Table 2-2 Reported analytical methods have been employed for the determination of BPA.
Method Detector Detection limit Reference
LC Electrochemical Detector 2-3.6 ng/L [1,2] UV spectrophotometer 6-1000 ng/L [3-5] Fluorescence 3.3-25 ng/L [6-8] Mass Spectrometry 5-10 ng/L [9,10] GC Mass Spectrometry 1-6 ng/L [11-13]
9
2-2 Sensor devices
Sensor is an analytical device that utilizes chemically or biologically responsive sensing layers to recognize a change in chemical or biological parameters of measured environment and to convert this information into an analytically useful signal. Development of sensors with new capabilities is driven by the ever-expanding monitoring needs of a wide variety of species in gases and liquids.[36] An ideal sensor should have high sensitivity, high specificity, quick response, in-situ analysis and portable capability. Figure 2-1 illustrates the concept of the representation of a sensor. In general, a sensor consists of two main components: sensing materials and the transducer. In a sensing system, analytes can be detected by sensing materials, and then converted to the readable singles with transducer.
10
2-2-1 Sensing materials
Sensing materials contain an appropriate indicator which changes its properties in dependence on the analyte. A sensing material in a sensor device is applied onto a suitable physical transducer to convert a change in a property of a sensing material into a suitable physical signal.[36] The key component of most sensors is the recognition element. It is also commonly referred as the “selective layer”. This layer interacts with the analyte to be detected, thereby encountering a characteristic change in one of its physical properties, such as mass, refractive index, light absorbance, reduction potential, etc.[37] A selective chemical signal which resulted from the binding process of the analyte to the recognition element, is subsequently converted into an electrical signal, amplified, and then transformed into a measurable format. The individual sensing elements only need to possess sufficient differential selectivity to yield a unique response pattern for each analyte.[38]
2-2-2 Transducers
After specific recognition elements receive reactive message, there would a segment that convert the molecular recognition event into a quantifiable signal. The signal obtained from a single transducer or an array of transducers is further processed to provide useful information about the identity and concentration of species in the sample.[36] In other words, transducer was the signal transistor, which transforms the physical property into the final readout.[37] Signal transduction has been accomplished with electrochemical, field-effect transistor, optical absorption, fluorescence, surface plasmon resonance and other devices. The individual properties of different detection list in Table 2-3.
11 Table 2-3 Comparison of different detection methods.
Detected method Properties
Electrochemical
• Detect the molecular changes by bonding target • Need electro-activity
• Add electron mediator necessary
Weight
• Signals are detected from the target bond and then caused the weight change of the wafer surface
• Highly sensitive
Optical
• Identify molecular by optical detection (fluorescence) • Impacted easily by external interference fluoresces • Fluorescent materials has photo-bleaching
12
2-3 Molecularly imprinted polymer (MIP)
Molecular imprinting is a kind of nano-manipulating methods which patterns polymer matrixes with the size, shape and chemical functionality similar to those of target templates. It is a useful method for synthesizing tailor-made artificial receptors, while has a relationship between a lock and the key. In recent years, molecularly imprinted polymer (MIP) has been realized a potential method for the design and development for artificial materials with improved molecular recognition capacities.[39] In 1894, Fisher firstly developed the “lock-and-key” notion, which has become one of the most frequently mentioned concepts.[40]
Figure 2-2 is the principle of molecular imprinting by Fischer’s “lock-and-key” concept.
13
2-3-1 Strategy of molecularly imprinted polymer
MIP is a new kind of materials with the prearrangement of structure for specific molecular recognition ability. The main compositions of MIP are template, cross-linker and functional monomer. Commonly, MIP is prepared by allowing a network polymer to form in presence of a template. The fabrication of MIP consists of three main steps: (1) pre-arrangement of the monomers around the target molecule, (2) polymerization in the presence of cross-linker, and (3) removal of the target molecule by extraction process.[41] A template molecule interacts with an appropriate functional monomer to establish specific interactions. The subsequent removal of template in the material remains many cavities which is complementary to the template in terms of sizes and shapes. The imprinted cavities have suitable size, shape, and chemical environment to selectively bind the target molecules.[42] In essence, a molecular “memory” is imprinted on the polymer, which is now capable of selectively rebinding the template.[43] The synthesis of MIP and the imprinting process are represented in Figure 2-3.
14
MIP can be stable in various critical chemical and physical conditions such as good thermal and mechanical for a long time and reused without any alternation to the memory of the template.[41] MIP is receiving increasing attention owing to their high selectivity and affinity for the target molecules. In the past few years, the applications of MIP were expanded to the environmental field for enrichment and separation of target compounds in the sensing and catalytic systems. There are great hopes for the development of a new generation of chemical sensors using these novel synthetic materials as recognition elements.[44] The bio-mimic MIP has a number of potential advantages including high molecular selectivity, molecular memory, the simplicity of their preparation and stability under harsh environment such as pH, humidity and temperature.
2-3-2 Imprinted methods
Essentially, there are two imprinting methods to synthesize MIP. The methods of imprinting are according to interactions between functional monomers and template compounds. In general, the association between the imprinted molecules and monomers is generally based on non-covalent and covalent interactions. Figure 2-4 shows the ordinary preparation of the covalent and non-covalent imprinting processes.[45]
Covalent imprinting refers to molecular imprinting strategies whereby the template and one or more polymerization units are attached by covalent bonds to form a “template-monomer”. The classical methods of covalent imprinting involve boronate esters, metal coordination, acetal/ketal, Schiff base formation and imines to prepare template-monomers.[46] Covalent approach utilizes reversible covalent bonding between a polymerizable monomer and a template molecule. After polymerization, these bonds are cleaved to liberate the template, but they are subsequently reformed in order to selectively
15
bond the target.[41] Although the stronger covalent binding is facile to generate the rigidity and homogeneity of binding site matrix, the subsequent extraction of template is more difficult to reach. Because the covalent imprinting technique leads to strong interactions between the matrix and the target, it is limited by the relatively small number of useful reversible covalent bonding reactions that can be utilized.
Figure 2-4 Representation of the covalent and non-covalent imprinting processes.[45]
The non-covalent interactions include hydrogen bonds, ionic bonds, hydrophobic interactions, electrostatic attraction and Van der Waals’ forces, etc. After the polymerization and removal of the template, the functional groups of the polymeric matrix can then rebind the target via the same non-covalent interactions. Unlike those used in covalent imprinting, the fragile interaction is facilitated extraction or elution in the following procedure and easily obtained. Since non-covalent method is facile to adapt, it is popularly employed in most molecularly imprinting processes.[41] However, the weak interactions limit that the template and target must form a sufficient number of non-covalent intermolecular interactions to generate binding pockets during polymerization. The different effects of covalent and
16
non-covalent interactions on each imprinting steps are listed in Table 2-4.
Table 2-4 Comparison of covalent and non-covalent imprinting.[41]
Terms Covalent Non-covalent
Pre-polymerization Need some synthetic chemistry No need Extraction of
template
Difficult Easy
Rebinding rate Slow Rapid
Binding sites Homogeneous of receptor sites Heterogeneous of receptor sites
Advantages
• Stoichiometriy help lower non-specific interaction • High affinity receptor sites are
easy produced
• Functional groups can be targeted widely
• The preparation process is simply
Disadvantages
• More complex process
• Less functional groups can be used
• Lower template recovery
• Apparent non-specific binding • Low yield of functional high
17
2-4 Photonic crystal
Photonic crystal is a highly ordered material that possesses periodically modulated dielectric constants. Periodicity affects the propagation of electromagnetic waves in the material due to Bragg reflections on lattice planes and results a photonic band gap (PBG) in which light propagation in the photonic crystal is forbidden.[47]
2-4-1 Principle of photonic crystal
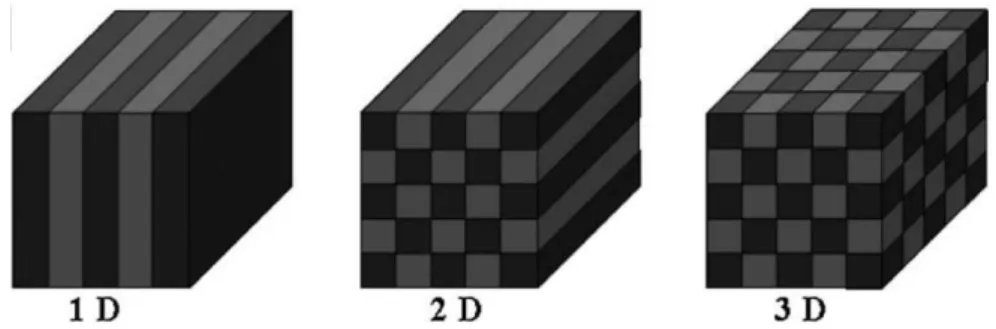
The concept of photonic crystal is a relatively new class of materials which was firstly proposed by Yablonovich and John in 1987.[48] Many researches on photonic crystal have been extended to cover all three dimensions, and the spectral range has been extended from ultraviolet to radio frequencies. Photonic crystal is in one-dimensional, two-dimensional or three-dimensional highly order structures with periodical dielectric constants. Figure 2-5 exhibits different dimensional periodicities in a medium. The one-dimensional version of a photonic crystal has long been known as a multilayer reflector, which has been widely used in optical lenses. And two-dimensional or three-dimensional structure of photonic crystal are the most currently important aspect in the field of photonic crystal.[49]
Figure 2-5 Models for one-dimensional, two-dimensional and three-dimensional periodicities in a medium.[50]
18
The major feature of photonic crystal is the existence of a band gap in its photonic structure that is able to influence the propagation of electromagnetic waves in a similar way as the electronic band gap of a semiconductor does for electrons. Light with frequencies within the band gap cannot propagate within the photonic crystal materials. The photonic crystal will completely diffract incident light in accordance with Bragg’s law (Eq. 2-1).[51]
m
2
d
111(
n
2ef
sin
2)
1/2 Eq. 2-1m: the order of diffraction light
λ: Bragg diffraction wavelength
d111: the spacing between (111) planes
nef: the mean refractive index of the crystalline lattice
θ: the angle between the incident light and the normal to the diffraction planes
Figure 2-6 indicates the refraction of an incident light in photonic crystal. The reflected light in the visible spectrum is called the structural color. Additionally, the optical characteristics of photonic crystal are related to their lattice constants. The other important properties of photonic crystal are ordered structure and anisotropy. Photonic crystal materials provide the opportunity to control the flow of light. The optical properties of these periodic media are determined by the interference of multiply diffracted waves, and therefore are very sensitive to the material parameters such as the refractive index and lattice spacing. This sensitivity can be exploited for the purposes of optical sensing, in a number of different ways.
19
Figure 2-6 Scheme of the optical path of incident light in photonic crystal.[50]
2-4-2 Preparation of photonic crystal
Recently, scientists have discovered that order porous materials with the aperture close to an optical wavelength exhibited special optical properties and can be applied in photocatalysis, adsorption, filtration, and sensors. Top-down lithography and etching processes have been utilized to prepare three-dimensional photonic crystal. However, complex procedures and expensive facilities are required to achieve desired structures. Organisms have an ability of self-assembling that can self-generate hair, teeth and bones. If the preparation simulates such molecular pattern to fabricate structure hierarchically, it would be easier relatively to obtain regularity layer-by-layer. The method also commonly called bottom-up approach. The self-assembly of colloidal crystals is the more preferred route as it is simpler, inexpensive and can yield crystalline samples of a few to several hundred structural layers thinness. In order to manufacture three-dimensional photonic crystal, more research had focused on the self-assembling recently.
Polystyrene (PS), a polymethyl methacrylate and silica microspheres, is the major particle that usually used for the colloidal crystal assembly, as they can be obtained both highly monodisperse and relatively cheap.[52] Based on the difference in structure, photonic
20
crystal can be divided into two categories: opal structure and inverse opal structure. Natural opal is an example of such a periodic colloidal crystal, and is composed of face-centered cubic (fcc) arrays of monodisperse amorphous silica spheres with average diameter in the range 15-900 nm.[47] Opals are formed when the voids between ordered sediments of the colloidal crystal are infiltrated by media having a high refractive index and then solidified. The colloidal crystals are subsequently removed by calcination or solvent extraction, leaving behind a new material with pores that referred as inverse opal structure. The long-range ordering of particles in the structure of photonic crystal results in a number of unique potentially useful properties.
21
2-5 Sensing applications
2-5-1 Photonic crystal sensor
Photonic crystal sensors utilize different fundamental properties of the optical signal including amplitude, frequency, polarization and phase. It results in a vast number of sensor designs such as intensity-based, spectroscopic, polarimetric and interferometric.[53] Numerous examples of photonic crystal sensors are documented. The most common sensors are based on changes in intensity due to absorption, reflection, emission, scattering, fluorescence and surface plasmon resonance.[54] Three-dimensional opal and inverse opal structures have been demonstrated to optically determine analyte molecules by the shift in the Bragg’s diffraction wavelengths.[23-26]
In 1994, Asher et al.[26] developed a PS colloidal crystalline array which was filled with a hydrogel within its interstitial space. The composite swelled and shrank reversibly in the presence of metal ions and the quantities of the analyses were determined by the changes in the lattice spacing of the colloidal crystals. Qian et al.[25] designed a biosensor based on three-dimensional PS substrate and measured the changes in the refractive index during analyte binding. Endo et al.[55] constructed a colloidal crystal-based chemical sensor with a reversibly tunable structural color for volatile organic compounds (VOCs) detection. The device consisted of a glass substrate with three-dimensional colloidal crystal and poly-dimethylsiloxane (PDMS) elastomer that was capable of swelling after rebinding pollutants. Reese et al.[56] built a colorimetric reagent that particles composed of an intelligent polymerized crystalline colloidal array for the determination of Pb2+, pH and temperature. If the pH, ionic strength or temperatures change, the diffracted wavelength of the polymerized crystalline colloidal array will shift due to changes in the volumes. Those sensors and biosensors can be direct, measuring the intrinsic properties of the analyte.
22
2-5-2 Molecular imprinted polymer
The obvious advantages of MIP are exhibited a highly specific recognition ability and a selective adsorption toward analyte. MIP have been designed not only as molecular recognition materials but also as sensing materials that couple a readable signal to a binding event, which can then be used to directly detect and quantify the target analyte. When the analytes have a chromophore or a fluorophore, the binding events can be read out if these compounds show any spectral changes due to the binding. An aspect in design of MIP based sensor is important due to the low price, chemical stabile and high selectivity.[57]
Marx et al.[58] designed a thin film that was a molecularly imprinted sol-gel polymer with specific binding sites for parathion. Vandevelde et al.[59] used fountain pen microlithography to deposit arrays of MIP microdots on flat substrates. It was able to show analyte binding to the dots by fluorescence microscopy with the aid of a fluorescent model analyte. Murray et al.[60] developed a sensor that was able to selectively measure the hydrolysis product of the nerve agent Soman in water. The sensor was functioned by selectively and reversibly binding the phosphonate hydrolysis product of Soman to the imprinted polymer processing a coordinative bound luminescent lanthanide ion. Matsui et al.[61] reported a MIP for the detection of adrenaline. The sensing mechanism was based on the variable proximity of the Au nanoparticles within the imprinted polymer, which displayed selective binding of the adrenaline accompanied by swelling that caused a blue-shift in the immobilized Au nanoparticles plasmon absorption band. Additionally, if the target species exhibit inherent chemical properties such as optical and fluorescence, it can be used transducers. Greene and Shimizu[38] constructed a colorimetric sensor array composed of seven MIP was shown to accurately identify seven different aromatic amines. The response of the imprinted polymer array was coupled to a colorimetric response, using a benzofurazan dye displacement strategy.
23
According to the literatures, MIP may construct a new type of sensors that are as stable as conventional chemical sensors and as selective and sensitive.
2-5-3 Imprinted photonic crystal sensing devices
Due to MIP and photonic crystal has the specific features individually, it is conceivable that if these two promising techniques are combined, the formed materials with hierarchical porous structure would be “ideal” for developing molecular sensors with a series of desired features. The combination of MIP and photonic crystal has been applied to fabricate highly sensitive and miniaturized sensors. Table 2-5 lists the reported sensing devices have been developed using imprinting method and photonic crystal.
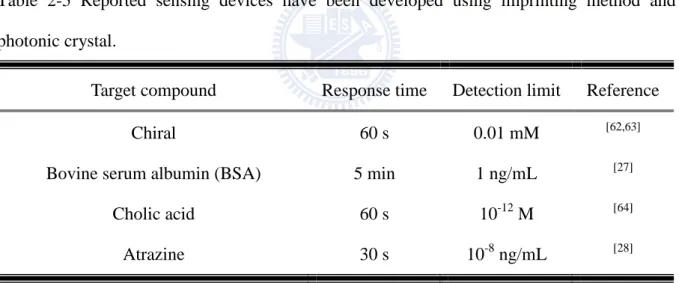
Table 2-5 Reported sensing devices have been developed using imprinting method and photonic crystal.
Target compound Response time Detection limit Reference
Chiral 60 s 0.01 mM [62,63]
Bovine serum albumin (BSA) 5 min 1 ng/mL [27]
Cholic acid 60 s 10-12 M [64]
Atrazine 30 s 10-8 ng/mL [28]
Hu et al.[27] constructed a silica colloidal crystal with molecularly imprinted structures on each constituent microsphere for protein detection. The advanced sensor reached the detection limit of 1 ng/mL. Wu et al.[28] built up a three-dimensionally ordered macroporous structures which contained imprinted polymers on the pore walls for efficient detection of atrazine in aqueous solutions. Wu et al.[64] designed a self-reporting sensor for cholic acid.
24
It was based on the molecularly imprinted photonic hydrogel that can be achieved direct, sensitive and label-free detection of cholic acid. The hierarchical structure provides high quantity of binding cavities for analytes to greatly improve the sensitivity. However, those current imprinted phonic crystal polymer-based sensors were primarily constructed by organic polymeric materials. They could be deformed or decomposed after periodical usage because of chemical corrosion. In addition, the binding sites for analytes only limited on the surface of the opal or inverse opal crystals.
25
Chapter 3 Materials and Methods
Figure 3-1 shows the flow chart of the experimental design for the fabrication of IPC. In this study, IPC was fabricated using a templating sol-gel method. Monodisperse PS latex was prepared by oil-in-water emulsion polymerization. PS opal structure was then fabricated by heat-assisted sedimentation. A molecularly imprinted sol solution was then infiltrated into the interstitial spaces between PS microspheres. The well-organized inverse opal structure was obtained after solvent extraction. The preparation conditions of imprinted sol solution including cross-linker, solvent and functional monomer were optimized to obtain the optimal detection ability. The linear range, detection limit, selectivity and sensitivity of IPC were examined in terms of shifts in the wavelengths of diffractive UV light.
3-1 Chemicals
All solvents and chemicals used in this study were of reagent grade and were used without further purification unless special explanation. Styrene (C8H8, Sigma-Aldrich, GC grade, 99%) was used as the monomer of PS latex. Potassium persulfate (KPS, K2S2O8, Sigma-Aldrich, 99%) and sodium dodecyl sulfate (SDS, C12H25SO4Na, Merck, 99%) were used as the initiator and the capping agent, respectively for the synthesis of monodisperse PS microspheres. Zirconium (IV) propoxide (ZPO, Zr(OCH2CH2CH3)4, Sigma-Aldrich, 70 wt % solution in 1-propanol), bisphenol A (BPA, C15H16O2, Sigma-Aldrich, 99%), phenyltrimethoxysilane (PTMOS, C9H14O3Si, Sigma-Aldrich, 97%) and absolute ethanol (EtOH, C2H6O, Sigma-Aldrich, HPLC grade, 99.8%) were used as the cross-linker, template, functional monomer and solvent for the sol-gel derived MIP, respectively. Toluene (C6H5CH3, J.T. Baker, HPLC grade, 99.9%) and methyl alcohol (CH3OH, Mallinckrodt, HPLC grade, 99.9%) were employed as extraction solvents to remove the PS and BPA from
26
IPC. Phenol (C6H6O, Riedel-de Haën), 1-naphthaol (C10H8O, Riedel-de Haën, 99%) and 4-tert-butylphenol (BP, (CH3)3CC6H4OH, Sigma-Aldrich, 99%) were used as the analogues of BPA. Deionized water (DI, Millipore, 18 MΩ cm) obtained from Milli-Q water purification system was used throughout the experiments. Table 3-1 lists the structures of the major reagents used in the photonic crystal and the imprinted polymers.
27
Systhesis of polystyrene microspheres Opal structure Inverse opal structure Characterization
Optimization
SEM DLS TEM
Characterization Preparation
Imprinted polymer infiltration
Polystyrene opal structure Templates removal
Photonic crystal
Detection
UV-visible
Fabrication of BPA imprinted photonic crystals
Molecularly imprinted polymers
Fabrication of IPC
Sensitivity Selectivity Equilibrium Application
SEM BET FTIR Adsoronption
Cross-linker Solvent Functional monomer
28
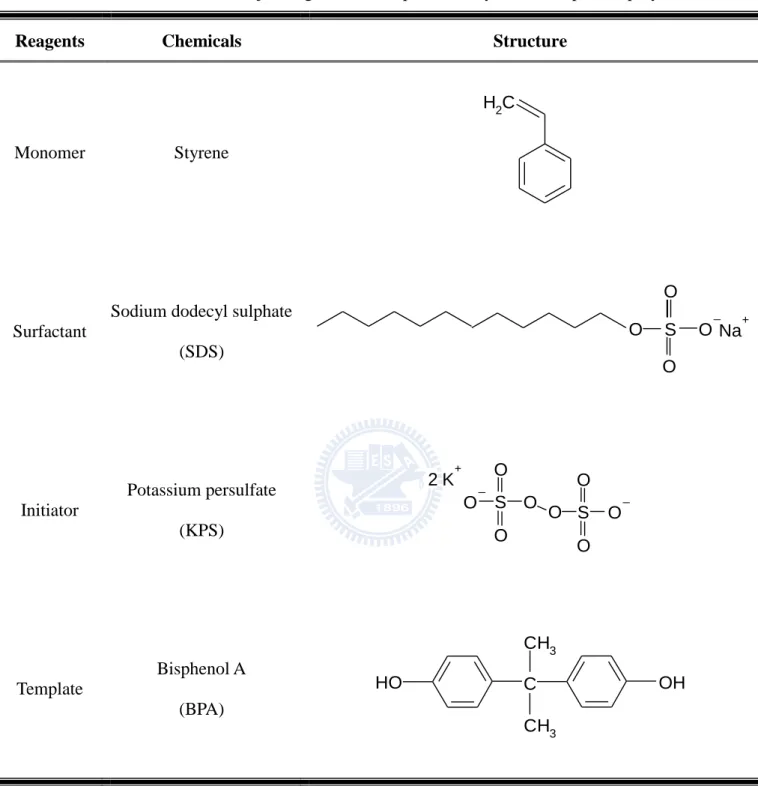
Table 3-1 Structures of the major reagents used in photonic crystal and imprinted polymers.
Reagents Chemicals Structure
Monomer Styrene
H2C
Surfactant
Sodium dodecyl sulphate (SDS) O O O S Na+ O Initiator Potassium persulfate (KPS) S O O O O O O S O O K+ 2 Template Bisphenol A (BPA) C CH3 CH3 OH HO
29 Cross-linker Zirconium propoxide (ZPO) Zr O O O O H3C CH3 CH3 H3C Monomer Phenyltrimethoxysilane (PTOMS) Si OCH3 OCH3 OCH3
30
3-2 Photonic crystal
3-2-1 Synthesis of monodisperse PS microspheres
Monodisperse PS microspheres were synthesized using an oil-in-water emulsion polymerization technique. The reaction took place in a 50 mL round-bottomed flask equipped with a water-cooled reflux condenser. Figure 3-2 shows the experimental apparatus for the polymerization. Styrene was used as the monomer, while KPS and SDS were used as the initiator and the capping agent, respectively. Initially, 49 mL DI was added to a flask and then purged with nitrogen for 30 min with vigorously stirring at 350 rpm to establish an anoxic condition. Then, 10 mL anoxic water was taken out to prepare a surfactant stock solution through dissolving 0.923 g SDS at 40 critical micellar concentrations (CMCs). 1 mL of SDS stock solution was added into the remaining 39 mL anoxic water to reach 1 CMC. Following, 6.5 mL styrene was added into the SDS solution which had been pre-heated 80oC for 30 min. Polymerization was initiated when 21.6 mg KPS was added into the mixture and the reaction was maintained at 80oC and at 350 rpm for 10 hr. The temperature (± 2oC) was controlled using a thermostatic silicon oil bath. The resulting latex was dialyzed using a dialysis membrane (Spectrum Laboratories, Inc., Molecular porous MWCO: 6-8000) for one week to separate PS from other reactants. The PS microspheres remained suspension in their mother liquor until needed. Figure 3-3 displays the mechanism of polymerization of PS.
31
Figure 3-2 Experimental apparatus for the polymerization.
32
3-2-2 Fabrication of the opal structure
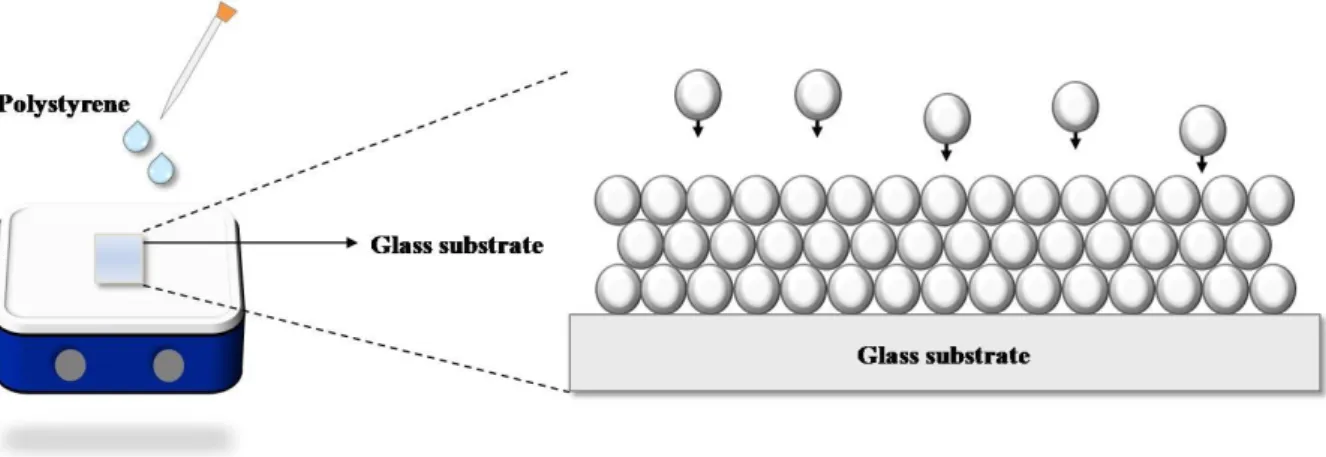
Three-dimensional colloidal crystals were prepared using a heat-assisted sedimentation on 25 × 25 mm2 glass slides. Figure 3-4 illustrates the formation of PS colloidal crystals. All the glass substrates were cleaned through ultrasonication for 30 min in acetone, ethanol and DI sequentially. The PS latex solution (10 L) was dropped onto the glass slide. Afterwards, the slide was placed on a hot plate at temperature 40-70oC to evaporate water from the PS droplet. The PS nanoparticles were driven into a long-range ordered, opaline lattice by the attractive capillary forces generated during water evaporation.
Figure 3-4 Formation of PS array through a heat-assisted sedimentation on a glass substrate.
3-2-3 Fabrication of the inverse opal structure
ZrO2 sol solution was added on the top of the colloidal crystals, the sol solution seeped into the interstitial voids between the PS nanoparticles through capillary and gravitational forces. The ZrO2-PS composites were dried at room temperature for 30 min for solidification. Finally, inverse opal ZrO2 structures were obtained via dissolving the PS with toluene. In order to optimize the volume ratio of PS and imprinted sol solution, the volumes of ZrO2 solution (ZPO/EtOH) were changed from 2.5 to 10 L and the molar ratio of ZrO2
33
was controlled at 0.4. Figure 3-5 shows the infiltration of the ZrO2 sol solution between the PS crystals.
34
3-3 Preparation of molecularly imprinted polymer
Molecularly imprinted sol solutions were prepared using a sol-gel method. Figure 3-6 shows the preparation procedure of the molecularly imprinted sol solution. ZPO was used as the precursors of ZrO2 and the cross-linker in the imprinting process. PTMOS and BPA were used as the functional monomer and the template, respectively. Firstly, 0.23 g BPA (1mM) was dissolved in 4.7 mL EtOH with stirring for 10 min at 400 rpm. Then, 0.19 mL PTMOS (1mM) and 13.5 mL ZPO (30mM) were sequentially added into the above solution under stirring at 400 rpm at room temperature for 20 min. The sol solution turned gradually from transparent to light yellow during the addition of ZPO. Non-imprinted sol solutions were prepared following the same procedure except for the absence of BPA.
Figure 3-6 Preparation procedure of the molecularly imprinted sol solution.
The BPA imprinted and non-imprinted ZrO2 gel was obtained after the evaporation of the solvents at 120oC for 24 hr. The final product was crushed and ground into fine powders. The imprinted BPA molecules were extracted from the ZrO2 matrix by means of immersing the imprinted powders into methanol with stirring for 2 hr. The imprinted ZrO2 powders were then harvested via centrifugation at 15000 rpm for 5 min. The extraction was repeated
35
for several times till the BPA adsorption peak ( = 276 nm) in the supernatant became undetectable. Figure 3-7 shows the mechanism of the formation of BPA imprinted ZrO2.
36
3-4 Fabrication of imprinted photonic crystal (IPC)
Molecularly imprinted sol solution was added on the top of the colloidal crystals, and let it seeping into the interstitial voids between PS nanoparticles through capillary forces. The composites were dried at 40oC for 30 min for solidification. Then, the PS templates were removed by solvent extraction with 20 mL toluene in a 100 mL vial for 2 hr. Finally, the composites were statically immersed in 20 mL methanol for 1 hr to remove the BPA templates to get IPC. For control experiments, non-imprinted photonic crystal (NIPC) was also prepared using the same procedure but without the addition of templates. Figure 3-8 shows the time scale of the preparation process of IPC.
37
38
3-5 Characterization
3-5-1 Scanning Electron Microscopy (SEM)
The morphology of the samples was characterized using a scanning electron microscopy (SEM, Hitachi S-4700, Tokyo, Japan). The observation was proceeded under AN electron accelerating voltage of 25 kV and a pressure below 3 × 10⁻⁶ Pa. Powder samples were prepared suspending in acetone via ultrasonic vibration for 20 min. Then the suspension was directly dropped on the glass and dried at 100oC. The samples were coated with a layer of Au by Ion coater (Eiko IB-2) for 3 min to enhance enough conductivity.
3-5-2 Transmission Electron Microscopy (TEM)
Three-dimensional microstructures of the inverse structures were identified using a high resolution transmission electron microscopy (HR-TEM, Philips, TECNAI 20) at an accelerating voltage of 200 kV. The samples were well dispersed in acetone by ultrasonic for 30 min. Afterwards, the suspension was dropped onto Cu grids (Ted Pella, Inc., 200 Mesh) followed by drying at 100oC.
3-5-3 UV-visible Spectrometry (UV-visible)
The UV-vis diffused reflectance spectra were recorded on an UV-visible spectrometry (Hitachi, U-3010, Japan). All of the samples were reference to aluminum oxide (Al2O3) which was considered to exhibit total reflections. The spectra were recorded from 400 to 200 nm at a scan rate of 120 nm/min with an interval of 0.2 nm.
39
3-5-4 Dynamic Light Scattering (DLS)
The average particle sizes of the PS microspheres were determined by dynamic light scattering (DLS, Zetasizer Nano ZS, Malbern, Britian). The instrument was equipped with a 4 MW He-Ne laser operating at wavelength of 633 nm and non-invasive backscatter optics (NIBS). The PS latex was diluted 10X with DI and ultra-sonicated for 30 min. The DLS measurement were carried out using polarized scattered light at a wavelength of 633 nm and 25 ± 0.5oC with scattering angles of 173o. The measurement position within the quartz cuvette was automatically determined by the software.
3-5-5 Fourier Transform Infrared Spectrometer (FTIR)
The surface functional groups of the imprinted particles and non-imprinted particles were characterized using a Fourier transform infrared spectrometer (FTIR, Thermo Scientific Nicolet iS10). All spectra were scanned between 400 and 4000 cm-1 with a resolution of 4 cm-1 for 100 runs.
3-5-6 Specific Surface Area (BET)
The specific surface areas and pore volume of the hybrid materials were analyzed by N2 adsorption technique and calculated using the Brunauer-Emmett-Teller (BET) mode. N2 physisorption and desorption was measured at 77K under variety of relative pressure (p/po) (Micromeritics, Tri Star 3000). 0.2 g of samples was degassed at 120oC for 12 hr before all analysis.
40
3-5-7 X-ray photoelectron Spectroscopy (XPS)
The surface chemical compositions of the MIP and IPC were determined by X-ray photoelectron spectroscopy (XPS, ESCA PHI 1600) using an Al Kα X-ray source (1486.6 eV). The photoelectrons were collected into the analyzer with pass energy (23.5 eV). The collection step size in wide range scan and high-resolution analysis were 1.0 and 0.1 eV, respectively. All analytical process was controlled under ultrahigh vacuum conditions at pressure less than 1.4 × 10⁻⁹ Torr. In order to quantify and qualify each element, curve fitting of the XPS spectra was performed. The parameters used for the curve fitting of the Zr 3d, C 1s and Si 2p, including the binding energies, doublet separation, full-width at half maximum and curve area. The integrated peak areas were normalized with atomic sensitive factors to calculate atomic ratios. The equation for atomic ratio calculation is shown below (Eq. 3-1):
Eq. 3-1
n: the atomic numbers
I: the intensity of species on XPS spectra A: the integrated peak area
41
3-5-8 Adsorption
The rebinding capacities of the imprinted ZrO2 particles were examined via mixing the 25.0 mg samples with 5 mL BPA solutions at 50 mg/L. After stirring for 3 hrs to reach adsorption equilibrium, the powders were separated from the solutions via centrifugation at 15000 rpm for 5 min. The remaining BPA in the supernatants was determined from the intensity of its adsorption at 276 nm using UV-visible spectrometer. The adsorption capacity (Sb, mg/g) were calculated by the following equation (Eq. 3-2):
Eq. 3-2
C0: the template concentrations in the solutions measured initially time (mg/L) Ct: the template concentrations in the solutions measured interval time, t (mg/L) V: the volume of the bulk solution (L)
W: was the weight of the particles (g)
Imprinted factor (α) is defined as the amounts of rebinding capacity of the imprinted sample to that non-imprinted sample and is expressed as the following equation (Eq. 3-3):
Eq. 3-3
42
Sb (NIP): the binding amount to the non-imprinted particles (mg/g)
3-5-9 Selectivity
The recognition capability of the imprinted particles for BPA was examined in terms of adsorptions of analogues including phenol, 1-naphthol and BP. The physicochemical properties of BPA and its analogues were summarized in table 3-2. The adsorption test was carried out by mixing the imprinted particles (25.0 mg) with 50 mg/L of 1-naphthol, BP and phenol solutions (5 mL) separately under stirring for 3 hr. Then, the suspensions were centrifuged at 15000 rpm for 5 min to remove the particles. The adsorbed amounts of the 1-naphthol, BP and phenol were determined by the decrease in the intensities of their absorption peaks at 323, 274, and 270 nm, respectively. The selectivity factors were obtained using the following equation (Eq. 3-4):
Eq. 3-4
Sb (BPA): the BPA binding amount to the imprinted particles (mg/g) Sb (analogous): the binding amount to the analogous molecules (mg/g)
43
Table 3-2 Physicochemical properties of compounds used for selective adsorption test.
Compound Structure Aqueous solubility Log Kow
Bisphenol A (BPA) C CH3 CH3 OH HO 120 mg/L 3.32 Phenol OH 8.3x10⁵ mg/L 1.46 1-naphthol OH 870 mg/L 2.85 4-tert-butylphenol (BP) OH C CH3 CH3 H3C 1.1 mg/L 3.29
44
3-6 Sensing capability of imprinted photonic crystal (IPC)
The sensing capabilities of IPC, including detection limit, equilibrium time and selectivity for BPA were examined. The IPC was immersed in 20 mL BPA solution (50 mg/L) for 5 min to reach adsorption equilibrium. After drying with nitrogen gas, the reflection peak of the IPC was measured using the UV-visible spectrometer. According to the Bragg’s law,[51] 2 2 1/2
111( sin )
2
d n ef , the adsorption of BPA changes the meanrefractive index, n, of the IPC and consequently changing the diffractive wavelength. The shift in the diffraction peak position with BPA binding can be used to quantitatively estimate the amount of bound BPA. Figure 3-9 shows the detection procedure of BPA using the IPC.
45
The linear range and detection limit were obtained at the BPA concentrations of 0.01-100 mg/L. Wavelength shifts for 30 mg/L BPA in different intervals of adsorption time were monitored to understand the response kinetics. 1-naphthol, BP and phenol were used as the analogues of BPA to test the selectivity of the IPC toward the target compound under the concentration of 50 mg/L. For completive systems, the phenol, BP and BPA were dissolved in DI to reach 50 mg/L for each one.
46
Chapter 4 Results and Discussion
4-1 Molecularly imprinted polymer
4-1-1 Adsorption
The adsorption capacity of the MIP for BPA (50 mg/L) at the different time intervals is shown in Figure 4-1. It can be seen that the rebinding of MIP toward BPA reached the saturation after 3 hr. The long equilibrium period is due to the slow diffusion of BPA molecules from surface into the cavities of the rigid structural framework of MIP. Wang et al.[65] constructed BPA-imprinted polyethersulfone (PES) particles with a diameter of about 2.3 mm. The saturated binding for the imprinted particles was observed after about 60 hr. The particle size controls the adsorption and reactive kinetics.[66] Thus, reducing diffusion length is the key point when a MIP is used for sensing applications.
0 1 2 3 4 5 0 1 2 3 4 5 6 A dsorption am ounts ( mg/g) Time (hr)
47
Figure 4-2 shows the adsorption isotherm of the MIP toward BPA. The MIP had two adsorption ranges: one was in 1-18 mg/L, and the other one was in 20-100 mg/L. This phenomenon indicates that the adsorption strength of the MIP was dependent on the concentrations of BPA. The diffusion of BPA molecules in the imprinted polymer is in response to a concentration gradient. Concentration gradients are often regarded as the driving force for diffusion and the sorption of species onto the imprinted polymer.[67] The binding strength is larger when the MIP worked at high BPA concentrations (> 20 mg/L) because of higher driving force resulting from large concentration gradient in the MIP. The adequate driving force not only assists the sorption of BPA molecules onto the surface of MIP but also promotes the pore diffusion from surface to the buck of the imprinted polymer. In contrast, when the MIP worked at low BPA concentrations (< 18 mg/L), BPA molecules were difficult to diffuse into the rigid framework due to the insufficient driving force. Thus, BPA was only adsorbed on the surface instead of bulk cavities inside the imprinted polymer. That is why a saturated rebinding and Langmuir adsorption was observed under the BPA concentrations lower than 18 mg/L.
48 0 20 40 60 80 100 0 1 2 3 4 5 6 7 8 C apacity (mg/g) Concentration (mg/L) 0 2 4 6 8 10 12 14 16 18 20 0.4 0.6 0.8 1.0 1.2 R2 = 0.9979 Capacity (mg/g ) Concentration (mg/L) 20 40 60 80 100 3 4 5 6 7 8 y2 = 0.0498x + 2.33 R2 = 0.9988 Cap acity (mg /g) Concentration (mg/L)
Figure 4-2 Adsorption isotherm of the MIP toward BPA.
In order to evaluate the specific affinity of MIP toward to the BPA, adsorptions in analogues solutions were carried out. Phenol, 1-naphthol and BP were chosen as the analogues for the selective recognition capacity due to their log Kow and chemical structure similar to those of BPA. Figure 4-3 shows the adsorption capacity and the selectivity factor of the MIP for 50 mg/L of BPA and its analogues. The adsorption capacities of the MIP and NIP toward to BPA were 4.62 and 0.22 mg/g, respectively. Correspondingly, the imprinted
![Figure 2-4 Representation of the covalent and non-covalent imprinting processes. [45]](https://thumb-ap.123doks.com/thumbv2/9libinfo/8232689.171014/29.892.109.793.394.660/figure-representation-covalent-non-covalent-imprinting-processes.webp)
![Table 2-4 Comparison of covalent and non-covalent imprinting. [41]](https://thumb-ap.123doks.com/thumbv2/9libinfo/8232689.171014/30.892.97.799.234.824/table-comparison-covalent-non-covalent-imprinting.webp)
![Figure 2-6 Scheme of the optical path of incident light in photonic crystal. [50]](https://thumb-ap.123doks.com/thumbv2/9libinfo/8232689.171014/33.892.138.753.123.325/figure-scheme-optical-path-incident-light-photonic-crystal.webp)