Review Article
Single Molecule Spectroscopy
Tatiana Yu. Latychevskaiaa, Kuo Kan Liangb* ( ), Michitoshi Hayashib, Chung-Hung Changb( ), Alois Renna, Urs. P. Wilda,
Jui-Hung Hsub( ), Ta-Chau Changb( ) and Sheng Hsien Linb( ) a
Physical Chemistry Laboratory, Swiss Federal Institute of Technology, ETH Zentrum, CH-8092 Z ich, Switzerland
b
Institute of Atomic and Molecular Sciences, Academia Sinica, P. O. Box 23-166, Taipei 106, Taiwan, R.O.C.
Single molecular experiments carried out in the group of Prof. Wild in ETH Zurich, as well as the experi-mental and theoretical studies of several research groups in Taiwan, have been summarized in this review. It is shown that with the contemporary technologies, single molecular experiments can be carried out under a broad range of physical conditions. These includes low and room temperatures; in vacuum, in solution, in the air, or with specific pressure applied on the sample; in applied direct-current or alternating-current electric fields; on molecules in solid matrices, in gel, or even functioning biomolecules in vitro. Theoretical efforts have been able to help identifying the interactions of single molecules with their surroundings that modulate their static or time-resolved spectroscopic properties. The joint experimental and theoretical effort to develop the research techniques in single molecular experiments is shown to be fruitful, and future works in this direc-tion are important for many fields in chemistry, physics, and biology.
Keywords: Single molecule experiment; Spectral jump; Stark effect; ATP synthase.
1. INTRODUCTION
The efforts of chemical and physical scientists to ex-plore the behavior of individual molecules have been mani-fold. Molecular beam techniques were developed to investi-gate effectively isolated molecules or isolated product-molecule pairs in gas phase with well defined conditions of the molecules under study. The data collected in such experi-ments are nevertheless ensemble data in nature. Optical or magnetic trapping techniques (commonly referred to as opti-cal or magnetic tweezers) as well as STM or AFM manipula-tions of atoms and molecules allow us to observe fixed single atoms or molecules in space, in more varieties of environ-ments like on surfaces or in solids or solutions. In these ex-periments, mechanical forces are involved either to access a single molecule or to detect the mechanical or elasticity prop-erties of single molecule (SM) systems. Meanwhile, many in-spiring ideas showed that actually single molecules can be observed in conditions similar to that of conventional ensem-ble experiments in a less difficult way than imagined.
Con-ventional spectroscopic and microscopic techniques can be employed, with some modifications and improvements, to achieve the goal. The most important idea in this type of ex-periments is that, to observe a single molecule, we need to make sure that in the volume in which the probing system acts on there be only one molecule we want to study. In principle, it can be achieved by reducing the sample molecule concen-tration and then using spectroscopic methods, that is, the molecule under study can be picked up by monitoring a spe-cific light-matter interaction process which occurs on the sample molecule, but not on the other surrounding molecules. In such so-called single molecule spectroscopy (SMS) stud-ies, generally the difficulty in achieving single-molecular ob-servations is not the observation of single molecules them-selves, but is the rejection of unwanted information from the environment. In an earlier review,1the practical consider-ations of the experimental conditions are discussed in detail. The possibility of assigning each molecule with a dif-ferent spectroscopic property by manipulating its environ-ment also has potential applications. For example, if the mod-This review paper is based on the plenary lecture given by Prof. U. P. Wild at the Second Worldwide Chinese Theoretical and Computational Chemistry Conference in Taipei. The choice of scientific subjects for the article has been made by T. Latychevskaia and K. K. Liang. The discussed topics reflect the interests of several research groups in Taiwan and the Swiss group of Prof. U. P. Wild.
ifications on the properties of individual molecule can be ‘re-membered’ by these molecules and be ‘read out’ later, then we may use these molecules for information storage, or they can even be used as devices for “molecular computation”. That is, ability to actively manipulate the single molecules extends the range of application of these techniques to more practical usages.
From the theoretical point of view, we can briefly out-line the important information that SMS studies can provide in the following:
1. The spectral properties of an SM or a certain number of SMs before ensemble average is made, in which the inhomogeneities are suppressed and can be recovered by av-eraging over many SMs;
2. Influence on SMs by controlled external parameters such as temperature, pressure, electric field, or even the pres-ence of reactive species such as oxidant or deoxidant in the environment;
3. Rrandom dynamics of the spectral properties of SMs induced by fluctuations of the surroundings that can only be measured accurately in SMS experimental conditions;
4. Time trajectory of the observation of some properties which can be used to deduce the kinetics of an SM from the time domain information directly.
In the following sections, we shall focus our attention on several typical SMS experiments that have been con-ducted or even first developed in the authors’ group, based on the plenary lecture by Prof. U. P. Wild at the Second Worldwide Chinese Theoretical and Computational Chem-istry Conference in Academia Sinica, Taipei. The efforts of
many other colleagues in the same field are so numerous that they cannot all be included in this review. We shall cite relevant literatures to help readers to get more detailed in-formation or as support for the ideas. Those works not men-tioned in this review were left out only due to the limited scope of this article. On the other hand, even though the de-tails of the experimental setup are a very important and in-teresting part of the SM studies, they cannot fit into one re-view article. In this paper, we often point the readers to the theses written by members from this group for more details. Most of the theses cited can be obtained from the Disserta-tions Online service provided by ETH Zurich. The URL is http://e-collection.ethbib.ethz.ch/diss/.
2. LOW TEMPERATURE STUDIES OF SINGLE MOLECULES IN SOLIDS
The spectrum of an organic compound in a solid is a broad (hundreds or thousands wavenumbers) Gaussian line, made up of a broad distribution of single-absorber lines.2,3 The absorption resonance frequency of individual molecules are defined by the local environment of the molecules (See Fig. 1). Figure 2 shows a simulated inhomogeneous lineshape produced by the superposition of a large number of individual homogeneous absorption profiles. When the concentration of the guest molecules in a solid is high, the sample spectrum is structureless. At a lower concentration the spectrum becomes more “noisy” and this noise is nothing other than the summed-up spectra of single absorbers at each frequency position. In
478 J. Chin. Chem. Soc., Vol. 50, No. 3B, 2003 Latychevskaia et al.
Fig. 1. Every molecule has a slightly different environment and the resonance absorption frequencies differ from molecule to molecule. The light grey circle indicates the excitation spot. The spectra in the right panel are real data.6
contrast to spectral noise, these spectral features are repro-ducible and are called statistical fine structure (SFS). When the concentration is dropped down to a ratio of one guest mol-ecule per 1012host molecules, the spectra of single absorbers can be resolved. See the lowest part of Fig. 2.
2.1 Fundamentals of SMS
Energy levels of a single molecule in solids (Jablonskii diagram)
The energy level scheme for an organic single molecule in a solid (a so-called Jablonskii-diagram) is shown in Fig. 3. The lowest electronic energy levels are two singlets S0and S1 (left side of the picture), and a triplet T1(right side of the
pic-ture). S0, S1and T1are electronic states, each of which in-cludes correspondingly sets of vibrational statesu, u¢ and u² (see Fig. 3). The transition of the molecule from the ground state S0to the lowest excited state S1can be induced by laser light. This can be a purely electronic transition, which does not involve any molecular vibration (seen00in Fig. 3). It also can be a vibronic transitionn which additionally involves the excitation of molecular vibrations. In solid state matrices all molecular vibrations relax into the vibrational ground state of the respective electronic state through the creation of phon-ons on a picosecond timescale. This is called vibrational re-laxation (VR). The non-radiative transition from S1to S0is called internal conversion (IC), because the transition occurs
between states with the same spin. Vibronic transitions (S0,u = 0® S1,u¢ = n) are studied in the work of Nonn et al.4After a molecule has been excited to S1manifold, there are several pathways to relax to S0,u = 0. First of all, the radiative transi-tions to one of the vibrational sublevels of S0- the fluores-cence, normally detected in single molecule spectroscopy. In single-molecule experiments only the Stokes-shifted fluores-cence is detected. The total radiative decay rate 2g for terryl-ene molecules is typically 230´ 106rad/s. A competing pro-cess to radiative transition is the nonradiative transition to the triplet state T1via ISC with probability of about 10-3(this will vary from system to system). The transition between states with different spins, for instance S1® T1, is referred to as inter-system crossing (ISC). Radiative relaxation from T1to S0leads to the emission of the so-called phosphorescence. Transitions between the singlet and triplet manifold are spin-forbidden. They require spin-orbit coupling which is weak in hydrocarbons. Therefore the triplet state has a very
long lifetime. The lifetime of the first excited singlet state S1 is in the order of nanoseconds, while for triplet states the life-time ranges from micro- to milliseconds. Intensively fluores-cent molecule spend almost no time in the triplet state. Good candidates for single molecule spectroscopy therefore must fulfill the requirement that kST/2g and kST/kTSare small. For instance, for terrylene molecule is typically kST/2g = 10-5and kST/kTS= 0.27.
Zero-phonon lines (ZPL)
The transition probability of a guest molecule in a host matrix depends on the coordinates of the surrounding atoms and is a function of the density and of the frequency of the vi-brational states of the solid. Crystal lattice vibrations (phon-ons) are part of the ground state wave function. The phonon state population depends strongly on the temperature of the crystal, which in turn makes the absorption spectrum of the sample strongly dependent on the temperature. At room tem-peratures, the thermal motion has energy of about kT ~ 300
480 J. Chin. Chem. Soc., Vol. 50, No. 3B, 2003 Latychevskaia et al.
Fig. 3. Scheme representing the lowest energy levels of an organic single molecule embedded into a solid (Jablonskii dia-gram). Sets ofu-levels represent vibrational levels, and lighter drawn multiple lines are energy levels of the host’s phonons. The radiative transitions are shown with solid lines, inter-system crossing (ISC) transitions with broken lines and internal conversion (IC) with waved lines.n - frequency of the absorbed laser light, n00- frequency of the purely electronic transition with no phonons created (zero-phonon line), kSTand kTSare the rates of the singlet-triplet and triplet-singlet transitions.
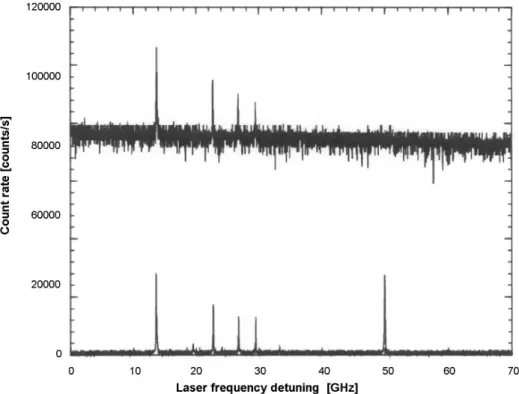
cm-1which is enough to excite a wealth of phonons, and the spectrum of the whole sample is tens to hundreds of cm-1 broad. With a decrease in temperature, the number of phon-ons is decreased. Thus, there appears a probability for elec-tronic transitions without phonons involved, such are called zero phonon transitions, and the corresponding lines in spec-tra are called zero phonon lines (ZPL) (see Fig. 3). The lower the temperature, the narrower and more intense are the ZPL. The width of the ZPL is given by the inverse value of the ex-cited state’s lifetime. The study of ZPLs of single terrylene molecules in polyethylene at T0= 30 mK which is the lowest temperature so far was reported in the work of Donley et al.5 The important property of ZPL’s is that they provide charac-teristics of individual impurity molecules, which are defined by a molecule’s environment (see Fig. 1). While the peak count rate of the lines reaches almost 10000 counts/s the background signal remains below 10 counts/s. This means that single molecules can be detected with a signal-to-background ratio of almost 1000.6
Lorentzian lineshape
The analytical expression describing the absorption lineshape of a single molecule can be obtained by solving time-dependent Schrödinger equations, leading to a system of Bloch equations.7For a two-level system shown in Fig. 3, the Bloch equations are:
& ( ) r11 2gr22 r21 r12 2 = +iWR - (1) (2) (3) whereg is the radiative decay constant, WRis the Rabi fre-quencyWR=
r
d12·ErL/h,dr12is the transition moment of the mol-ecule,ErLis the laser field,w is the laser frequency, and w0is the resonance transition frequency of the molecule.
The steady state solution of the Bloch equation (&r11=&r22 = 0) gives us the rate of the spontaneous emission:
(4) According to Eq. 4, the spontaneous emission rate R has a Lorentzian lineshape with full width at the half maxima (FWHM) equal to half of the radiative decay rate (reciprocal to the lifetime of the excited state). Fig. 8 shows a typical sin-gle molecule spectrum recorded experimentally, with a width of about 8.9 MHz. The lifetimes of the excited state of indi-vidual molecules are different due to the local environment of the molecules. Fig. 7 shows the histograms of the linewidths
of 54 perylene molecules in n-nonane. The lifetime limit esti-mated from the histogram is around 7.4 ns (136 MHz), while the maximum of the distribution is at about 20 ns (50 MHz). In most of the experiments, the average FWHM is less than several hundred MHz.
A more detailed theoretical and experimental analysis of the lineshape, leading to a slight deviation from Lorentzian line, is given in the work of Nonn.6
Absorption cross-section (ACS)
ACS represents the effective area that a molecule has to capture a photon. The radiative peak absorption cross-section (PACS) of a free atom is:8
(5) wherel is the vacuum transition wavelength at the absorp-tion maximum. The peak absorpabsorp-tion cross-secabsorp-tion of a ZPL is reduced by the Debye-Waller factor aDW(T) and by non-radiative and dephasing processes, as compared to the free atom case:
(6) where the factorb(q) takes the linear polarization of the exci-tation light into account, withb(q) = 3cos2q, q being the angle between the electric vector of the excitation light and the di-rection of the transition moment of the molecule, n is refrac-tive index of the matrix.9-11A rough estimate for terrylene in n-hexadecane (aDW= 0.5,b = 0.5, n =1, l =572) gives a PACS s(T) » 2.2 ´ 10-10
cm2, which is five orders of magnitude larger than geometrical ACS of terrylene 9´ 10-15cm2.
Basic SMS setup
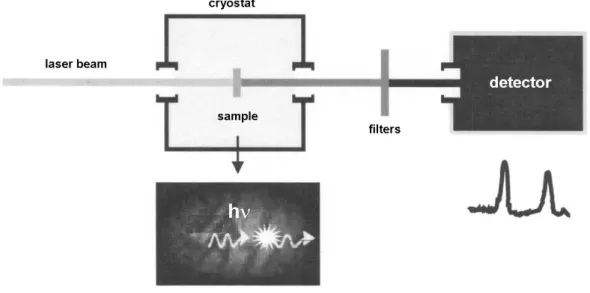
A general experimental scheme for single molecule de-tection at low temperatures is shown in Fig. 4. The sample is a transparent solid (also called host) doped with dye molecules (called guests or impurities). The sample is inserted into a cryostat and cooled with liquid helium down to» 2 K. The SMS experiments are performed at low temperatures (~ K), because at low temperatures the spectral lines are narrow and can be resolved with a tunable narrow-band laser beam (Dn » 1 MHz). For a terrylene molecule in a naphthalene matrix, the linewidth increases from about 45 MHz at 30 mK to 80 MHz at 2.2 K.12At higher (or room) temperature, the individual molecules still can be detected if the concentration is low enough, but the spectral information will be lost. When the laser frequency is in resonance with the frequency of a guest molecule transition from the ground state S0to the first ex-cited state S1, the molecule absorbs S0® S1and emits a pho-ton S1® S0. Emitted photons are registered with a sensitive R 22 2 11 ( 21 12) 2 i r& = - gr - W r -r R 12 ( 0) 12 ( 22 11) 12 2 i i r& = - w w r- + W r -r -gr 2 R 22 2 2 2 0 R / 4 2 ( ) 4 / 2 R gr w w g W = = - + + W 2 r 2 l s p = rad r DW 2 hom ( ) ( ) ( ) ( ) T T T n g s s a b q g =
detector. To distinguish the guest molecule fluorescence from Rayleigh scattering from the matrix, filters in front of the detector are used.
Spatial and spectral selection of a single molecule
The concept of single molecule selection is shown in Fig. 5. The way down to the detection of only one molecule begins with spatial selection. For low-temperature single molecule spectroscopy the impurity concentration in the
sample volume should be about 10-7M. The reduction of the sample volume (to a few hundredsmm3) is done by taking the sample in the form of a thin, 1mm, layer (a film for polymer matrices and a drop between two glass plates for liquid sam-ples). Also, the laser beam is focused into a tiny spot (100mm in diameter) on the sample. Thus, in the detection volume there will be about 104dye molecules among 1012solvent molecules. The next step- spectral selection, is based on the
482 J. Chin. Chem. Soc., Vol. 50, No. 3B, 2003 Latychevskaia et al.
Fig. 4. General scheme of a low-temperature single molecule spectroscopy experiment.
Fig. 5. An illustration of spatial selectivity by focusing the laser beam into a tiny spot (about 100mm in diameter) and spec-tral selectivity by scanning with a laser over the wings of the inhomogeneously broadened line.
fact that the entire sample spectrum consists of single ab-sorber lines which are 103-104times narrower than the whole spectrum. By scanning over the wings of the inhomogene-ously broadened line (where the single absorbers can be re-solved) with the narrow-band laser, we can spectrally select one guest molecule out of 1012matrix molecules (this ratio corresponds to a single letter in the 20-volume Oxford Eng-lish Dictionary).
Figure 6 shows the fluorescence excitation spectra of a very low concentration sample of pentacene molecules in p-terphenyl at 1.8 K. The total frequency scan range shown is
10 cm-1. Each of the peaks represents a single molecule, al-lowing approximately 450 molecules to be distinguished.
2.2 SMS experimental setup
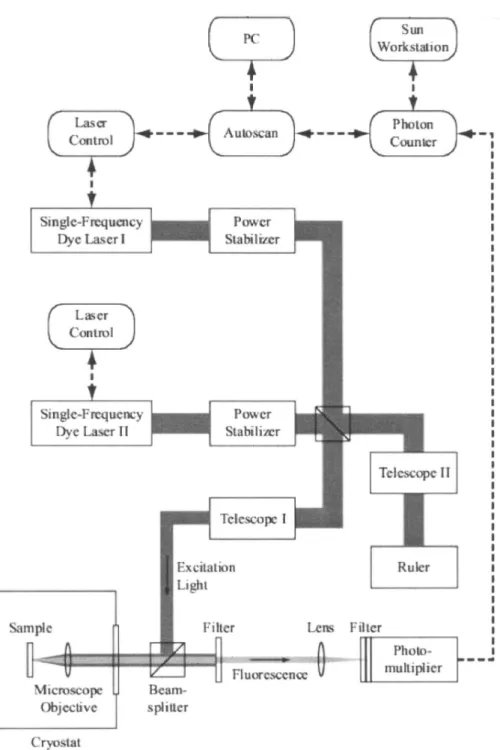
In this section we discuss important parts of a low tem-perature single molecule experiment: light sources, cryostat, sample holding, detection system and optical filtering. One of the experimental setups which embodies these priciples is shown in Fig. 9.13
Light sources
To probe individual absorbers spectral lines with a
typi-Fig. 6. Spectra of 450 single molecules. Measured by Frank Guettler and Marco Pirotta (using Autoscan laser). Sample was pentacene in p-terphenyl.81
cal width of a few MHz, a narrow-band detunable laser should be employed. For instance, to excite single terrylene molecules, whose excitation wavelength is about 572-578 nm, a single-mode dye laser (Coherent, model CR 599-21) with Rhodamine 6G (Radiant dyes) pumped by Argon Ion la-ser (Coherent, Innova 310) can be used. For experiments on perylene molecules, whose frequency of excitation is about 450 nm, a tunable blue laser light is required. This light can be generated by frequency doubling the IR output of argon ion laser pumped with a single-mode Ti:sapphire laser (Co-herent 899-29) using an external cavity (wavetrain, LAS
GmbH).14The laser provides an output power of about sev-eral tens of mW. Before the laser beam interacts with the sample, it should go through an interference filter to reject the direct light from the pump laser. An optical fiber can be em-ployed to improve the beam profile and a half-wave plate can be placed in the laser beam path to rotate the polarization for the minimal angle between the molecular transition dipole moment and the polarization. To balance intensity changes during a frequency scan, the laser intensity has to be stabi-lized by a power stabilizer, for instance by one which uses a Pockels cell (Cambridge research, model LS100).14The laser
484 J. Chin. Chem. Soc., Vol. 50, No. 3B, 2003 Latychevskaia et al.
Fig. 7. Distribution of linewidth of 54 molecules in different perylene/n-nonane samples at 1.7 K. The maximum value of the FWHM is at 136 MHz, the lower cut-off is 28 MHz.13
light should be focused to a tiny spot onto the sample, in order to fulfill the spatial selectivity requirement, described in the previous section. The focusing can be done by placing an achromat lens in front of the cryostat window, at a distance corresponding to the focal length of the lens.
Cryostat
Another important component of a low-temperature ex-periment is the cryostat. Gas-flow cryostat (Janis SVT 200) can be used for works with samples in liquid helium as well as in a gas-flow regime.15,16The core of the cryostat is the sam-ple chamber, which is surrounded by the liquid helium cham-ber and by the nitrogen chamcham-ber. Layers of vacuum isolate the liquids from other chambers and from the environment. Once having a good sample, one can keep it for weeks in a crystal state by re-filling the cryostat with liquid nitrogen. Oxford cryostats have a large enough helium reservoir to op-erate below thel-point for more than 24 hours.4A special type of home built Oxford cryostat provides very low temper-atures down to 30 mK and single molecule spectra detected with such a cryostat at 30 mK are described in the PhD thesis of Donley.17
Sample holding
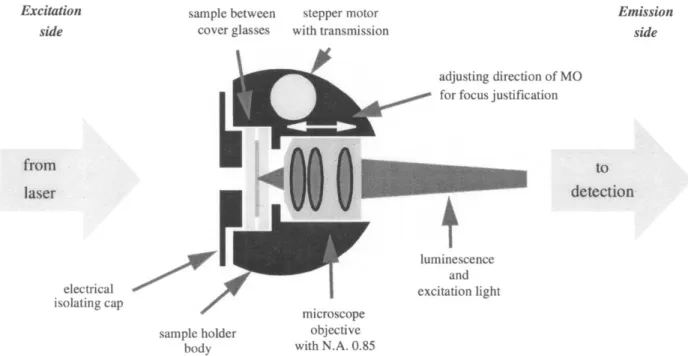
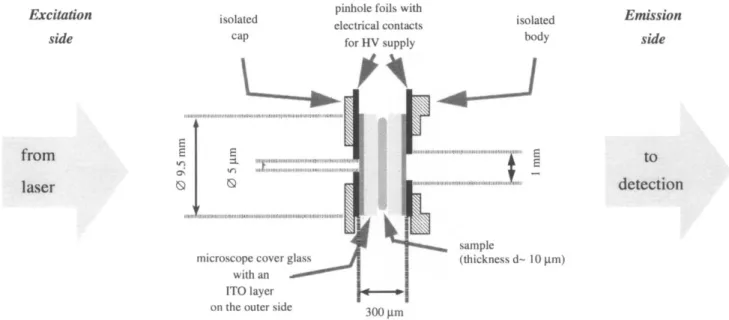
A typical way to hold a sample in a cryostat is to make a
so-called “sample sandwich’’ and fix it onto a sample holder (see Fig. 10). The sample can simply be placed between two thin pieces of glass or filled into a thin cuvette. Different modifications of this arrangement (in the cases of Stark and pressure effect experiments) will be discussed later in the corresponding sections.
Microscope objectives
In order to collect the SM fluorescence coming out of the sample at a very wide angle, a microscope objective (for instance, Newport M-60, NA = 0.85) should be placed right behind the sample (see Fig. 10). When immersed in super-fluid helium, the objective’s resolution deteriorates due to a change in focal length caused by the slightly different index of refraction of the space-filling superfluid helium between the lenses as compared to air. Refocusing at the liguid helium temperature is performed by moving the objective along the optical axis using a stepper motor (for instance, Princeton Re-search vacuum stepper motor, home-rebuilt for working in helium).16,18
Filters
There are some typical filters almost used in every SMS setup: interference filter (Oriel, 580FS10-50 forl = 574 nm) to clean the excitation laser light before it enters the sample,
Fig. 9. An example of a low-temperature single molecule setup. M denotes mirrors, L are lenses, D are diaphragms, B1 is a beamsplitter. For details see PhD thesis of Marco Pirotta.14
notch filter in front of the detector to separate the fluores-cence from the laser light, and sometimes a cut-off glass filter to reject excessive stray light. For instance, the scheme shown in Fig. 10 uses a holographic notch filter (HNPF, Kai-ser Optical System, center rejection wavelength 574 nm) and cut-off filters (KV, Schott RG610). In some experiments, the optics with flat surfaces (filters or microscope objective) can be tilted to avoid interference fringes that increase the back-ground signal.6
Detectors
The maximum total efficiency, Ctot, of detecting fluo-rescence photons is given by a combination of collection effi-ciencies and transmission factors:
(7) Cmax angledescribes the maximum angle of light, from which light can be collected with the MO, and completely deter-mined by the numerical aperture of the MO:
(8) for details of this formula see Ref. 14 and 19. For an MO with NA = 0.85, maximum angle is Cmax angle= 0.05. Transmission efficiency of the notch filter is about 55%, giving us Tfilters=
0.55. The overall transmission through the optical parts, for instance, for the scheme shown in Fig. 9, consisting of 12 op-tical elements, is: Toptics= 0.962´12= 0.38. The quantum effi-ciency of a PM varies between 10-20%. Thus, the maximal collection efficiency of the apparatus is:
Ctotal~ 0.2% (9)
To detect single molecule fluorescence, such detectors as a sensitive CCD camera (Hamamatsu C2400-25 with image in-tensifier), photomultiplier (PM) (dry-ice cooled PM tube RCA, C31034) or avalanche photodiode (APD) can be used.
Samples
How many photons are needed to see a single mole-cule? Ideally, a guest molecule excited by laser light to reso-nate, circulates between its ground and first excited states and emits one photon every ~ 10-9s. This means that there should be 109photons emitted every second, which is more than enough to detect the molecule which requires 106photons per second. The presence of a long living (up to a few ms) triplet state dramatically decreases the amount of emitted photons. Good guest candidates for single molecule spectroscopy should have a short living triplet state, which leads to the high emission rate of the molecule. Guest molecules should have a high absorption cross section. There also should not be no
486 J. Chin. Chem. Soc., Vol. 50, No. 3B, 2003 Latychevskaia et al.
Fig. 10. Schematic drawing of the arrangement of sample and microscope objective in the sample holder body. The cap is fixing the sample “sandwich”. The distance between the microscope objective and the sample is adjusted with a home-built stepper-motor while the sample-holder is immersed into the liquid helium at 1.7 K.14
tot max angle filters optics detector
C =C T T C LHe max angle glass NA 1 1 cos arcsin 4 n C n ì é æ öùü ï ï = í - ê çç ÷÷úý ê ú ï ë è øûï î þ
emission from the host molecules. A resent overview on a guest-host system studied by SMS can be found in.20
Sample preparation
So-called Shpol’skii systems, used in low-temperature SMS, are obtained by simply dissolving a tiny amount of dye in liquid n-alkane. The crystals are formed under a fast cool-ing procedure.15
Naphthalene16or p-terphenyl9crystals doped with dye molecules are prepared in a sublimation tube, see Fig. 11. A tiny speck of terrylene and a mixture of the naphthalene iso-topes become molten under magnetic stirring. The melt is filled into the glass tube, sealed with the cold finger and flushed with dry nitrogen gas for half an hour. Meanwhile, the polyethylene glycol bath is heated to 180°C. Then, the glass tube is immersed into the heat bath so that the cold fin-ger is about 1 cm above the level of the glycol surface and kept there for about 1 hour. During the sublimation, the tube is constantly flushed with dry nitrogen and the cold finger with water at 20°. Small crystal platelets (surface < 1 mm2) are quickly formed at the top of the finger, larger crystal (sur-face > 1 mm2) condense slowly at the upper part. After about one hour, the heating can be switched off and the crystals can be carefully collected from the cold finger and stored at -18 °C for several weeks.
The spin-coating technique is used to produce thin polymer films doped with dye molecules. The sample is a
co-solution of a polymer, for instance 10% polymethyl-metacrylate (PMMA) (10 mg/mL) and a dye (10-9M) in tolu-ene. A drop of the solution is put onto a spinning microscopic coverslip, which has been prelimiarily heated at about 300°C for several hours in order to remove potential fluorescence contamination.
Parallel spatial and spectral detection of many single molecules
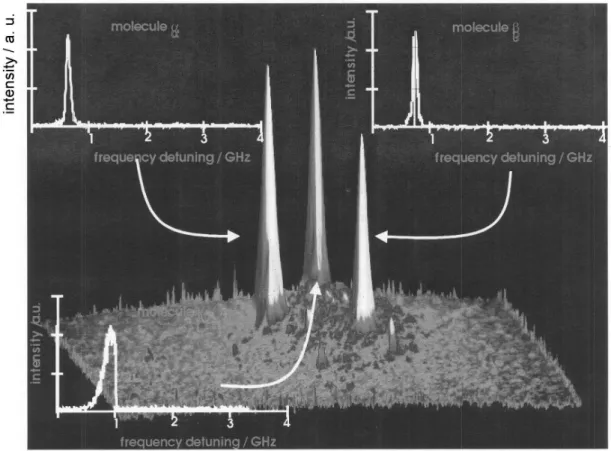
Most of the low temperature techniques use wide-field illumination, when many molecules can be excited at a time by a 100-200mm diameter laser spot. The spatial resolution of the system is then dominated by the optical resolution of the microscope. The advantages of such technique are two-folded. Firstly, the molecules in the illuminated area are ex-cited and detected at the same time, so that we can be more certain that all of the molecules are studied under identical macroscopic conditions. Secondly, except for analyzing the property of an individual SM, the measured property of indi-vidual molecules can be easily averaged to bridge the SM re-gime to the bulk sample rere-gime. A result of such an experi-ment is shown in Fig. 12. The picture shows a 3-D plot repre-senting spatial intensity distribution of the fluorescence sig-nal at a given excitation frequency. The three obvious peaks represent three SM. The three 2-D plots in the insets show the spectral dependencies of the three molecules, recorded while the laser frequency was scanned. Though, all three molecules have maxima of fluorescence almost at the same frequency (at the frequency where the spatial 3D plot was made), they have different spectral behaviour. Moleculeg even disap-peared half way during the frequency scan, causing a sharp drop in the spectral line shape, indicating perhaps a chemical reaction which quenched the molecule.
Further details about single molecule experimental set-ups can be found in the literature.6,9,14-16,21
2.3 Low temperature single molecules experimental technigues
2.3.1 Fluorescence excitation spectra
The first detection of single molecules absorption lines was performed in an absorption experiment22,23with fre-quency modulation (FM) spectroscopy to eliminate low-frequency laser noise. One year later, Michel Orrit24 pro-posed another technique for single molecule detection: fluo-rescence-excitation spectroscopy. Since then, most single molecule experiments at low-temperature have been per-formed using the fluorescence excitation technique. In this technique, the wavelength of the excitation light is scanned, and the total Stokes shifted fluorescence as a function of the excitation frequency is recorded (see Fig. 3). Typical setup Fig. 11. Apparatus for the fabrication of naphthalene
for fluorescence excitation study has already been discussed in the previous section (see Fig. 9). The next sections are ded-icated to the special techniques developed in Wild’s group to resolve vibronic, emission and absorption spectra of single molecules.
2.3.2 Vibronic excitation spectra
The purely electronic transition line corresponds to a transition of the chromophore from the ground to the elec-tronic excited state: S0,n = 0 ® S1,n¢ = 0, where molecular vibrations are not excited. However, it is also possible to study the transitions of the chromophore from the ground state to the electronic excited state S0,n = 0 ® S1,n¢ = n or the so-called vibronic lines, which involve the excitation of a lo-cal phonon at the same time.4,6Since the lifetime of the local phonon lies in the range of several picoseconds, the width of vibronic lines at liquid helium temperature is about 1 cm-1. Figure 13 shows two regions of the fluorescence excitation spectrum of terrylene in naphthalene. The left part is charac-terized by sharp purely electronic absorption lines of individ-ual terrylene molecules. The right part is dominated by two broad almost structureless bandsn1andn2corresponding two
vibronic transitions. To extract the individual vibronic spec-tra from the broad bands, a two-laser scheme was proposed6 (see Fig. 14). The principle of the technique is as follows: one laser is pumping at a single molecule resonance frequency and the other laser’s frequency is scanned over. The transi-tion of the molecule in resonance with the pumping laser is saturated, and this molecule will not show up in the spectra (see Fig. 15). This technique demonstrates how it is possible to remove the contribution of individual molecules to excita-tion spectra. Figure 16 shows two spectra of the first vibronic bandn1. One spectrum was recorded with laser I only, and the other spectrum was recorded with lasers I and II, with laser II in resonance with the purely electronic transition of a single molecule. The difference between the two spectra yields the single-molecule vibronic line as shown in Fig. 17.
2.3.3 Emission spectra
While most low temperature single molecule experi-ments employ fluorescence excitation technique, there is also the possibility to excite the molecule with a fixed frequency in the maximum of its absorption line and disperse the emit-ted fluorescence light by a monochromator. With this
so-488 J. Chin. Chem. Soc., Vol. 50, No. 3B, 2003 Latychevskaia et al.
called spectral imaging technique, the vibrationally resolved fluorescence spectrum of a single molecule can be recorded. A vibrationally resolved fluorescence spectrum provides more information about a single molecule, which has been shown in several investigations.25-30Emission spectra on sin-gle terrylene molecules in naphthalene matrix were recorded by Hermann Bach in his PhD work.16For spectral imaging, the sample fluorescence is imaged onto the entrance slit of a 0.27 m imaging spectrometer (JOBIN YVON-SPEX 270M) equipped with a 1200 g/mm holographic grating and detected with a liquid-nitrogen-cooled CCD chip (1024 ´ 256 pixels, 27mm pixel size, quantum efficiency 50%). In this configura-tion, the spectral resolution is about 3 cm-1at detection wave-length near 600 nm with a 50mm wide entrance slit and 75 nm spectral range can be covered by the chip. The dispersed emission spectra were calibrated in frequency using dye laser lines and the neon-emission lines from calibration lamps (PEN RAY). To record the emission spectrum of an ensemble of molecules, the entrance slit was 50 mm and the signal was integrated over the vertical dimension of the chip for one sec-ond. For spectral imaging of many single molecules in paral-lel, the entrance slit was opened to 2 mm and 1024´ 256 pixel images were recorded by accumulating the signal for 5 s. To locate the spatial position of the molecules, the spectrometer
was used in two different configurations. First, the fluores-cence light that passed the notch filter, which was dispersed by the grating into the first diffraction order, was recorded. Afterwards the total luminescence that was long-pass-filtered by the notch and the cut-off filters and reflected into the zeroth diffraction order was registered. In the first case, spectrally dispersed images- referred to as first-order im-ages- are obtained and the horizontal axis of the CCD chip comprises a frequency and a spatial dimension. In the latter case, the CCD chip serves simply as a two-dimensional de-tector for the total luminescence of the sample and images re-ferred to as zeroth order images are obtained. First and zeroth-order images are combined to yield the spectral image. The monitored sample area depends on the magnification of the objective and on the entrance slit and chip dimensions. For a slit width of 2 mm, a sample area of approximately 20 mm (horizontal) by 80 mm (vertical) was imaged onto the chip.
Figure 18(a) shows the emission spectrum of an ensem-ble of terrylene molecules in naphthalene d8recorded by inte-grating the dispersed fluorescence light that passed the notch filter and the 50mm wide entrance slit along the vertical di-mension of the CCD chip for 1 s.16The position of the vibra-tionless transition is given by the attenuated laser line that was subsequently recorded. All other peaks belong to transi-Fig. 13. Fluorescence excitation spectra of terrylene in naphthalene. To the left, narrow lines owing to the excitation of the
purely electronic transition of individual molecules are visible. To the right, vibronic bands of two low frequency vi-brations of terrylene appear.6
tions from the vibrational ground state of the electronic first excited state to higher vibrational levels of the electronic ground state. The ground-state vibrational frequencies can be obtained by determining the spectral distance between the emission peaks and the frequency position of the laser line. Without integrating over the vertical chip dimension, the spectral image depicted in Fig. 18(b) is obtained by signal
in-tegration for 5 s. The dark colored vertical stripes correspond to fluorescence emission from molecules out of focus at the entrance slit. When the entrance slit is opened to 2 mm, the spectral image Fig. 18(c) is obtained by combining the zeroth order and the first order image. In the spectrally dispersed en-trance slit image (first order image), fluorescence emission peak sequences of single molecules focused at different
spa-490 J. Chin. Chem. Soc., Vol. 50, No. 3B, 2003 Latychevskaia et al.
Fig. 14. Experimental setup for the observation of the vibronic transitions in single molecules. The frequency of laser I is scanned, laser II is used to remove the contribution of single molecules to the spectrum.6
Fig. 15. An illustration of removing a single molecule from spectra by using two-laser technique. The lower spectra is re-corded with one laser only (laser I in Fig. 14). Five peaks correspond to five single molecules. The upper spectra has been taken over the same molecules, when the second laser is tuned into the 5-th molecule’s resonance frequency. Obviously, the peak from the 5-th molecule disappeared.6
Fig. 16. Two spectra of then1vibronic band. The black spectrum is recorded with one laser, and the grey spectrum is re-corded with two lasers. One molecule is missing in the grey spectrum.6
tial locations in the entrance slit plane emerge on top of the background from molecules that are out of focus. The peak sequences are horizontally shifted relative to each other re-flecting the different spatial locations of the focused mole-cule images in the entrance slit plate. A fluorescence emis-sion spectrum is obtained from the data by integrating the flu-orescence signal in a pixel array centered on single molecule emission peaks followed by background subtraction.
2.3.4 Absorption spectra
The first spectroscopic investigation of single mole-cules was an absorption measurement which used a compli-cated double-modulation scheme.22,23It was based upon opti-cal frequency-modulation spectroscopy (FMS)31with modu-lation frequenciesnmbetween 51 and 91 MHz to eliminate
low-frequency laser noise. FMS experiments are affected by residual amplitude modulation (RAM) which produces spuri-ous background signals owing to unavoidable imbalances be-tween the amplitudes of the two laser side-bands.32Hence, a secondary modulation had to be used to eliminate the RAM. Two different techniques were applied, namely, AC Stark modulation (modulation frequency fm= 2-5 kHz) and
ultra-sonic modulation (fm= 2-5 MHz). Both techniques cause a
periodic shift of the molecular absorption frequency. With both methods, single-molecule spectra could be recorded but the signal-to-noise ratio (SNR) was only about two or three.22,23 Shortly afterwards, the first fluorescence-excitation experi-ment on single molecules was performed which provided a much better SNR with a simpler set-up.24Therefore, all sub-sequent experiments used the fluorescence excitation scheme. Although the absorption experiment reported in the present work repeats the first single molecule experiments,22it em-ploys a less sophisticated electronic scheme.33
The experimental set-up is schematically depicted in Fig. 20. The optical scheme is analogous to a standard SMS scheme described in Sec. 2.2 with the following differences: the microscope objective is placed in front of the sample to focus the laser beam on a single molecule; no filters are used in front of the detector. For experimental details see the PhD. work of Latychevskaia.18
When a radio-frequency (RF) electric field is applied to a single molecule its absorption line moves in the spectral do-main with the same frequencyWm. In the case of low modula-tion frequencies, the single molecule absorpmodula-tion line oscil-lates with the frequency of modulationWm:
492 J. Chin. Chem. Soc., Vol. 50, No. 3B, 2003 Latychevskaia et al.
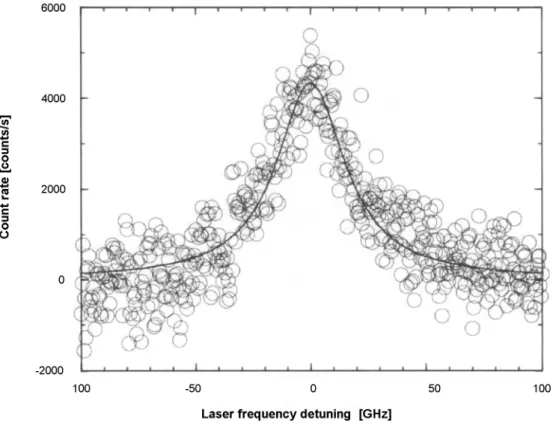
Fig. 17. Result of subtraction of the two spectra in Fig. 16. Fitting a Lorentzian to the data yields a linewidth of 37(2) GHz and a peak count rate of 4530(160) counts/s.6
Fig. 18. (a) Fluorescence emission spectrum of an ensemble of terrylene molecules in naphthalene d8. (b) Spectral image re-corded with the spectrometer’s entrance slit narrowed. Dark colors correspond to high fluorescence intensity. The emission spectrum of a single molecule focused in the entrance slit plane appears as a sequence of dark spots along the horizontal axis. The dark stripes belong to fluorescence from defocused molecules. (c) Spectral image compris-ing the spectrally dispersed image (first order image) and the image reflected in zeroth diffraction order recorded with the entrance slit opened (See Ref. 16 for details).
(10) wherenE
max
is the maximum frequency excursion owing to the linear Stark effect:
(11) ghomis the molecular homogeneously broadened linewidth,
r
Eext,0is the amplitude of the RF field,Dmrindis the difference of the induced dipole moments in the excited and the ground state of the molecule, fLis the Lorentz factor determining the local electric field strength inside the solid matrix, h is Planck’s constant,Wmis the modulation frequency andfmis the phase relative to the local oscillator (molecule).
The signal at the detector output consists of a DC com-ponent and a time-varying comcom-ponent proportional to the am-plitude of the modulation of the transmitted light beam:
494 J. Chin. Chem. Soc., Vol. 50, No. 3B, 2003 Latychevskaia et al.
Fig. 19. Emission spectra of terrylene in naphthalene d8. a) and b) are spectra of single terrylene molecules, c) is the ensem-ble emission spectrum with the vibrational frequencies assigned to the peaks.
hom max 2 2 0 hom ( , ) ( E cos( m m)) G t t g n n n n f g = - - W + + max L ind ext,0 1 E f E h n = Dmr ×r
exp(-G(n, t)).
(12) To extract the DC component or to demodulate the photo-current signal, a mixer is used. Phase-sensitive demodulation of the photo-current signal in the mixer yields a line shape which is proportional to the derivative of the molecular ab-sorption line (for sufficiently small modulation amplitudes):
(13) whereá ñ represents the time average. This is analogous to the phase-sensitive ultrasonic modulation of hole spectra34and also to standard experiments in electron paramagnetic reso-nance (EPR).35
Figure 21 shows the absorption signal of a single terrylene molecule in n-hexadecane. The laser wavelength was 572.097 nm, the modulation frequency being 1 MHz. The laser fquency was scanned over 2 GHz range and then back in the re-versed direction with the same rate. Hence, two copies of the absorption line appear in the plot. The line shape represents the derivative of a Lorentzian profile with equal amplitude above and below the baseline so that we can conclude that this molecule shows a linear Stark effect. The signals at± 0.6 GHz have a slope of the opposite sign; hence, the corresponding molecule shows a Stark shift in the opposite direction.
2.3.5 Matrix isolation technique
Matrix isolation is a technique for trapping reactive
species at very low temperatures, where a guest molecule is fully surrounded by host molecules. With the matrix isolation technique, spectra of single molecules in such matrices as rare gases can be recorded.36,37Details of the experimental apparatus for the single molecule detection and spectroscopy are described elsewhere.36-38Mixture of a rare gas (Xe or Kr) with high-temperature vapours of guest molecules (DBATT or terrylene) is sprayed directly onto the surface of the mirror objective, forming a matrix. The objective is mounted in an electrolytic copper holder and the whole assembly is attached by screws to the cold finger of a cryostat. The matrix deposi-tion procedure begins with pre-cooling the objective down to 40-60 K, then the probe molecules crystals (DBATT or terrylene) are heated inside the nozzle and the rare gas flow starts. When the temperature of the nozzle reaches about 510 K, the objective surface is exposed to the stream (flow rate 1 mmol/h) for about 1 min. The presence of DBATT or terryl-ene molecules is checked by detection of the fluorescence signal. The deposition procedure is repeated when no fluores-cence is observed. After the deposition, the cryostat is filled with liquid helium. The experimental results are shown in Fig. 12. The experiment was performed in a far-field regime and the image shown as a 3-D plot represents the intensity of the fluorescence signal over the observed area for a given flu-orescence frequency. The three peaks represent three single molecules. The three 2-D plots in the insets shows the spectra of the three molecules. Moleculeg disappeared half way dur-ing the frequency scan, causdur-ing a sharp drop in the spectral line shape, indicating perhaps a chemical reaction which quenched the molecule. Such a sudden drop of intensity is very common for single molecules embedded into the matrix with the matrix isolation technique.37
2.4 Effects, observed on single molecules 2.4.1 Pressure effect
In this section we present the typical results of pressure
Fig. 20. Schematic plot of the SM absorption experi-ment setup. MO-microscopic objective, S-sample, APD-avalanche photodiode, RF-RF generator, PS-RF power splitter, AMP-RF amplifiers, M-mixer, LPF-5 MHz low-pass filter, PMPA-postmixer preamplifier, RC-RC circuit.
Fig. 21. Single-molecule absorption signal of terrylene in n-hexadecane matrix.
exp(-G( , )) ~ 1nt -G( , )n t
m (-G( , )) sin(n t W t)
effect studies. We begin with the theoretical background of the pressure effect. The transition energy of a single molecule can be presented as:
(14) wherew00is associated with the transition energy between the ground and the first excited states anddw0(R) denotes the spectral shift due to the interaction between the guest and host molecules as a function of environment variables. Here R is the distance between the molecule under the study and a solvent molecule. The spectral shift due to a group of host molecules can be expressed as:
(15) where K is the constant related to the polarizability of the guest molecule. If host molecules are randomly distributed, then we can use
(16) where V = 4pR¥3/3, and R0represents the nearest distance be-tween the relevant molecule and the surrounding molecule. In the approximation R0<< R¥applies, the spectral shift is:
(17) Using the relation
(18) where p is the external pressure andb is the compressibility factor, we can see that the spectral shift can be written as
(19) This result is obtained under the assumption of a random dis-tribution of host molecules. For a general case, the integra-tion in Eq. (16) should be replaced by a summaintegra-tion.39
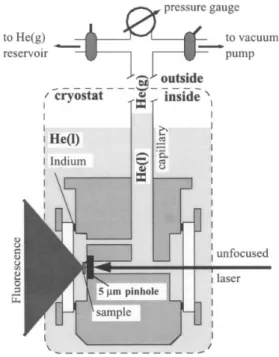
The experimental setup for studying pressure effect on SM spectra can be found in PhD thesis of Mauro Croci.9The cryostat part of the experimental setup is combined with a pressure cell as shown in Fig. 22. The home-built pressure cell consists of a small-volume chamber made of copper, with two quartz windows sealed with indium. The cell fits in the bottom of the cryostat and is connected through a steel capil-lary to the outside, where a pressure gauge, the helium sup-ply, and the vacuum pump are located. During an experiment
the cell is immersed in superfluid liquid helium at a tempera-ture of 1.8 K. Helium condenses in the chamber and in the lower part of the capillary. The pressure of the helium gas in the upper part of the capillary, which is controlled by the gas supply and the vacuum pumps, is transmitted by the con-densed helium to the sample. Hydrostatic pressures from 10 to 1000 hPa can be achieved.
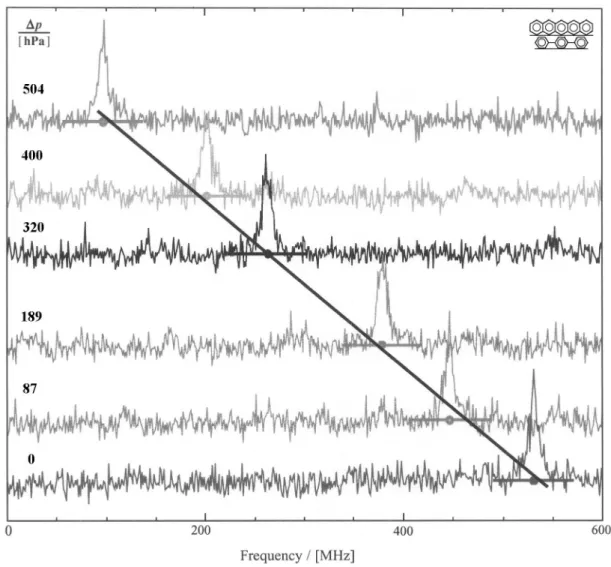
The spectra of a single pentacene molecule at 1.8 K at 592.327 nm, measured for different pressure changes relative to the lowest pressure (typically around 15 hPa) and cor-rected for laser drifts, are shown in Fig. 23. The baseline of the spectra have been shifted vertically, proportional to the pressure change. The projection of the center of the molecule resonance peak onto the baseline is indicated by circles. The molecule resonance shifts with increasing pressure to the red,
496 J. Chin. Chem. Soc., Vol. 50, No. 3B, 2003 Latychevskaia et al.
0 2 0 0 3 3 0 4 4 1 1 ( ) ( ) 3 R R R K R dR R V V R R p p dw ¥ dw ¥ æ ö = = ç - ÷ è ø
ò
Fig. 22. Pressure Cell. The home-made pressure cell consists of a small volume chamber (~ 1 cm3) with two windows. The chamber has a capil-lary, which connects it to a pressure gauge, and two valves, one connected to a helium gas reservoir and the other to a vacuum pump. During operation, the cell is immersed in liq-uid helium. The capillary reaches out of the cryostat, where the gauge and the two valves are located. Liquid helium condenses in the sample chamber, and acts as a pressure trans-mitting medium. The pressure changes in the helium gas phase in the upper part of the capil-lary, which are controlled by the vacuum pump and the helium reservoir, are transmitted to the sample by the liquid.
0 0 0 0( )R w =w +dw 0( ) 6 K R R dw = 3 3 0 0 0 3 6 0 3 6 0 0 4 1 ( ) . 4 R V K K R R R R R R V p dw p ¥ ¥ æ ö = ç - ÷» è ø 0 exp( ) V =V bp 0 6 0 ( )R K exp( p). R dw = -b
as emphasized by the solid line. There are no detectable changes in signal strength and width with pressure in contrast to the hole-burning experiments. This observation opens the possibility of extending the experiment to the high pressure regime by following the shift of a single molecule over a greater range, without the drawback of the signal fading. This could be achieved for the molecules which do not undergo spectral diffusion.40
The measured shiftsDn of the resonance frequency for 3 different molecules are shown in Fig. 24. Linear fits to the measured data are also plotted. The numbers near the points of molecule M2 (black circles) indicate the temporal se-quence in which the data were collected. The shifts were completely reversible within the resolution of our
experi-ments. The slope of the linear fits for the five molecules in-vestigated varied from -0.74 to -1.0 MHz/hPa. The average shift is -0.9± 0.1 MHz/hPa.
2.4.2 Stark effect
In SMS literature, Stark effect means the spectral shift of the SM spectral lines with the applied electric fields. The first measurement on single molecules (pentacene in p-terphenyl crystal) in an electric field was performed in 1992 by Wild et al.41In the following years, Stark effect was mea-sured for different host/guest systems: perylene in n-non-ane,14terrylene in naphthalene,16terrylene in polyethylene,42 dibenzanthanthrene in naphthalene and in n-hexadecane,43 and diperinaphthylenpyren in n-hexadecane.44
The measured Stark shift of a single molecule’s
reso-Fig. 23. Fluorescence excitation spectra of a single pentacene molecule at a wavelength of 592.327 nm measured at 1.8 K for different pressures. The pressure differences are relative to the lower spectrum which was measured at 15 hPa. The spectra have been corrected for laser drifts. The solid line indicates a linear shift of the line centers to lower frequen-cies (emphasized by the gray dots) with increasing pressure.9
nance frequencyDn is:
(20) whereDW(S0) andDW(S1) are the changes of the energy of the molecular ground and first excited states, a and b are the expansion coefficients:
(21) whereDmindcosq is the projection of the difference of the in-duced dipole momentsDmrind=mrSind1 -mrindS0 onto the direction of an external electric field, and D $a is the difference of the polarizabilities in the ground state S0and the first excited state S1:Da = aS aS
1- 0. From a measured spectral trajectory
of a single absorber in an external electric field, its induced dipole moment (projection) and polarizability can be defined. When a centrosymmetric molecule is inserted into a po-lar matrix, its symmetry is broken by strong matrix fields and the molecule gains an induced dipole moment. The more the distortion of the molecule caused by the matrix is, the larger the value of the induced dipole moment is and the larger the
linear shift of the molecule’s resonant frequency in an elec-tric field is. A recent theoretical work of M. Hayashi et al. is dedicated to the mechanism of the formation induced dipole moment of a guest molecule immersed into a host matrix.45
The main part of the experimental setups for perform-ing Stark effect is the electrodes. The electrodes can be a sam-ple sandwich using pieces of ITO glass as shown in Fig. 25;13 in this configuration Eextis fixed perpendicular to the laser field (see Fig. 26). The electrode system can be also a micro-chip with interdigitated golden electrodes (see Fig. 27); with this geometry, the polarization of the laser beam and the ex-ternal applied electric field are co-planar (see Fig. 28).
Linear Stark shifts of several molecules under identical conditions are shown in Fig. 29, where a total laser scan range of 12.1 GHz and an applied electric field strength of -6.7 kV/ cm£ Eext£ 6.7 kV/cm was performed. The lines plotted in Fig. 29 represent the fluorescence of molecules whose ab-sorption maxima shifted in the (nL, Eext)-plane. The dark re-gions are background areas, where no molecules could be ex-cited. From linear Stark trajectory, induced dipole moment of moleculeDmrindcan be estimated.
Historically, quadratic Stark effect was the first
re-498 J. Chin. Chem. Soc., Vol. 50, No. 3B, 2003 Latychevskaia et al.
Fig. 24. The spectral shifts of the zero phonon lines are plotted against the changes in the hydrostatic pressure for three dif-ferent pentacene molecules in the O1site of a p-terphenyl crystal. Linear fits to the data are also plotted. The numbers indicate the temporal sequence in which the data for molecule M2 (black circles) were collected. The process is com-pletely reversible to within our experimental accuracy.9
2 1 0 ext ext (S ) (S ) hD = Dn W - DW =aE +bE +L 2 ind L L 1 cos , 2 a= -Dm qf b= - Daf
ported Stark effect on single molecules, measured in Wild’s group in 1992.41Spectra of four single pentacene molecules recorded in that experiment, demonstrating quadratic Stark effect, are shown in Fig. 30. From the quadratic coefficients, the polarizabilities of molecules can be calculated. Report on negative quadratic Stark shifts can be found in the PhD thesis of Hermann Bach.16
Recently, a higher-order Stark effect was observed on a dibenzanthanthrene molecule in naphthalene matrix by Christian Brunel and co-workers.43Cubic Stark effect was re-produced on several terrylene and diperinaphthylenpyren molecules in hexadecane matrix in Wild’s group.18,44Two molecules demonstrating higher-order (cubic) Stark effect are shown in Fig. 31. Higher order Stark effect can be ex-plained in terms of inhomogeneous internal field of the ma-trix.44
Different experimental techniques for studying Stark effect in constant and in alternating electric fields can be found in the literature.14,16,18,44
2.4.3 Spectral jump
To date, the spectral jump phenomena have been one of the most exciting experimental observation in single mole-cule spectroscopy. An example of spectral jump is shown in Fig. 32. The displayed molecule is spectrally jumping be-tween two states during experiment.
Anderson et al.46and Phillips47independently intro-duced a TLS (two-level system) model explaining the “anom-alous” behavior of the specific heat and thermal conductivity in glasses. TLSs are the simplest representation of the multi-dimensional energy surface. At any point within the sample, certain groups of atoms or molecules have access to two (or more) potential energy minima and can switch between these two minima by a tunneling process as, for example, ammonia molecule does. A TLS involves an asymmetric double poten-tial well, (see Fig. 33). The surface consists of three regions Fig. 25. “Sample sandwich” for Stark effect experiments. Notice that ITO coated cover glasses and an additional pinhole foil
is used on the emission side.13
Fig. 26. In the “sample sandwich” configuration of Stark effect experimets, the laser propagation directionk is always parallel tor Erext. The polar-izationP is rotated byr w around the y-axis to
minimize the anglea betweenP and the transi-r
represented by L, R and M. Transitions between the two wells represent changes in the local structure of the material. One or several TLSs distributed randomly in the matrix might in-teract with a single molecule. At helium temperatures the thermal energy is lower than the potential barrier so that a transition between the wells is caused by tunneling along a generalized coordinate Ql, which characterizes the degrees of
freedom involved. The Qlcoordinate might represent the
po-sition of one atom or a center of mass of a larger system, or a rotation angle of some group of atoms. Although the effects of TLSs has been observed in a wide variety of chemically different systems for two decades, the nature of these degrees of freedom is not known. However, to explain spectral dy-namics of single molecules at low temperature, the two-level system, is often used.48-53
In the system represented by Fig. 33, the Hamiltonian operator is approximately given by
(22) Here $HLand $HRrepresent the Hamiltonian operator of L and R, respectively.
For the case in which vibrational relaxation is much faster than reaction, a thermal average should be introduced to write the transition probability W from L to R as54-56
(23) where PLrepresents the Boltzmann distribution, and XRand XLdenote the wavefunctions for R and L, respectively.
Sup-500 J. Chin. Chem. Soc., Vol. 50, No. 3B, 2003 Latychevskaia et al.
Fig. 27. Sample-holder with electrodes. (a) Picture of the sample-holder. (b) Teflon washer with chip. A drop of sample is placed between the chip and a microscope slide. (c) Pyrex chip with interdigitated electrodes.
Fig. 28. (a) The geometry of the electric field on the chip with electrodes.Erext- externally applied electric field vector, r
k
-the laser propagation vector,P is the laser polarization vector, andr H is the magnetic component of the laser beam.r
(b) Sum of images recorded in white and laser light. The black stripes are the chip electrodes. The bright spots are the fluorescence signals from single molecules. The crystal structure of the sample can be seen.
L M R R M L ˆ ˆ ˆ ˆ ˆ ˆ ˆ . H=H +V +V =H +V +V 2 L R MR L R L L R 2 ˆ | | ( ) W = p
åå
P X V X d E -E hpose that the transition between L and R is through coupling of one promoting model (the reaction coordinate being Ql), and that we can write the wavefunctions as
(24) and
(25)
where Qiis the coordinate of the i-th mode in L and Qi '
is that of the same mode in R, whileuiandui¢are the vibrational
quantum numbers of those modes, respectively.cLviis the wavefunction of the i-th mode in L, and so on. Here we as-sume that they are harmonic modes. Substituting Eqs. (24) and (25) into Eq. (23) yields
(26) where the time-correlation functions Gl(t) and Gi(t) are given
Fig. 29. Molecular linear Stark effect. The most intensely fluorescing molecules are labeled with “A” to “F”. The dashed line indicates the mirror symmetry axis in the experiment. The rectangular inset, which is a blown up section of the cir-cled region, shows a spectral jump in Stark trace D. 500 sweeps, accumulated with an electric field ramp repetition rate of 433 Hz, were summed up to obtain one scan at a fixed laser frequency. The laser frequency step size wasDnL = 48 MHz. i L Lv Lv ' ( ) ( ), i i X = íì c Q üýc Q î
Õ
þ l l i R Rv' Rv' ' ' ( ) ( ), i i ' X = íì c Q üýc Q îÕ
þ l l 0 RL ' 2 ( ) ( ) it i i W p ¥dt ew G t G t -¥ =ò
lÕ
hby
(27) and
(28)
More complicated cases can be also be treated in the same manner.
For displaced harmonic oscillators, Gi(t) can be
ex-pressed as56,57
(29) wherewiis the vibrational frequency of the i-th mode, Siis the
502 J. Chin. Chem. Soc., Vol. 50, No. 3B, 2003 Latychevskaia et al.
Fig. 30. Quadratic Stark effect measured on four single pentacene molecules in p-terphenyl matrix.41The circles denote the resonance position of a single molecule.
Fig. 31. Two single Tr and DPNP molecules showing a higher order Stark effect. The lower parts of the picture show molecu-lar spectra in the absence of an external electric field. The scans with and without external field were performed in al-ternating fashion in order to eliminate laser drift from the data.
( ) exp (2 1) {( 1) it i it i} , i i i i i i G t = ëé-S n + +S n + ew +n e-w ùû Rv ,Lv 2 Lv Rv Lv ' ' ' ˆ ( ) | | it MR G t P V ew u u c c =
åå
l l l l l l l l Rv ,Lv i i 2 Lv Rv Lv ' ' ( ) | i i. i i i it i G t P e w u u c c =åå
'coupling constant, and niis the thermal-average occupation
number of that mode. That is,
(30) Using Eq. (29) we obtain
(31)
For the strong coupling case, we can use the short-time
ap-Fig. 32. Resonance frequency changes for a single terrylene molecule. (a)-(f): Six sequential fluorescence excitation spectra with 40 s per scan, 0.32 W/cm2laser intensity, and the time between scans varying from 2 to 10 min. Inset: gray-scale image of continuous “fast” 1 GHz (only 90% plotted) excitation spectra. The x-axis is the laser frequency detuning, the y-axis corresponds to the time axis (scans are plotted consecutively from bottom to top), and the darkness of the image represents the fluorescence intensity. There are a total of 2220 scans acquired over 5683 s, with 10 ms/point, 256 points/scan, and 1.1 W/cm2probing intensity.
Fig. 33. The two-level model often used in treating the spectral jump phenomena.
Fig. 34. The particular potential energy surface used in the model of spectral jump in this work.
{
}
0 RL 2 ( ) exp (2 1) ( 1) it i iti i i i i W dt G t it S n n ew ne w p w ¥ -¥ -= é ù ´ ê + - + + + + ú ë ûò
å
l h(
/ B)
2 ' ( ) ; 1/ 1 . 2 i k T i i i i i S =w Q -Q n = ehw -hproximation:
(32) In the classical limit, Eq. (32) becomes Arrhenius equation.
From the above treatment we can see that up to this point, the details of the potential surfaces along the reaction coordinate Qlis not specified. For this purpose, we consider a
particular case, (33) Notice that (34) where (35)
For the approximate case Gl= |ácR0¢l|VMR|cL0lñ|
2 , we find (36) where (37) Ife << 1, then (38) That is, Glshows an isotope effect. For example. for hydro-gen H and deuterion D, we have
(39) In other words, the transition is slower for heavier isotopes. Thus a correct tendency is predicted.
Asymmetric double well model can also be solved in the similar manner, and it is more suitable for describing the spectral jump phenomena in SM, but the algebra involved is more complicated so we do not discuss it further here.
504 J. Chin. Chem. Soc., Vol. 50, No. 3B, 2003 Latychevskaia et al.
Fig. 35. Frequency shifts of terrylene in hexadecane interpreted by TLS model.
2 MR 0 2 4 2 0 0 0 ( ) ( ) ( ) 2 = ( ) 4 64 2 K V x V x x x K K K V x x x x V = - + - + - + 2 0 0 2 0 0 0 ; ; 4 ; 2 4 8 ( / 4) ; . 4 a a x V K a b b V K b x V K = = = = = 0 2 RL 2 2 2 ( ) (0) 2 exp (2 1) 2 (2 1) i i i i i i i i i i i S G W S n S n w w p w w é- + ù = + ê + ú ê ú ë û
å
å
å
l h 2 2 4 ( ) . 4 a V x ax bx b = - + 2 2 8 / 0 3 3 3 8 256 G =êéV e- eçæ- - e+ e ö÷ùú è ø ë û l 0 0 0 0 . K K K V m V mK V m V w e w = l = l = l = l l l h h h h 8 / 2 2 0 0 0 16 ( 3 ) 9 exp V m . G V e V K e - æ ö = - = çç- ÷÷ è ø l h ( ) ( ). G Dl <G Hl3. SINGLE MOLECULES AT ROOM TEMPERATURE
A big advantage of doing room temperature single mol-ecule detection is an opportunity to perform biological exper-iments. A scheme of confocal setup for detection single mol-ecules at room temperature is shown in Fig. 38. In this config-uration, the illumination spot size is diffraction limited and is in order of nm. Figure 39 shows a wide-field illumination setup which can be obtained from confocal setup by introduc-ing a lens into the excitation beam, which enlarges the laser
spot up to 10-20mm in diameter. Thus, a room temperature experimental setup can be switched between confocal and wide-field illumination by inserting a flipping lens. The mol-ecules are excited at an average power of 500 W/cm.2
3.1 “Oxygen” effect
One of the easiest and most demonstrative room tem-perature single molecule experiment is the observation of triplet lifetime quenching by molecular oxygen.58Images taken during such an “oxygen” effect experiment are shown Fig. 36. Detection electronics. An external clock (and a time divider) gives the timing (dashed line) to the experiment. Upon
receiving a trigger signal in their LBRC-inputs, the binary counters load their buffers with the current data and reset the counter. The data are read from their buffers by Digital 488, which receives the same trigger pulse in its EDR-input. The signal consists of 40 bits divided in two times 16 bits from the counters and 8 bits not used. This data is then transferred to the computer. The laser frequency is driven by a digital-to-analog converter. A voltage ramp is stored in its buffer, and upon receiving a trigger signal, the device is programmed to output the next value stored in its buffer.9
506 J. Chin. Chem. Soc., Vol. 50, No. 3B, 2003 Latychevskaia et al.
Fig. 37. Three scans over the same terrylene molecule, excited with three different laser powers. Spectrum(a) was recorded with 350 mW/cm2, and consists of 1540 scans lasting» 58 min. Spectrum (b) was recorded with 1 W/cm2, and con-sists of 2000 scans,» 85 min long. Finally spectrum (c) was recorded with 3.1 W/cm2, and consists of 1680 scans,» 71 min long.9
Fig. 39. Confocal setup switched into regime of wide-field illumination.
Fig. 40. Sequence of images illustrating the influence of oxygen on the fluorescence intensity of individual DiI18molecules when the sample is flushed with nitrogen [(a) and (c)] and oxygen [(b) and (d)], respectively. Below the integrated intensity of a sequence of 510 images is plotted. The intensity time traces of two individual spots illustrate the photo-chemical bleaching58
in Fig. 40. The probe molecule was DiI18embedded into a PMMA matrix by the spin-coating technique. The sample was flashed with oxygen and nitrogen, while images were ac-quired with a CCD camera (wide-field configuration of the setup). The recorded images clearly show increase of the in-tensity when the sample was exposed to air (oxygen), and al-most complete “off” intensity when the sample was exposed to nitrogen flow. In Fig. 40, images taken at an integration time of 100 ms impressively illustrate the effect of oxygen when the nitrogen flow to the sample is stopped and switched on, respectively. The number of fluorescing single molecules decreases during exposure to air due to photochemical bleaching.
By positioning individual molecules within the confo-cal volume of the SCOM system (actually the experimental setup is “switched” into the SCOM configuration as de-scribed above), the transient intensity shown in Fig. 41 was obtained by counting single-photon detection from a single molecule. The distribution of the “on” and “off” time of the fluorescence has been analyzed over 248 DiI18molecules.58It is found that, during exposure to oxygen, the triplet lifetime was lowered by two orders of magnitude. The quenching ef-fect was shown to dramatically increase the average emission intensity in comparison to the absence of oxygen. With fur-ther analysis, it was found that the (radiative) decay time
from S1to S0was 3.3 ns, and the triplet lifetime of T1was about 320ms. The intersystem-crossing quantum yield YISC was determined to be 3.3´ 10-4(see the summarizing dia-gram in Fig. 42).
3.2 Rotary motion of F0F1 ATP synthase
This subsection is dedicated to the single molecule room temperature observation of ATP. ATP is the universal biological energy source; it is formed by F0F1ATP synthases from ADP and inorganic phosphate with the use of energy from a transmembrane ion potential established by photo-synthetic or respiratory processes. F-type ATP synthases are widely distributed in nature and occur in the cytoplasmic membrane of bacteria, the inner membrane of mitochondria and the thylakoid membrane of chloroplasts. All known F0F1 ATP synthases show conserved structural and functional fea-tures and are composed of two distinct subcomplexes termed F1and F0. The F1sector is membrane-associated and harbors the catalytic sites of ATP synthesis, while the F0sector is membrane-intrinsic and contains the coupling ion trans-location machinery. The elucidation of the structure and the enzymatic mechanism of F0F1earned Paul D. Boyer and John E. Walker the 1997 Nobel Prize for Chemistry.
In the case of P. modestum, ATP synthase comprises eight different subunits with a stoichiometry ofa3b3gdefor F1
508 J. Chin. Chem. Soc., Vol. 50, No. 3B, 2003 Latychevskaia et al.
Fig. 41. Fluorescence intensity time trace of a single molecule under being flushed with nitrogen and air (oxygen). The arrow indicates the termination of the nitrogen flush. It can be seen from the two lower pictures that, while the intensity of the emitted fluorescence remains constant, the duration of the dark periods is changed.58