國 立 交 通 大 學
生物資訊研究所
碩 士 論 文
改進結構字元式的RNA三級結構比對
Improving Structural Alphabet-Based Alignment of
RNA Tertiary Structures
研究生:王志偉
指導教授:盧錦隆 博士
改進結構字元式的RNA三級結構比對
Improving Structural Alphabet-Based Alignment of
RNA Tertiary Structures
研究生:王志偉
Student:Chih-Wei Wang
指導教授:盧錦隆 博士 Advisor:Dr. Chin Lung Lu
國 立 交 通 大 學
生 物 資 訊 研 究 所
碩 士 論 文
A Thesis Submitted to Institute of Bioinformatics
College of Biological Science and Technology
National Chiao Tung University in partial Fulfillment of the
Requirements for the Degree of Master in
Biological Science and Technology
June 2009
中文摘要
近年來我們越來越了解 RNA 分子,尤其是非編碼 RNA,在細胞中 的許多調節過程都扮演了非常重要的關鍵,譬如在轉錄後的調節、轉錄 轉譯的基因調節、核醣體移碼與化學修飾等調節功能。如同蛋白質,RNA 的功能也取決於它的三級結構並非其一級序列,這代表偵測 RNA 三級 結構間的相似度能讓我們更深入的了解其功能甚至是演化上的關係。除 此之外,近年來被解析出來的 RNA 結構不論是數量或是大小都快速的 增加,使得我們若要使用人工的方式去比較或分析這些 RNA 的三級結 構將會是困難且耗時的。因此,發展一個有效又準確去比較 RNA 三級 結構的方法是相當重要的。 在這個研究中我們提出了一個改良結構字元式的 RNA 三級結構比 對演算法。藉由採用兩個假扭轉角來取代四個真實的扭轉角與使用親合 性互動式 (affinity propagation) 分群方法取代向量量子化 (vectorquantization) 的分群方法來建構出新的結構字元集,這個新的結構字元 集確實改善了先前研究中演算法的準確性。特別的是我們達成上述的改 善時並沒有犧牲演算法的計算效率。除此之外我們也在實驗中證實了我 們應用這個演算法所發展的程式工具 iPARTS 的確比起我們先前的版本 PARTS 有較好的表現,而 PARTS 已被證明是要比 DIAL 要有較好的準 確性。因此,我們認為在結構生物學的研究上 iPARTS 可做為一個有用 的工具,目前可連結到以下網址使用
Abstract
In recent years, it is more and more clear that RNA molecules, especially the non-coding RNAs, play important roles in several regulatory processes, such as post-transcriptional regulation, transcriptional and translational gene regulation and chemical modification. Similar to proteins, the functions of these non-coding RNAs depend on their three-dimensional (3D) structures, rather than their primary sequences, suggesting that detecting structural similarities among RNA 3D structures can bring more significant insights into their functional and even evolutionary relationships. Moreover, the number and the size of solved RNA 3D structures have rapidly increased in past few years, making it difficult and time-consuming to manually compare and analyze these RNA 3D structures. Therefore, developing an effective and accurate method for RNA 3D structure comparison is imperative.
In this study, we have proposed an improved structural alphabet-based algorithm for RNA 3D structure comparison. It improves the accuracy of our previous algorithm by replacing four standard torsion angles with two pseudotorsion angles and by using a recently introduced affinity propagation clustering approach for constructing of structural alphabet. Particularly, we achieve the above improvement without compromising the computational efficiency of the algorithm. We also demonstrate that the new version of the implemented program, called iPARTS, indeed outperforms its previous version, named PARTS, which in turn has been shown previously to outperform other existing tool DIAL. The iPARTS web server is available online at http://bioalgorithm .life.nctu.edu.tw/iPARTS/ that can serve as an useful tool in the study of structure biology.
Acknowledgement
經歷了兩年的研究所學習生涯,終於要跨向人生的下一個里程,在 踏出交通大學這個校門時,首先我要感謝我的指導教授盧錦隆教授,跟 著老師做研究讓我學到了研究該有的的態度,思考的邏輯,與演算法的 精神,讓我在這兩年成長了許多。 此外我也要感謝實驗室的夥伴們,感謝彥菱學姐能跟我討論演算法 的問題,能讓我更能清楚的了解其中的意義,更讓我見識到的人妻對於 精打細算與折價卷的熱衷,稱其為折價券女王也不為過;感謝禮瑋學長 當初帶我誤打誤撞進了演算法實驗室,才能得以在研究所兩年的時間過 得那麼的充實快樂;在這邊特別要感謝演富學長,教導我 Linux 的使用 與帶領我寫了第一支完整的程式,並在後續的研究上留下了許多程式的 bug,讓我的程式功力得以透過解 bug 之中突飛猛進;也感謝實驗室的 學 弟 妹 們 , 由 其 是 昆 澤 在 研 究 資 料 的 蒐 集 上 幫 了 我 很 大 的 忙 , 在 facebook 上也提供了我許多新鮮的食材,但別在科了有時候也該正常一 點;感謝我的同學們這兩年來的相互扶持,歷經了許多的歡樂與辛苦, 由其是慶恩同學這兩年來一起被老闆念,一起修課寫程式,熬夜趕進度 趕作業,也提供了我許多寫程式上的幫助,並時常為實驗室帶來許多的 歡樂。 最後我要感謝我的家人,在我人生的路上一直對我的支持,讓我得 以無憂無慮的全心全力學習,有他們今日我才能順利的畢業取得學位。 志偉 2009 年 8 月新竹交通大學Contents
Chinsese abstract ... I
Abstract ... III
Acknowledgement ... IV
Contents ... V
List of tables ... VI
List of figures ... VII
Chapter 1 Introduction ... 1
Chapter 2 Materials and Methods ... 6
2.1 Pseudotorsional Angles and Ramachandran-like ε – ζ Plot ... 7
2.2 Affinity Propagation and Structural Alphabet ... 10
2.3 BLOSUM-Like Scoring Matrices ... 15
2.4 Sequence Alignment Algorithms ... 17
Chapter 3 Implementation of Software Tool ... 20
3.1 Input of iPARTS ... 20
3.2 Output of iPARTS ... 23
Chapter 4 Results and Discussions ... 24
4.1 Features and Clustering of the ε – ζ Plot ... 24
4.2 Comparison with PARTS ... 28
Chapter 5 Conclusions ... 31
List of tables
Table 2-1. The structural alphabet of 23 conformational clusters
classified by the AP algorithm with their associated letters and the ε and ζ pseudotorsion angles of their corresponding centers……...12
List of figures
Figure 2-1. (a) Diagram of a nucleotide showing the standard backbone
torsional angles. (b) Diagram depicting the definitions of pseudotorsions, ε and ζ. The red lines indicate the pseudo-bonds that connect successive P and C4’ atoms. (These pictures are adapted from [24].)……...…………...7
Figure 2-2. An ε-ζ scatter plot of all nucleotides from our dataset…….9
Figure 2-3. The ε-ζ scatter plot with 23 clusters differentiated by
different colors………13
Figure 2-4. BLOSUM-like scoring matrix……….16
Figure 2-5. A mosaic effect with an inclusion of a poor internal region
in an alignment (These picture is adapted from [2])……...17
Figure 3-1. Interface of iPARTS………21
Figure 3-2. The output page of iPARTS……….22
Figure 4-1. Average error as a function of the number of clusters……24
Figure4-2. The 3D conformation of 23 exemplar nucleotides: The
exemplar nucleotides are shown in green, whereas the portions of the previous and next nucleotides that affect the pseudotorsions are shown in blue.………...…26
Figure 4-3. The ROC curves when using the global and semiglobal
alignments of iPARTS and PARTS to align RNA structural from the SCOR database. (A) The results of the testing dataset 1. (B) The results of the testing dataset 2.………….……….29
Chapter 1
Introduction
In recent years, it is more and more clear that RNA molecules are not only the carriers of genetic information, but also play important roles in several regulatory processes, such as protein synthesis (e.g., mRNA, rRNAs and tRNAs), post-transcriptional regulation (e.g., micro RNAs and small interfering RNAs), transcriptional and translational gene (e.g., allosteric conformational changes in riboswitches), and chemical modification of specific nucleotides in the ribosome, and so on [11][22][17][3]. Similar to proteins, the functions of these non-coding RNAs depend on their three-dimensional (3D) structures, rather than their primary sequences, suggesting that detecting structural similarities among RNA 3D structures can bring more significant insights into their functional and even evolutionary relationships that would not be detected by sequence information alone. Moreover, the number and the size of solved RNA 3D structures in the Protein Data Bank (PDB) [4] have rapidly increased in past few years, making it difficult and time-consuming to manually compare and analyze these RNA 3D structures. Therefore, developing an effective and accurate method for RNA 3D structure comparison is imperative.
Basically, detecting structural similarities in two RNA molecules at the tertiary structure level is a difficult problem, since it has been shown to be NP-hard to find a constant ratio approximation algorithm for computing a pair of maximal substructures from two RNA 3D structures with exhibiting the highest degree of similarity [16]. Due to this reason, currently available tool for comparing two RNA 3D structures are all based on heuristic approaches.
Recently, several methods have been developed for RNA 3D structure comparison. ATRS proceeds by a seed match followed by a greedy extension to approximately compute the largest common point set between two RNA molecules [8][9], where a seed is composed by four phosphate atoms of two consecutive base-pairs. DIAL performs an alignment of two RNA molecules based on a quadratic time dynamic programming algorithm by taking into account sequence similarity, torsion and pseudo-torsion angles and base-pair information [12]. It also provides three alignment methods, including global, local and semi-global alignments for different applications. SARSA is based on a structural alphabet-based algorithm that reduces input RNA 3D structures to 1D sequences of structural alphabet letters and uses classical sequence alignment algorithms to compare these 1D SA-encoded sequences for determining their structural similarities. It contains PARTS for aligning two RNA structures and MARTS for aligning two or more RNA structures [6]. Like DIAL, it also provides three alignment methods and particularly it implements normalized local
alignment for eliminating the mosaic effect of local alignment. SARA aligns two RNA structures based on a unit-vector alignments strategy [5]. It calculates user-defined atoms’ trace (unit-vector) of input RNA structure, and a set of consecutive atoms’ unit-vectors will be turn into a unit-spheres. The structure alignment can be achieved by dynamic programming procedure using an all-against-all score matrix calculated with the unit-vector root mean square distance between all pairs of unit-spheres from each structure.
Although the ARTS, DIAL, PARTS and SARA generally result in accurate RNA structure alignments, they have some limitations and deficiencies: (1) ARTS requires the existence of secondary structure elements in both structures to compute the final alignment, and it can’t deal with the RNA loop structures only. Due to its cubic time complexity algorithm, it is still a little time-consuming job for ARTS to compare large RNA molecules and sometimes the results of ARTS may be incorrect, as were demonstrated in [12]. (2) DIAL only calculates an alignment score in its default version and requires substantial computational time to return a statistical evaluation of its significance. However, it may still be incorrect for some pairs of RNA 3D structures, as were demonstrated in [6]. (3) PARTS uses torsion angles to deduce the structure alphabet. But it is not so perfect to use these standard torsions for classifying RNA structure motifs, because of the “crankshaft effect”, in which large changes in one torsion angle are compensated by others [24]. Therefore, it may lose the accuracy of
the structure alphabet in some case (see the Experimental Results chapter). (4) SARA is a new tool for RNA structure alignment, but it can not specify the region of the input RNA molecular.
In this study, we have proposed an improved structural alphabet-based algorithm for RNA 3D structure comparison. Instead of using the four standard torsion angles (α, γ, δ and δ) of RNA and the VQ clustering approach as done in our previous work [6], we adopt the two pseudotorsion angles (ε and ζ) of RNA and utilize a recently introduced clustering algorithm, called affinity propagation [13], to classify the nucleotides in the 2-dimensional ε-ζ plot. Like k-means clustering approaches, the VQ methods suffer from local optimality and are sensitive to outlines and noise [25]. Another limitation of the VQ clustering is that the identified centers in the cluster may not be virtual nucleotides that cannot be evaluated visually. Basically, the AP algorithm is an exemplar-based clustering method by simultaneously considering all data points as potential exemplars and exchanging messages between data points until a good set of exemplars and clusters emerges. In particular, Fray and Dueck [13] have shown that the AP algorithm can obtain better solutions than other frequently used methods, such as K-centers clustering and hierarchical agglomerative clustering. After obtaining this novel structural alphabet using the AP algorithm, we derive a log-odds matrix for SA-letter substitutions using the statistical method that was used by Henikoff and Henikoff [14] to derive the BLOSUM family of substitution matrices for amino acid sequences. Moreover, using this
structural alphabet (SA), we reduce RNA 3D structures to 1D sequences of SA letters and then use classical and efficient sequence alignment algorithms, such as global [19], semiglobal [20], local [21] and normalized local [2] alignments, to compare these 1D SA-encoded sequences and determine their structural similarities. Based on the above modifications, we have reimplemented our previous tool PARTS as a new web server named iPARTS and have also evaluated its accuracies of pairwise RNA structural alignments on a testing dataset of RNA 3D structures. Our experimental results have finally shown that our current iPARTS indeed outperforms its previous version PARTS, which in turn have been shown previously to outperform other existing web server DIAL, without compromising the computational efficiency.
Chapter 2
Materials and Methods
The basic idea we used in this study is as follows. We first use the affinity propagation approach, an excellent method for clustering with much lower error than other methods [13], to derive an RNA structural alphabet of 23 letters that represent distinct and most common backbone conformations. According to this structural alphabet, we transform RNA 3D structures to 1D sequence of SA-encoded letters. Then we utilize classical and efficient sequence alignment algorithms to compare these 1D SA-encoded sequences and determine their structural similarities. In this chapter, we will describe the details of (1) how to use the affinity propagation approach to derive the structural alphabet and transform RNA 3D structures into 1D sequences, and (2) how to derive the substitution scoring matrices for aligning 1D SA-encoded sequences, and (3) how to utilize normalized local alignment in RNA 3D structural comparison.
2.1 Pseudotorsional Angles and
Ramachandran-like η – θ PlotFor protein backbones, two torsion (or dihedral) angles (φ and ψ) are sufficient to describe the backbone conformation of each amino acid residue. In contrast, RNA molecules have much higher dimensionality, since for each nucleotide residue there are six backbone torsion angles (α, β, γ, δ, ε and δ) (see Figure 2-1a) and a torsion angle of the bond between base and ribose ring (χ). This leads the analysis and classification of nucleotide conformation to be a high-dimensional problem that is computationally intractable and cannot be evaluated visually. In addition, it is difficult to use these standard
Figure 2-1. (a) Diagram of a nucleotide showing the standard backbone
torsional angles. (b) Diagram depicting the definitions of pseudotorsions, ε and ζ. The red lines indicate the pseudo-bonds that connect successive P and C4’ atoms. (These pictures are adapted from [24].)
torsion angles to distinguish nucleotide conformations, because the so-called
crankshaft effect usually results in that different combinations of stand
torsion angles can describe identical nucleotide conformations. Recently,
Duarte and Pyle [10][24] have introduced an approach for defining and
describing RNA structure in a simple, mathematically consistent, and computationally accessible manner which involves the of two pseudotorsions, ε and ζ. Like φ and ψ for proteins, ε and ζ can be used to describe RNA conformation in much the same way. Base on this approach, we reduce the nucleotide backbone to two imaginary torsion angles that result from pseudobonds connecting C4’ to P atoms: ε (C4’n-1, Pn, C4’n, Pn+1)
and ζ (Pn, C4’n, Pn+1, C4’n+1) (see Figure 2-1b). By plotting ζ versus ε values
for nucleotides of a representative RNA structural dataset, we can obtain a Ramachandran-like scatter plot that displays clustering of nucleotides with similar comformation.
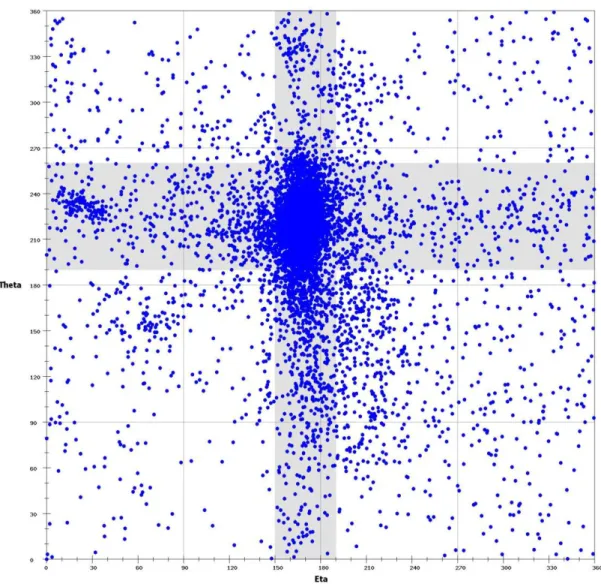
In this study, we select an RNA dataset from PDB. It includes non-redundant medium to high-resolution (minimum resolution of 3.0 Å ) X-ray crystal structures from PDB that were deposited before 1 November 2008. Finally, we obtain a dataset with 117 PDB files, particularly including 74 structures that were used by Wadley et al. [24], containing 130 RNA chains and 9,527 nucleotides in total. We then used the AMIGOS program to calculate the ε and ζ pseudotorsion angles for all non-terminal nucleotides (9,267 nt) from all RNA molecules in the above dataset and plotted these calculated pseudotorsion angles on the axes of a two-dimensional plot, as
was illustrated in Figure 2-2. This two-dimensional representation provides an intuitively accessible, graphic representation of quantitatively distinct structural features.
2.2 Affinity Propagation and Structural Alphabet
As mentioned in [10], clusters in this plot of nucleotides with similar ε and ζ torsional angles have similar conformational properties. For this reason, we utilized a new clustering approach, called affinity propagation (AP) proposed by Fery and Dueuk [13], to classify all the nucleotides on the plot. Basically, the AP algorithm is an exemplar-based clustering method for approximately solving the exemplar learning problem that aims to identify a set of data points as exemplars and assign every data point to an exemplar so as to maximize a fitness function, where the exemplar learning problem has been show to be NP-hard [7].Denote the input data points by x1, x2,…, xn, the
exemplar assigned to xi by ci, and the similarity between xi and ci by s(xi, ci).
Then the fitness function mentioned above is defined to be 𝑛𝑖=1 𝑠(𝑥𝑖, 𝑐𝑖). Notably, if xi is an exemplar (i.e., ci = xi), then the fitness function includes
the term s(xi, ci).
Currently, most existing approaches for the exemplar learning problem (e.g., k-centers clustering) take as input an initial and fixed set of exemplars that are often randomly selected and then iteratively refine the exemplar set while changing the clusters to match the set of exemplars. In fact, the k-centers (also known as k-medians) clustering is very similar to the widely used k-means clustering, except that its identified centers have to on data points. The AP algorithm identifies exemplars among data points and forms
clusters of data points around these exemplars. It operates by simultaneously considering all data point as potential exemplars and exchanging messages between data points until a good set of exemplars and clusters emerges. For simplicity, the similarity s(xi, xj) between two points xi and xj is also denoted
as s(i, j). In each iteration, two kinds of messages (i.e., responsibility and availability) were exchanged between data points. The responsibility r(i, k) that is sent from point xi to point xk indicates the accumulated evidence for
how proper it would be for xk to serve as the exemplar of xi, with taking into
account other potential exemplars for xi. Before being sent, the value of r(i, k)
is updated according to the following rule: r(i, k) = s(i,
k) –max𝑘′:𝑘′≠𝑘 a 𝑖, 𝑘′ + s 𝑖, 𝑘′ . The availability a(i, k) that is sent from
point xk to point xi indicates the accumulated evidence for how proper it
would be for xi to choose xk as its exemplar, with taking into account the
support from other points that xk should be an exemplar. The value of a(i, k)
is updated as follows: i ≠ k, then
𝑎(𝑖, 𝑘) = min 0, 𝑟 𝑘, 𝑘 + max 0, 𝑟 𝑖′, 𝑘
𝑖′s.t.𝑖′∉ 𝑖,𝑘 ; otherwise,
𝑎(𝑘, 𝑘) = max 0, 𝑟 𝑖′, 𝑘
𝑖′s.t.𝑖′∉ 𝑘 . It should be noted that numerical
oscillations may arise in some circumstances when updating the above messages. To avoid such oscillations, therefore, each message is set to λ times its value from the previous iteration plus 1−λ times its currently prescribed updated value, where λ is a damping factor whose value is between 0 and 1. In this study, we used a default damping factor of λ = 0.9. The above message-passing scheme is referred to as affinity propagation. At
any point during the affinity propagation, responsibilities and availabilities are combined to identify exemplars. That is, for data point xi, the k that
maximizes r(i, k) + a(i, k) indicates that xk is the exemplar of xi. Finally, the
message-passing procedure may be terminated after a fixed number of iterations (or after the changes in the messages fall below a threshold or the local decisions stay constant for some number of iterations).
Here, we set global values to s(k, k) for all 1≦k≦n such that a total of 9267 non-terminal nucleotides in the ε-ζ plot is classified into different numbers of conformation clusters. Finally, we chose 23 as the number of the clusters on the ε-ζ plot based on the following reasons. In this study, we have tried the numbers from 3 to 60, and the 23 has a lower average error and it will allows one to apply BLAST, the most widely used tool of sequence homology search, for efficiently performing the structurally similar search on the database consisting of the SA-encoded sequences of RNA 3D structures. For our purpose of transforming RNA 3D structures into 1D sequences, we further assigned a letter to each of 23 clusters, as named in Table 2-1. We used the set of these 23 letters as a structural alphabet (SA) and then encoded RNA 3D structures as 1D sequences of SA letters by assigning each residue in the RNA molecules with the letter of the cluster whose center is nearest to the residue being encoded, where the distance between the residue and each center is the square root of the sum of all squared torsion differences. Like ordinary nucleotide sequences, these SA-encoded 1D sequences can then be aligned using classical sequence
alignment methods or searching similar RNA structures using BLAST method.
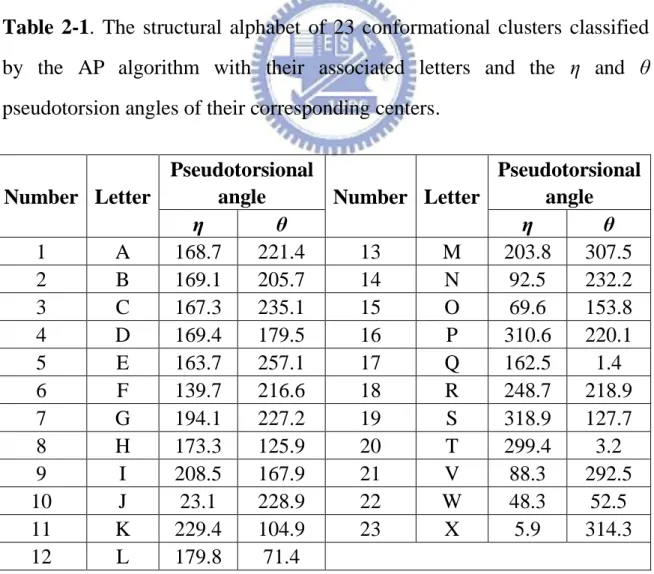
Table 2-1. The structural alphabet of 23 conformational clusters classified
by the AP algorithm with their associated letters and the ε and ζ pseudotorsion angles of their corresponding centers.
Number Letter
Pseudotorsional
angle Number Letter
Pseudotorsional angle η θ η θ 1 A 168.7 221.4 13 M 203.8 307.5 2 B 169.1 205.7 14 N 92.5 232.2 3 C 167.3 235.1 15 O 69.6 153.8 4 D 169.4 179.5 16 P 310.6 220.1 5 E 163.7 257.1 17 Q 162.5 1.4 6 F 139.7 216.6 18 R 248.7 218.9 7 G 194.1 227.2 19 S 318.9 127.7 8 H 173.3 125.9 20 T 299.4 3.2 9 I 208.5 167.9 21 V 88.3 292.5 10 J 23.1 228.9 22 W 48.3 52.5 11 K 229.4 104.9 23 X 5.9 314.3 12 L 179.8 71.4
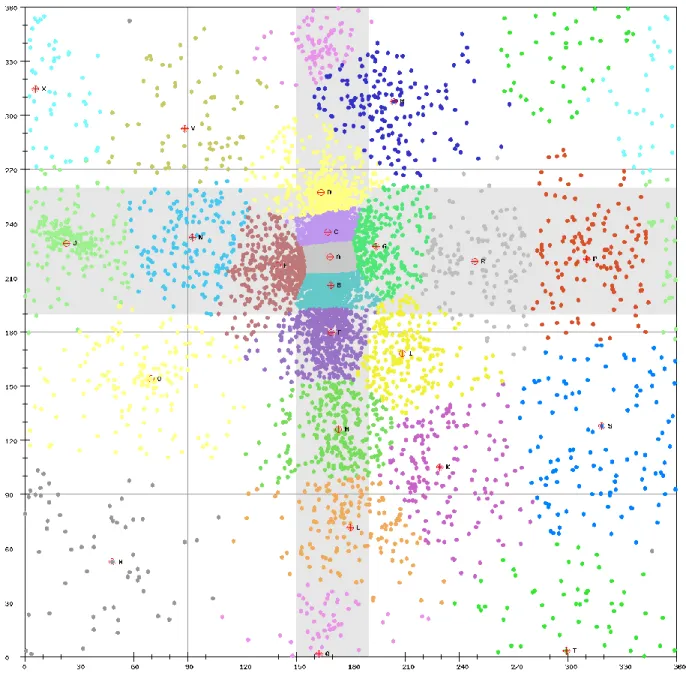
Figure 2-3. The ε-ζ scatter plot with 23 clusters differentiated by different
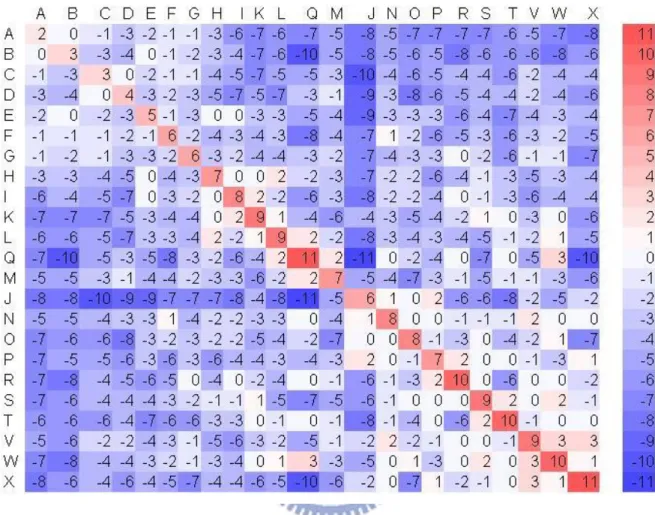
2.3 BLOSUM-Like Scoring Matrices
For the accuracy of alignment, we derived a 23 × 23 scoring matrix in which every possible identity and substitution, say A aligned with B, is assigned a score, denoted by score(A, B). Therefore, we constructed a log-odds matrix for SA-letter substitution using the statistical method that was used by Henikoff and Henikoff [13] to derive the BLOSUM family of substitution matrices as follows. Denote by {a1, a2, …, a23} the structural
alphabet of 23 SA letters, and let fij be the total number of SA-letter pair (ai,
aj). Then the observed probability qij of an SA-letter pair (ai, aj) is
23 1 1 k k l kl ij ij f fq . The background probability of occurrence of SA letter ai
in an SA-letter pair (ai, aj) is 2 23 , 1
k k i ik ii ij q qp . The expected probability
eij for a substitution of an SA-letter pair (ai, aj) is then pipj for i = j and pipj +
pjpi = 2pipj for i ≠ j. Finally, the logarithm of the odds matrix is calculated by
score(ai, aj) = ij ij e q 2 log
, where λ is a positive scale factor.
For the purpose of constructing this BLOSUM-like matrix, a standard training dataset is indispensable. There are two parts in our training dataset. First, a set of structurally similar RNA motif pairs was obtained from the SCOR database [15][23] based on the following criteria: (1) motifs must
belong to a structural family, (2) motifs must have length > 3 nt, (3) motifs must have specified starting and ending positions in the chain, and (4) motif pairs must have no 100% sequence identity. Second, another dataset was obtained from the DARTS database [1], which selected 244 representative structures from 1,333 high-resolution RNA 3D structures based on RNA sequence and 3D structure resemblances and then marked each of the remaining structures as either a highly identical structures or a highly identical fragment of a representative structure. A highly identical structure is defined as a structure that is globally almost identical (i.e., with at least 90% sequence or 3D structure identity) to some other structure of similar size (i.e., size ratio is between 1 and 1.5), while a highly identical fragment is defined as a structure that is almost identical to only a small substructure of a larger structure (i.e., size ratio is greater than 1.5). Note that 101 out of 244 representative structures have no highly identical structure. For our purpose, we used only the remaining 179 representative structures and their highly identical structures to construct our BLOSUM-like matrix. In total, there are 6,220 RNA motif pairs from 334 motif families (426,761 RNA structure motif pairs from 155 SCOR classes of 5,365 structural motifs and 3,867 RNA structure alignment pairs form 179 DARTS groups of 855 high-resolution RNA 3D structures), which account for 5,430,416 SA-letter pairs. The λ value used in this study was set to 1.6 for the best performance, by testing various values ranging from 1 to 2. Finally, we derived the BLOSUM-like scoring matrix as shown in Figure 2-4.
Figure 2-4. BLOSUM-like scoring matrix.
2.4 Sequence Alignment Algorithms
In this study, four different types of pairwise alignments, global, semiglobal, local and normalized local alignments were implemented in our web server for a variety of practical applications. Recall that the Smith-Waterman algorithm for the local alignment was originally designed to discard non-similar initial and terminal fragments in the sequence alignment, but it
was not able to exclude non-similar internal fragments, leading to a so-called
mosaic effect by including poor internal fragments in a local alignment [21].
As was shown in Figure 2-5 for an illustration, if a region of negative score
−X is sandwiched between two regions scoring more than X, then the
Smith-Waterman algorithm will join these three regions into a single alignment that may not be biologically adequate. In fact, such a mosaic effect can be observed in the comparison of RNA tertiary structures, as was illustrated in our previous work [6].
Figure 2-5. A mosaic effect with an inclusion of a poor internal region in an
alignment (These picture is adapted from [2]).
To overcome the mosaic effect in local alignment, Arslan et al. [20] introduced the normalized local alignment problem that aims to find the subsequences, say I and J, of two given sequences that maximizes S(I, J)/(|I| + |J|) among all subsequences I and J with |I| + |J| ≥ T, where S(I, J) is the alignment score between I and J, and T is a threshold for the minimal overall length of I and J. Note that the above length constraint of requiring |I|+|J| ≥
alignment should be sufficiently long to be biologically meaningful. It should be noted that the long alignment has higher ordinary score, whereas the short alignment has higher normalized score. Hence, if we use ordinary scores as the similarity measure, then the long alignment with a non-similar internal fragment will be chosen as an optimal local alignment. However, if we use normalized scores instead, then the alignment to be chosen will depend on the value of T. According to this polynomial-time algorithm, we have implemented such an algorithm for the normalized local alignment of the SA-encoded sequences of two RNA 3D structures.
Chapter 3
Implementation of Software Tool
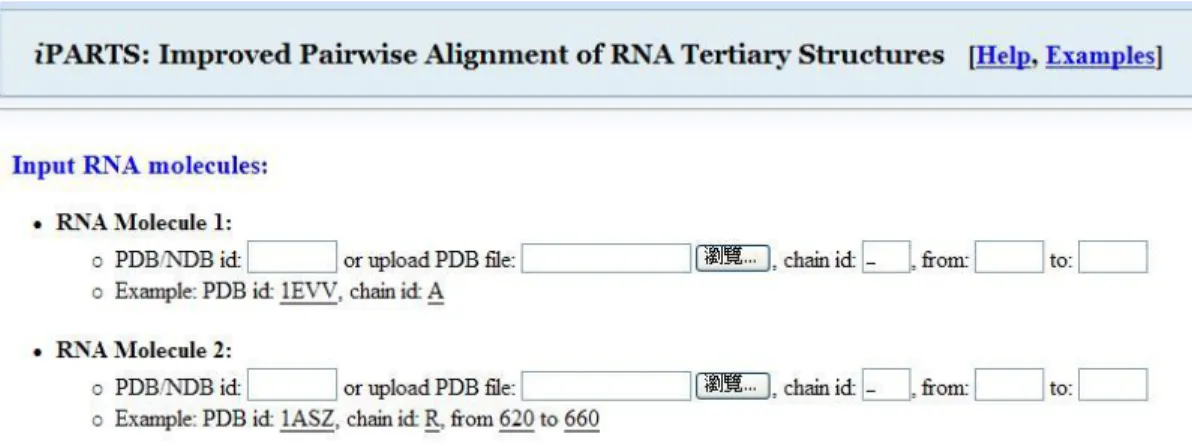
Based on the SA-based approach described in the previous chapter, we have developed a web-based tool, called iPARTS (short for Improved Pairwise Alignment for RNA Tertiary Structures), which provides pairwise alignment of RNA tertiary structures. In the following, we will describe the details of how to use iPARTS, respectively.
3.1 Input of iPARTS
iPARTS (refer to Figure 3-1) allows the user to compare two RNA 3D
structures by performing global, semiglobal, local, and normalized local alignments. Below, we describe the details of its usage step by step.
1. Enter the PDB/NDB id (4-/6-character code) or upload the file in the PDB format, as well as its chain id and starting and ending residue numbers in sequence, for RNA molecule 1. Note that PDB/NDB id or
uploading the file is mandatory, and others are optional but the user has to specify a chain id, if the given RNA molecule has multiple chains.
2. Enter the PDB/NDB id (4-/6-character code) or upload the file in the PDB format, as well as its chain id and starting and ending residue numbers in sequence, for RNA molecule 2. Note that PDB/NDB id or uploading the file is mandatory, and others are optional but the user has to specify a chain id, if the given RNA molecule has multiple chains.
3. Just click "Run iPARTS" button, if the user would like to run iPARTS with default parameters; otherwise, the user continues with the following parameter settings.
4. Select a pairwise alignment that can be either global, semiglobal, local, or normalized local alignment.
5. Key in two real values for gap open penalty and gap extension penalty, respectively, since the iPARTS penalizes the gaps using the affine gap penalty function.
Figure 3-1. Interface of iPARTS.
7. Specify the number of suboptimal alignments (at least 1), if the user choose semiglobal, local or normalized local alignment to run
iPARTS.
8. Specify the value of T whose default is 8, if the used alignment is a normalized local alignment. Basically, if T is small, then obtained normalized local alignments tend to be short; otherwise, they tend to be long normalized local alignments, in which may contain some non-similar internal fragments.
3.2 Output of iPARTS
In the output page as shown in Figure 3-2, iPARTS will first show the details of input RNA molecules, as well as user-specified parameters. Next, iPARTS will show its alignment result(s), including alignment score based on the pre-defined scoring matrix, RMSD (root mean square deviation), and detailed alignment of SA-encoded sequences and its corresponding alignment for original RNA sequences. In addition, the user can click the "Superposition display" link to visually view, rotate and enlarge the 3D structures of input RNAs and the superposition of their aligned 3D structures in a Jmol window.
Chapter 4
Results and Discussions
In this chapter, we will discuss the features of the ε-ζ plot and describe some experimental results we obtained by testing our iPARTS on representative datasets of RNA 3D structures. In addition, we will compare our testing results of pairwise global and semiglobal structural alignments to those results obtained by using PARTS. Unless otherwise specified, all the experiments were run using our iPARTS, as well as PARTS, with their default parameters.
4.1 Features and Clustering of the η – θ Plot
The ε and ζ angles of all non-terminal nucleotides within the dataset of our selected RNA 3D structures (see Materials and Methods) were plotted on two dimensions as shown in Figure 2-2. On this ε-ζ plot, as was also illustrated in [10], a particularly distinct grouping of nucleotides with similar
the intersection of the two perpendicular gray bars. Notably, most nucleotides (over 60%) found in this area are within helical structures, indicating that a great lot of RNA crystal and NMR structures to date have been determined on molecules that are helices or composed essentially of helices. In addition to the helical region, there are several regions on this η-θ plot that can be identified visually.
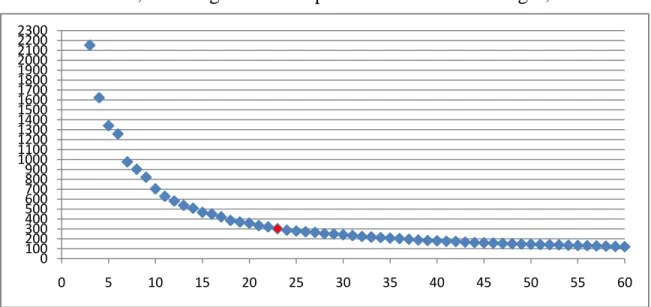
Here, we applied the AP clustering method (see Materials and Methods) to all the non-terminal nucleotides on the ε-ζ plot to properly define regions with greater accuracy. Finally, 9267 non-terminal nucleotides in the ε-ζ plot were classified into 23 conformation clusters, as was illustrated in Figure 2-3. In our study, we have tried the different numbers of clusters from 3 to 60. In Figure 4-1, it shows a plot of average error as a function of each different number of clusters. The average error reaches a plateau value for the number of clusters ≈ 46, meaning that the improvement of error is slight, when
Figure 4-1. Average error as a function of the number of clusters.
0 100 200 300 400 500 600 700 800 900 1000 1100 1200 1300 1400 1500 1600 1700 1800 1900 2000 2100 2200 2300 0 5 10 15 20 25 30 35 40 45 50 55 60
further increasing the number of clusters. However, in this study, we chose the 23 as the number of the clusters on the ε-ζ plot rather than 46. The reason is as follows. Over 60% of nucleotides on this plot fall within the helical region (defined by the intersection of the two perpendicular gray bars in Figure 2-2). If we select the 46 as the number, the helical region will be partitioned into more than 10 clusters, an overpartitioning in this region. This overpartitioning results was actually due to the fact that the helical region is so highly dense in the dataset of currently collected RNA structures such that any clustering algorithm may tend to divide it into a lot of clusters. In reality, according to our experiments (data not shown), the value of the AUC obtained using our testing dataset with 46 is not better than 23. In addition, choosing 23 clusters will permits one to apply BLAST, the most widely used tool of sequence homology search, for efficiently performing the structurally similar search on the database consisting of the SA-encoded sequences of RNA 3D structures.
As was shown in Figure 2-3, many clusters have either helical ε or helical ζ values (that is, in the gray highlighted areas). These clusters, as was pointed out by Wadley et al. [24], mostly contains C3'-endo nucleotides, while others contain C2'-endo nucleotides. That is, very few C2'-endo nucleotides resides in the helical region. Intriguingly, some of the clusters in Figure 2-3, such as Q, J, F, D, P, D, H, X, M, O, I and K, correspond directly to those previously identified in [24], whereas others are new. Specifically, the helical region was partitioned nearly four clusters (i.e., clusters A, B, C
and D), which contrasts remarkably with the result obtained by Wadley et al. [24] in which this helical region was considered as a single cluster because this region could not be dissected with a high degree of confidence using the analysis of window function. The 3D conformations of 23 exemplar nucleotides are shown in Figure 4-2.
Figure 4-2. The 3D conformation of 23 exemplar nucleotides: The exemplar
nucleotides are shown in green, whereas the portions of the previous and next nucleotides that affect the pseudotorsions are shown in blue.
4.2 Comparison with PARTS
After encoding two RNA 3D structures as two SA-encoded 1D sequences, we can quickly determine their structural similarity using classical methods of pairwise sequence alignments. In this study, based on this SA-based approach, we have implemented a novel web server, named iPARTS (improved Pairwise Alignment of RNA Tertiary Structures), for pairwise alignment of RNA tertiary structures. For a variety of practical applications, we have implemented four different types of pairwise alignments in iPARTS: (1) global alignment for comparing whole structural similarity, (2) semiglobal alignment for detecting structural motifs, (3) local alignment for finding locally similar substructures, and (4) normalized local alignments for eliminating the mosaic effect of local alignment, that is, removing poor internal fragments in a local alignment (see Materials and Methods).
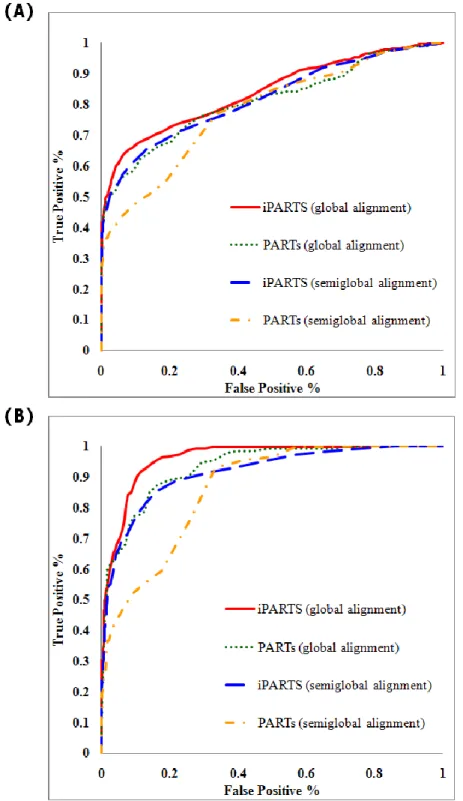
To assess the accuracy of our iPARTS, we calculated its receiver operating characteristic (ROC) curves, depicting the trade-off between true positive rate (i.e., sensitivity) and false positive rate (i.e., 1 minus specificity), and compared them with the ROC curves of our previous PARTS. For this purpose, we prepared two filtered and non-redundant datasets. One consists of 60 families and altogether 193 RNA structures. Another consists of 27 families and altogether 86 RNA structures. Both of them are from the SCOR database (version 2.0.3, October 2004) [15][23],
which currently organizes many RNA structural motifs in a hierarchical classification system similar to the SCOP database for protein domains [18]. These testing datasets were obtained from a total of 544 PDB files with 869 RNA chains that were classified into 212 families by their functions. By only removing sequence redundancy at 95% identity, we obtained the first testing dataset (dataset 1). In addition, we further partitioned each family in dataset 1 into several sub-families according to the structural similarity, then removed the sub-families with only one single RNA structure, and finally we obtained the second dataset (dataset 2). According to these two testing datasets, we computed the ROC curves using the global and semiglobal alignments of iPARTS and PARTS. As illustrated in Figure 4-3(A) for dataset 1, the ROC curve obtained using the global or semiglobal alignment of iPARTS performed better than that obtained of PARTS, where the AUCs (area under ROC curve) of the former ROCs curve are 0.84 and 0.81 respectively, while the AUCs of the latter are 0.81 and 0.78 respectively. In figure 4-3(B) for dataset 2, the ROC curve obtained using the global (respectively, semiglobal) alignment of iPARTS performed better than that obtained using the global (respectively, semiglobal) alignment of PARTS, where the AUC is 0.96 (respectively, 0.91), while the AUC of the latter is just 0.93 (respectively, 0.86). These experimental results demonstrate that our iPARTS indeed outperforms its previous version PARTS.
Figure 4-3. The ROC curves when using the global and semiglobal
alignment of iPARTS and PARTS to align RNA structural from the SCOR database . (A) The results of the testing dataset 1. (B) The results of the
Chapter 5
Conclusions
In this study, we have improved the accuracy of our previous structural alphabet-based algorithm for aligning two RNA 3D structures by using the two pseudotorsion angles of RNA nucleotide backbones, and the affinity propagation clustering approach for the construction of structural alphabet. Based on this improved algorithm, we have implemented a novel web server iPARTS that allows the users to perform pairwise alignment of two RNA 3D structures. According to our experiments, this new iPARTS indeed outperforms its previous PARTS, which in turn has been shown previously to outperform other existing tool DIAL, without compromising the computational efficiency. Therefore, we believe that our iPARTS can serve as a useful tool in the study of structural biology.
In addition, according to the results of our experiments, the new structure alphabet we derived in this study can indeed represent the RNA backbone structures. Therefore, we would like to develop a novel searching tool for similar RNA 3D structure based on this structure alphabet-based strategy as our future work. We can apply this method to transform all RNA
structures into structural alphabet sequences and use the powerful sequence searching tool BLAST as kernel to find out the RNAs with similar structural alphabet sequences to that of the query RNA.
References
[1] Abraham, M., Dror, O., Nussinov, R., Wolfson, H.J. (2008) Analysis and classification of RNA tertiary structures. RNA, 14, 2274-2289.
[2] Arslan, A.N., E˘gecio˘glu, O., and Pevzner, P.A. (2001) A new approach to sequence comparison: normalized sequence alignment.
Bioinformatics, 17, 327–337.
[3] Bekaert,M., Bidou,L., Denise,A., Duchateau-Nguyen,G., Forest,J., Froidevaux,C., Hatin,I., Rousset,J. and Termier, M. (2003) Towards a
computational model for 1 eukaryotic frameshifting sites.
Bioinformatics, 19, 327–335.
[4] Berman, H. M., Westbrook, J., Feng, Z., Gilliland, G., Bhat, T. N., Weissig, H., Shindyalov, I. N., and Bourne, P. E. (2000) The protein data bank. Nucleic Acids Research, 28, 235–242.
[5] Capriotti, E. and Marti-Renom, M.A. (2008) RNA structure alignment by a unit-vector approach. Bioinformatics, 24, i112-i118.
[6] Chang,Y.F., Huang,Y.L. and Lu,C.L. (2008) SARSA: a web tool for structural alignment of RNA using a structural alphabet. Nucleic Acids
Research, 36, W19–W24.
constant-factor approximation algorithm for the k-median problem.
Journal of Computer and System Sciences, 65, 129–149.
[8] Dror, O., Nussinov, R., and Wolfson, H. (2005) ARTS: alignment of RNA tertiary structures. Bioinformatics, 21 Suppl. 2, 47–53.
[9] Dror, O., Nussinov, R., and Wolfson, H. J. (2006) The ARTS web server for aligning RNA tertiary structures. Nucleic Acids Research, 34, W412–W415.
[10] Duarte, C.M., Pyle, A.M. (1998) Stepping through an RNA structure: A novel approach to conformational analysis. Journal of Molecular
Biology, 284, 1465-78.
[11] Eddy, S. R. (2001) Non-coding RNA genes and the modern RNA world.
Nature Reviews Genetics, 2, 919–929.
[12] Ferr`e, F., Ponty, Y., Lorenz, W. A., and Clote, P. (2007) DIAL: a web server for the pairwise alignment of two RNA three-dimensional structures using nucleotide, dihedral angle and base-pairing similarities.
Nucleic Acids Research, 35, W659–W668.
[13] Frey, B.J. and Dueck, D. (2007) Clustering by passing messages between data points. Science, 315, 972-976.
matrices from protein blocks. Proceedings of the National Academy of
Sciences of the United States of America, 89, 10915–10919.
[15] Klosterman, P.S., Tamura, M., Holbrook, S.R. and Brenner, S.E. (2002) SCOR: a structural classification of RNA database. Nucleic Acids
Research, 30, 392–394.
[16] Kolodny, R. and Linial, N. (2004) Approximate protein structural alignment in polynomial time. Proceedings of the National Academy of
Sciences of the United States of America, 101, 12201–12206.
[17] Lim,L., Glasner,M., Yekta,S., Burge,C. and Bartel, D. (2003) Vertebrate microRNA genes. Science, 299, 1540.
[18] Murzin, A.G., Brenner, S.E., Hubbard, T. and Chothia, C. (1995) SCOP: a structural classification of proteins database for the investigation of sequences and structures. Journal of Molecular Biology, 247, 536–540.
[19] Needleman, S. and Wunsch, C. (1970) A general method applicable to the search for similarities in the amino acid sequence of two proteins.
Journal of Molecular Evolution, 48, 443–453.
[20] Setubal, J. and Meidanis, J. (1997) Introduction to Computational
Molecular Biology, PWS Publishing Company.
molecular subsequences. Journal of Molecular Biology, 147, 195–197.
[22] Storz, G. (2002) An expanding universe of noncoding RNAs. Science, 296, 1260–1263.
[23] Tamura, M., Hendrix, D.K., Klosterman, P.S., Schimmelman, N.R., Brenner, S.E. and Holbrook, S.R. (2004) SCOR: structural classification of RNA, version 2.0. Nucleic Acids Research, 32, D182–D184.
[24] Wadley, L.M., Keating, K.S., Duarte, C.M., Pyle, A.M. (2007) Evaluating and learning from RNA pseudotorsional space: quantitative validation of a reduced representation for RNA structure. Journal of
Molecular Biology, 372,942-957.
[25] Xu,R. and Wunsch,D.,I. (2005) Survey of clustering algorithms. IEEE
![Figure 2-5. A mosaic effect with an inclusion of a poor internal region in an alignment (These picture is adapted from [2])](https://thumb-ap.123doks.com/thumbv2/9libinfo/8499136.185104/28.918.138.775.467.611/figure-mosaic-effect-inclusion-internal-alignment-picture-adapted.webp)