中國醫藥大學機構典藏 China Medical University Repository, Taiwan:Item 310903500/32485
75
0
0
全文
(2) 中文摘要 在 2009 年初,H1N1 流感疫情自墨西哥爆發並擴至全世界,因此 開發新型抑制劑來對抗此波疫情已是燃眉之急。在本研究中,我們使 用目前最新的 H1N1 序列以同源模擬法模擬出目前為止最新的 H1 與 N1 的蛋白質結構。由 Ramachandran 圖可知,在 H1 結構上僅有 1.28% 落於非合理角度構型的區域上;在 N1 結構上也僅有 3.4%。加上 Verify Score plot 判讀得知,H1 與 N1 的模擬結構有相當高的可信度。NCI 資料庫包含有 365,602 個已知結構的藥用化合物,在本研究中以虛擬 篩 選 的 方 式 由 其 中 選 出 具 有 潛 力 的 化 合 物 ︰ NCI0624650, NCI0607158,. NCI0605741,. PROTOVERINE,. NCI0605737. KANAMYCIN-C, NCI0608643, NCI0606258, and NCI0608650 等九 種。除此之外,新的 N1 結構在此虛擬平台上被發現對於 oseltamivir 具有抗藥性。另一方面我們也以 N2 與 N7 的蛋白質結構個別生成了 藥效基團的交互作用圖,並與 N1 的藥效基團假設做比對,在此研究 中探討了三者的差異,完成了混合型藥效基團模型。最後以此混合型 藥效基團模型用以篩選 NCI 資料庫,找出了六個可能成為廣效性 NA 抑制劑的候選化合物。我們的研究對於 H1N1 當前之疫情控制及未來 之疫情預防,都有指標性的貢獻。. 關鍵字: 關鍵字: H1N1,虛擬篩選,建構藥效基團假設,廣效性抑制劑. 1.
(3) Abstract An outbreak of H1N1 influenza in Mexico was occurred in 2009. To find out drugs for treating this epidemic is emergency. In this study, we have built the latest N1 and H1 structure model by homology modeling, which has high reliability by Verify Score plot. In Ramachandran plot, it shows only 1.28% and 3.4% out of the region of possible angle formations in N1 and H1 models, respectively. 365,602 compounds from NCI database have been screened by docking study of H1 and N1, respectively. And then, NCI0624650, NCI0607158, NCI0605741, PROTOVERINE,. NCI0605737. KANAMYCIN-C,. NCI0608643,. NCI0606258, and NCI0608650 were suggested as potent dual target candidates from the docking studies. Moreover, the latest N1 structure was found that have drug resistance to oseltamivir. Additionally, we have also created the interaction maps in the active sites on the neuraminidase type2, and type7 (N2 and N7) protein structures, aiming at creating the combined map for N1, N2, and N7 to resolve the difference in the three NA types. The combined map was employed to NCI database screening, and 6 candidates were found to be useful potent versatile inhibitors for N1, N2 and N7.. Key words s:. neuraminidase, virtual screening, pharmacophore. hypothesis generation (HyPoGen), versatile inhibitor. 2.
(4) 致謝 在碩士兩年的學習過程,隨著論文的付梓,即將劃上 句 點。本 論 文 能 順 利 完 成,幸 蒙 指 導 教 授 -陳 語 謙 老 師 的 指 導與教誨,對於研究的方向、觀念的啟迪、架構的匡正、 資料的提供與求學的態度逐一斧正與細細關懷,於此獻上 最深的敬意與謝意。論文口試期間,承蒙口試委員包大靝 老師與吳正男老師的鼓勵與疏漏處之指正,使得本論文更 臻完備,在此謹深致謝忱。在研究所修業期間,感謝鍾景 光 主 任 在 行 政 事 務 的 協 助 。 感謝蔡輔仁院長與蔡長海董事在實 驗上的支援。 感謝侯庭鏞老師在中草藥研究上的啟發、 感謝簡惠玲 老師指導論文的寫作以及徐媛曼老師在課業上的解惑,獲 益 良 多 。 紹 貴 學 長 在 學 業 與 實 驗 上 的 指 導 與泓縉學弟在實驗繁忙時的幫 忙協助,永 難 忘 懷。感 謝 國 家 高 速 網 路 計 算 中 心 提 供 高 速 計 算的環境,使本研究計算的資料庫篩選能夠順利完成。對 於所有幫助過我、關懷過我的人,致上由衷感謝。最後, 特將本文獻給我最敬愛的父母,感謝您無怨無悔的養育與 無時無刻的關懷照顧,以及在經濟上與精神上的支持,讓 我能專注於課業研究中,願以此與家人共享。. 3.
(5) 總目錄 摘要………………………………………………………………….…...1 摘要 Abstract……………………………………………………………….…2 致謝………………………………………………………....……………3 致謝 總目錄…………………………………………………………………....4 總目錄 表目錄.....................................……………………..………………....….5 表目錄 圖目錄............................................…………………………………........6 圖目錄 1.簡介(Introduction)………………………………………………….7 2.方法與材料(Material and methods)………..…………...……...…….10 2-1 資料設定(Dataset)……………………………………………10 2-2 建構藥效基團假設(Pharmacophore hypotheses generation, HyPoGen)……………………….……………………………10 2-3 NCI 資料庫之篩選(NCI database screening)…………13 2-4 分子對接分析(Molecular docking study)………………….….13 2-5 藥效基團交互作用關係之生成與比對(Interaction generation and pharmacophore comparison)………………………….. 17 3.結果與討論(Results and discussion)………………………...………18 3-1 同源模擬之結果(The results of homology modeling)……...18 3-2 藥效基團假設生成之結果(The results of pharmacophore hypotheses generation)….........................................................19 3-3 分子對接分析之結果(The results of docking study)...………20 3-4 N1, N2 與 N7 藥效基團比較分析之結果(Results of N1, N2, and N7 pharmacophore comparison analysis)…………………..23 4.結論(Conclusion)……………………………………………………24 5.參考文獻(References)........................................…………..…….........27 6.已發表之論文著作(Publications)…………………..………………...67 6-1 論文發表(Journal publications)….…………………….........67 6-2 研討會發表(Conference publications)……………………...72. 4.
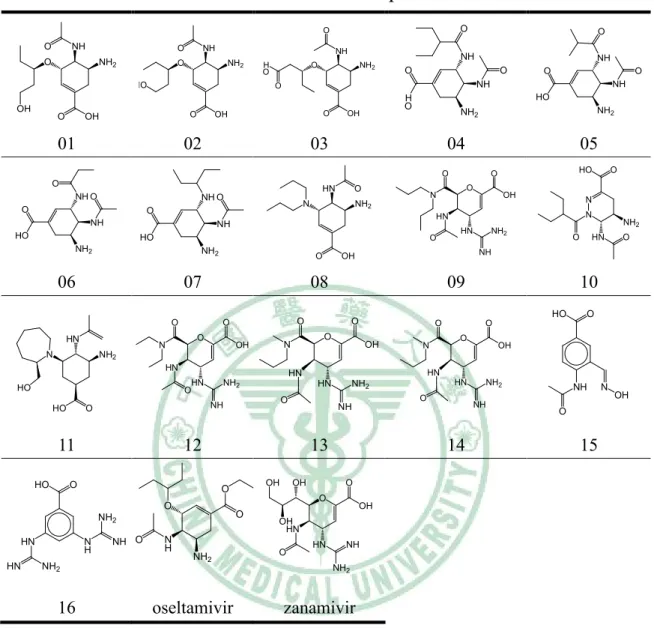
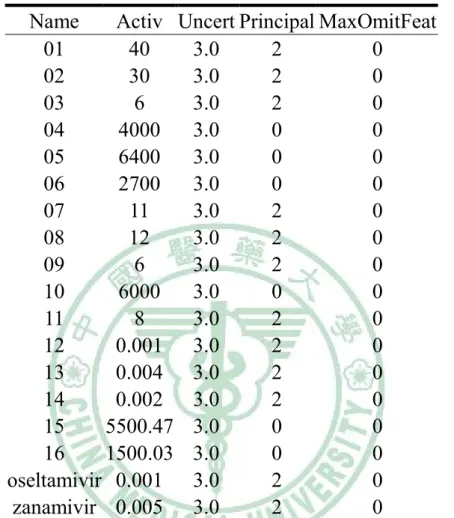
(6) 表目錄. Table 1. The structures of 18 compounds in data set…………......….…33 Table 2. The 18 compounds of data set…………………………..…….34 Table 3. Interaction types of PLP1……………...................……….…..35 Table 4. Parameters for PLP1 functional form.….....…..........................36 Table 5. Interaction types of PLP2…………………...................….…..37 Table 6. Parameters for PLP2 functional form........................................38 Table 7. The results of hypotheses generation………….……………....39 Table 8. The screening results of NCI database by Hypogen……….….40 Table 9. The screening results of NCI database by Hypogen (cont.)..…42 Table 10. The docking results of the fifty compounds with H1……..…43 Table 11. The docking results of the forty-six compounds with N1…....45 Table 12. Root-mean-squared error displacement (RMSD) in the results of comparison analysis………………………………………………...47 Table 13. The top 6 potent versatile inhibitors from NCI database….…48. 5.
(7) 圗目錄. Figure 1. Functional form of PLP1…...……………………………….…49 Figure 2. Functional forms of PLP2.…………………….……………….50 Figure 3. The result of H1 sequence alignment.………………..….....…..51 Figure 4. The results of N1 sequences alignment.….…………..………..52 Figure 5. The results of verify score plot of H1 homology modeling........53 Figure 6. The results of verify score plot of N1 homology modeling……54 Figure 7. Ramachandran plotting of H1 homology modeling result……..55 Figure 8. Ramachandran plotting of N1 homology modeling result……..56 Figure 9. The linear correlation of SAR…...……………………………..57 Figure 10. The features of hypotheses 1.………………............................58 Figure 11. The chemical structures of top 9 candidates……………….…59 Figure 12. The docking poses of 9 candidates in H1 and N1………...…..60 Figure 13. The pharmacophore analysis of H1…………………………..63 Figure 14. The interaction maps of N7 and N2…………………………64 Figure 15. The combined map was fit in the binding site of N1…………65 Figure 16. The structures of the 6 candidates from NCI database……….66. 6.
(8) 1. 簡介(Introduction) 簡介 The membranes of influenza virus contain haemagglutinin (HA) and neuraminidase (NA), they both are glycoproteins. Haemagglutinin has 16 subtypes (H1, H2, H3,…H16) and neuraminidase has 9 subtypes (N1, N2, N3,…N9). They assort the type of influenza A viruses (Mukhtar et al., 2007; Shirvan et al., 2007). Binding of cell-surface sialic acid receptor to initiate virus was mediates by HA, and sialic acid was removed from virus by NA. By the two steps, cellular glycoproteins improve virus releasing and the spread of infection to new cells, respectively (Raymond and Leach, 2007; Takabatake et al., 2007). To block haemagglutinin or neuraminidase also could prevent virus from invading into host cells (Russell et al., 2006; Shimbo et al., 2007). Zanamivir (Relenza) and oseltamivir (Tamiflu) both are neuraminidase inhibitors (Ho et al., 2007; Collins et al., 2008). Influenza A virus subtype H1N1 is the most common cause of influenza in human (Palese, 2004). Some strains of H1N1 are human endemic; such as the pandemic flu in 1918, 50-100 million people were killed worldwide (Kash et al., 2006; Kobasa et al., 2007). Less virulent H1N1 strains which roughly caused half of flu. 7.
(9) infections in 2006 has still existed (Cheung et al., 2002; Palese, 2004; Kash et al., 2006; Kobasa et al., 2007); other strains of H1N1 in swine and fowls are endemic. Since March 2009, an outbreak of H1N1 influenza in Mexico has led to hundreds of confirmed cases and a number of deaths. On April 28, the new strain was suspected the infection more than 2,500 individuals worldwide and 152 attributed deaths. The U.S. Centers for Disease Control and Prevention warned that the outbreak could be pandemic. On April 27, 2009, the World Health Organization raised their alertness level from 3 to 4 worldwide in response to sustain human-to-human transfer of the virus, and the situation was raised to level 5 on April 29. There is an urgent need to find the resolution for this international problem. Unfortunately, H1N1 virus was reported that has gained drug resistant for oseltamivir (Collins et al., 2008; Hauge et al., 2009; Moscona, 2009). Hence, a new emergent drug is needed to against this epidemic. In the past few years, many reports indicated that virtual screening techniques were feasible (Chen, 2008a,b,c,d; Chen, 2009a,b,c). In this study, we have built the H1 and N1 structure model by homology modeling. Homology modeling, hypothesis generation, and docking analysis were employed in our experiment for this research. A dual target. 8.
(10) research was carried out by the protocols for H1 and N1. 365,602 compounds from NCI database have been screened by docking study of H1 and N1, respectively. Additionally, we created the interaction maps in the active sites on the neuraminidase type2, and type7 (N2 and N7) protein structures. The structure-based pharmacophore map showed the features on every amino acid in the active site on the protein structure. By pharmacophore comparison, root-mean-squared error (RMSE) was reported for the matching pharmacophore features. We aimed at figuring out potent candidates for N1 and H1 for the 2009 outbreak of influenza A H1N1.. 9.
(11) 2. 方法與材料(Material and methods) 方法與材料 2-1 資料設定(Data set) 資料設定 All programs in this study were performed by Discovery Studio 2.0 (Accelrys, San Diego, CA, USA). The latest sequences of H1 and N1 were downloaded from NCBI influenza virus sequence database. The templates of H1 and N1 were downloaded from protein data bank (PDB). Their structures had been released in 2004 and 2006, respectively. (PDB ID: 1RD8 and 2HU0) (Stevens et al., 2004; Russell et al., 2006) The multiple sequence alignment method was based on the CLUSTAL W program and progressive pairwise alignment algorithm (Thompson et al., 1994). The alignment scoring matrix was set in BLOSM via default. We applied 1RD8 and 2HU0 to build the latest structure of the H1 and N1 sequence, respectively. The structures of 18 nureaminidase inhibitors were obtained from Lu’s study (Table 1) (Lu et al., 2008). The concentration of inhibitor that produces 50% inhibition of nureaminidase (IC50) was used in pharmacophore hypotheses and structure-activity relationship (SAR) study.. 2-2 建 構 藥 效 基 團 假 設 (Pharmacophore hypotheses generation, 10.
(12) HyPoGen) HyPoGen constructs pharmacophore hypotheses by using an informative training set that includes over 16 molecules with bioactivities. Accordingly, 18 compounds (Lu et al., 2008) were selected in training set for generating 10 pharmacophore hypotheses (Table 1 and 2). The hypotheses were accepted by those conditions: the null cost subtracted total cost was over 60, the configure value should be less than 17, and a high correlation between actual active values and fit values (Kurogi and Guner, 2001; Bersuker et al., 2000). HyPoGen was built by three steps: Constructive phase, Subtractive phase, and Optimization phase (Kurogi et al., 2001; Bersuker et al., 2000). In constructuive phase, the fixed hypothesis was built by the features of the most active compound. The maximum number of features were limited as 5. Other active compounds (principal = 2, Tabel 2.) were requested to satisfy following equation:. (MAct× UncMAct) − (Act / UncAct) > 0.0 ……………………………………….(1) MAct was the highest activ value in the data set. Unc was the uncert value. Act was the activ value in the data set (Table 2.). The features of compounds, which satisfied Eq. 1, were employed to develop pharmacophore hypotheses. In subtractive phase, the most inactive 11.
(13) compound was used to form a pharmacophore hypothesis. Other inactive compounds (principal = 0, Table 2.) were requested to satisfy following equation: log(Act ) − log(MAct) > 3.5 ………………..………………………………(2). The features of compounds, which satisfied Eq. 2, were employed to construct the null hypothesis. Those features were considered as factors decreasing activities of compounds and eliminated from pharmacophore hypothese. In optimization phase, HypoGen applies small perturbation to the pharmacophores created in constructive and subtractive phases in an attempt to improve the score. The steps includes selecting a new pharmacophore from the list of possibilities, rotating a vectored feature, translating a randomly selected feature in the pharmacophore, adding a new features, and removing a feature. For a particular hypothesis, the activities of compounds are estimated through the equation as following (Kurogi and Guner, 2001; Bersuker et al., 2000):. log(Estimatedactivity) = I + Fit …………………………………………(3) Where I is the intercept of the regression line, which is generated by plotting. The log of the biological activities of the data set molecules against the Fit values of them. The Fit values are estimated through the. 12.
(14) equation as following (Kurogi and Guner, 2001; Bersuker et al., 2000): 2 Fit = ∑ mapped hypothesis features × W 1 − ∑ (disp / tol ) ……………………(4). Where. ∑ mapped hypothesis features is the successfully superimposed. pharmacophore feature number, W is the weight of the corresponding hypothesis feature spheres, disp is the distance between the feature centroid and the center of the corresponding superimposed chemical moiety of the fitted molecule, tol is the radius of the pharmacophore feature sphere (tolerance, 1.6 Ǻ by default). The confidence level of 95% was generated from 19 random spreadsheets by Cat-Scramble program in each modeling run (Kurogi et al., 2001).. 2-3 NCI 資料庫之篩選(NCI database screening) 資料庫之篩選 NCI database was provided by National Center for High-performance Computing. The database included 365,602 compounds. We employed the first pharmacophore hypothesis to map and aligned the compounds from NCI database by the Catalyst compare/fit algorithm. The log of the biological activities of the data set molecules was against the Fit values. The Fit values are estimated by Eq. 4. Tolerance was set 1.6 Ǻ by default.. 2-4 分子對接分析(Molecular docking study) 分子對接分析 13.
(15) All of the compounds were built and energy minimized under MM2 force field by ChemOffice 2005. The LigandFit program performed the docking simulation at the binding site by Discovery Studio 2.0. During the docking procedure, ligands were flexible whereas the receptor was fixed. The ligand flexibility was carried out by In-Situ Ligand Minimization based on CHARMm force field. Docking score (D.S.) was employed to score the docking results. Candidate ligand poses are evaluated and prioritized according to the DockScore function. There are three types of DockScore. One is based on a forcefield approximation, another on the Piecewise Linear Potential function (PLP), and Potential of Mean Force (PMF). DockScore(forcefield) = - (ligand/receptor interaction energy + ligand internal energy)………………………………………………………...(5) As shown in Eq. 5, there are two energy terms in the forcefield version of DockScore, internal energy of the ligand and the interaction energy of the ligand with the receptor. The interaction energy is taken as the sum of the van der Waals energy and electrostatic energy. The computation of the interaction energy can be quite time consuming. To reduce the time needed for this calculation, a grid-based estimation of the 14.
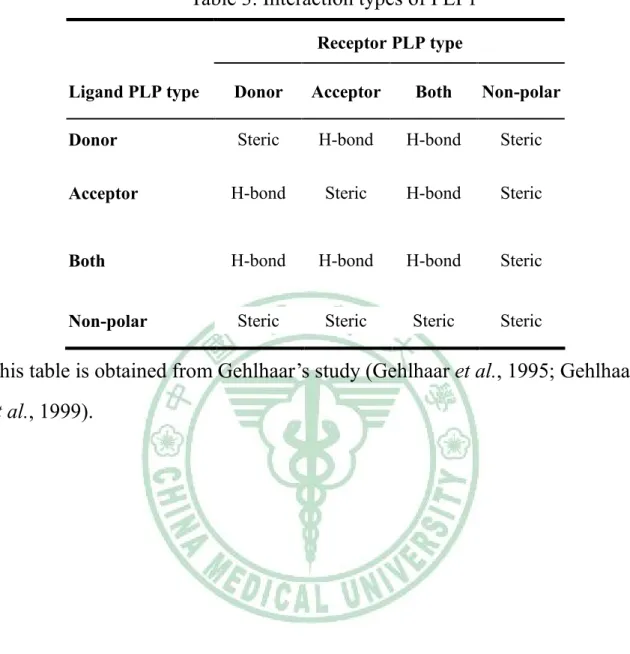
(16) ligand/receptor interaction energy is employed. Piecewise Linear Potential is a fast, simple, docking function that has been shown to correlate well with protein-ligand binding affinities. PLP scores are measured in arbitrary units, with negative PLP scores reported in order to make them suitable for subsequent use in consensus score calculations. DockScore(PLP) = - (PLPpotential)…………………………...………(6) Higher PLP scores indicate stronger receptor-ligand binding (larger pKi values). Two versions of the PLP function are available: PLP1 (Gehlhaar et al., 1995) and PLP2 (Gehlhaar et al., 1999). In the PLP1 function, each non-hydrogen ligand or non-hydrogen receptor atom is assigned a PLP atom type. Hydrogens are excluded from consideration. There are four PLP atom types: 1. Hydrogen bond (H-bond) donor only. 2. H-bond acceptor only. 3. Both H-bond donor and acceptor. Non-pola There are two types of pairwise interactions in PLP1 as shown in Table 3, namely H-bond and steric. The two interactions are described by the same functional form, but with different parameters 15.
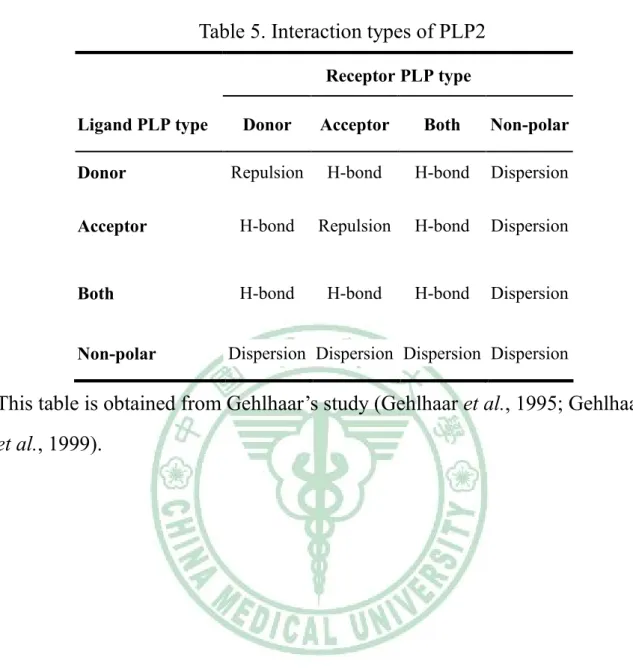
(17) (Figure 1 and Table 4). The PLP1 score is the sum of the function values of all pairwise interactions in a receptor-ligand complex. In the PLP2 function, PLP atom typing remains the same as in PLP1. In addition, an atomic radius is assigned to each atom except for hydrogen. There are three different radii: 1. Small: a value of 1.4 for F and metal ions (including Zn, Mn, Mg, and Fe). 2. Medium: a value of 1.8 for C, O, and N. 3. Large: a value of 2.2 for S, P, Cl, and Br. There are three types of pairwise interactions in PLP2 as shown in Table 5, namely H-bond, dispersion, and repulsion. There are two types of functional forms. The H-bond and dispersion interactions have the same functional form, but different parameters (Figure 2 and Table 6). A scaling factor is used for H-bond and repulsion terms based on the angle formed by the corresponding receptor-ligand atoms. The PLP2 score is the sum of the function values of all pairwise interactions in a receptor-ligand complex. The PMF scoring functions were developed based on statistical analysis of the 3D structures of protein-ligand complexes. They were 16.
(18) found to correlate well with protein-ligand binding free energies while being fast and simple to calculate. The scores are calculated by summing pairwise. interaction. terms. over. all. interatomic. pairs. of. the. receptor-ligand complex (Muegge and Martin, 1999). The PMF scores are reported in arbitrary units with the sign reversed to allow for subsequent use in consensus score calculations. A higher score indicates a stronger receptor-ligand binding affinity. Otherwise, the Consensus Score (CS) protocol calculates the consensus scores of a series of docked ligands for which other scores have been previously computed. For each selected scoring function, the ligands are listed by score in descending order. The consensus scores for each molecule were employed to be a view for ranking compounds (Teramoto and Fukunishi, 2008).. 2-5 藥效基團交互作用關係之生成與比對(Interaction generation and 藥效基團交互作用關係之生成與比對 pharmacophore comparison) The protocol enumerates pharmacophore features from a protein active site. It uses the de novo design method Ludi to create an interaction map in a protein active site. The information from the map is then converted. to. pharmacophore. features. 17. (acceptors,. donors,. and.
(19) hydrophobes). The density of lipophilic sites and density of polar sites were set 25 by default. The two pharmacophores are aligned by comparison analysis. The analysis uses the Catalyst Compare/fit algorithm to map and align two pharmacophores. Root-mean-squared error (RMSE) is reported for the matching pharmacophore features.. 3. 結果與討論(Results and discussion) 結果與討論 3-1 同源模擬之結果(The results of homology modeling) 同源模擬之結果 The result of alignment was reported in Figure 3 and 4. The sequence identity is 70.8% and similarity is 78.9% in H1. On the other hand, the sequence identity and similarity of N1 sequences were 91.4% and 95.6%, respectively. Accordingly, the alignment result was employed to build homology model. The reliable result of building homology model was performed by verified score and Ramachandran plot. (Figures 5-8) The results of verified score showed that few amino acid had low score (< 0) in H1 and N1 models (Figures 5 and 6). Because the amino acids didn’t locate at binding site, we thought that it could not affect the study. The Ramachandran Plot indicated low energy conformations for φ (phi) and ψ (psi), and the conventional terms represented the torsion angles on. 18.
(20) either side of alpha carbon in peptides. This plot was used to verify the predicted torsion angles in proteins. The result of Ramachandran plot showed only 1.28% error in H1 homology modeling and 3.4% in N1 homology modeling (Figures 7 and 8).. 3-2 藥效基團假設生成之結果(The results of pharmacophore 藥效基團假設生成之結果 hypotheses generation) The results showed that the configuration cost value less than 17 was 11.375, and the correlation was over 0.8, which indicated the reliability of hypotheses (Table 7). The correlation of the hypothesis 2 consisted with the hypothesis 1; accordingly, the pharmacohore map of the hypothesis 1 was elevated in next calculation. Generally, the error cost 40~60 meant that the confidence level was between 75~90%. In this investigation, the confidence level was 95% to accept the hypotheses. Otherwise, the actual activity of the first hypothesis had the highest correlation (0.88) among the 10 hypotheses, which suggested the first hypothesis reflect the actual activity by structure-activity relationship (SAR). The first hypothesis showed high correlation in Figure 9. Fit values could be predicted log active values by the linear correlation (Figure 9). R value about 0.88 was calculated via R2 = 0.7879 (Figure 9c). The first hypothesis was 19.
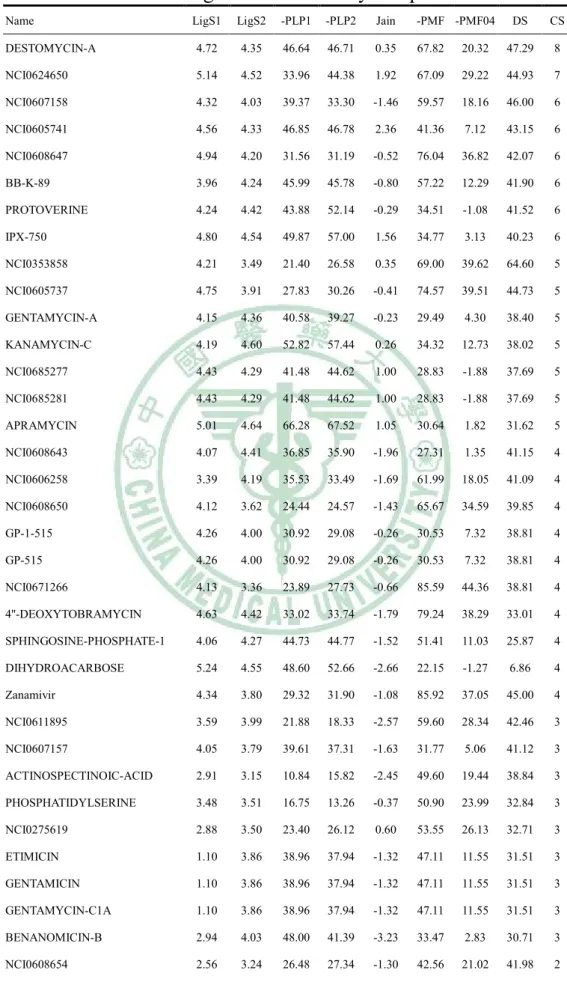
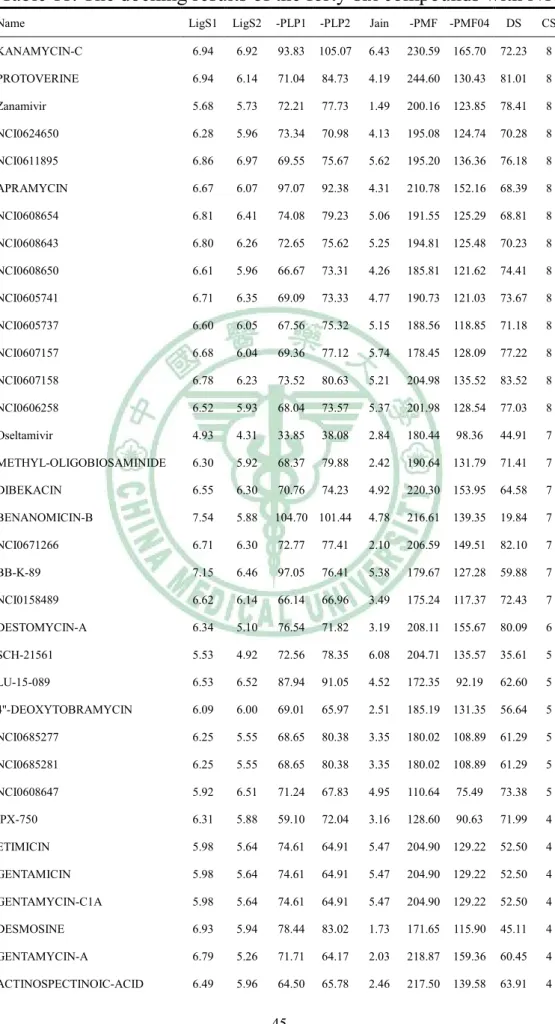
(21) constructed by two hydrogen bond acceptor features: one hydrogen bond donor feature, and one positive ionizable feature (Figure 10). The first hypothesis was consisted with the idea of designing NA inhibitor for improvement drugs activity in Shie’s study (Shie et al., 2008). Accordingly, the first hypothesis was employed to NCI database screening. The results were showed in Table 8 and Table 9.. 3-3 分子對接分析之結果( 分子對接分析之結果(The results of docking study) The compounds of NCI database were docked into H1 and N1 structures, respectively. The docking results of the fifty compounds with H1 were showed in Table 10. NCI0353858 had highest docking score, even higher than zanamivir and oseltamivir. In fact, zanamivir and oseltamivir were designed as inhibitors for NA. Although the results showed that zanamivir had some affinity for H1, there were many compounds. more. suitable. than. zanamivir,. like. NCI0353858,. DESTOMYCIN-A, and NCI0607158. In Table 11, zanamivir had 78.41 in docking score. That means zanamivir still had high activity for latest N1 in 2009. However, oseltamivir had 44.91 in docking score. In our previous study,. 20.
(22) oseltamivir had 53.3 in docking score for N1 in 2004. The latest N1 might have drug resistance to oseltamivir, and lower the docking score of oseltamivir, outstandingly. The results were consisted with many other reports (Collins et al., 2008; Hauge et al., 2009; Moscona, 2009). PROTOVERINE and NCI0607158 had higher docking score than zanamivir in Table 11. According above, NCI0607158 was suggested as potent dual target compound. There top 9 dual-target inhibitor candidates were selected form docking results by scoring functions: NCI0624650, NCI0607158,. NCI0605741,. PROTOVERINE,. NCI0605737. KANAMYCIN-C, NCI0608643, NCI0606258, and NCI0608650 (Figure 11). NCI0607158 was not only with docking score higher than zanamivir, but also with higher consensus score, too. We suggested that NCI0607158 might have high activity for in vitro study. The docking poses in H1 and N1 of 9 candidates were shown in Figure 12, respectively. In H1, the residuals of the binding site were like fingers to clutch the ligands by hydrogen bonds. The half-opened access shape of H1 binding site increased the difficulty for forming the ligand-pretein complex. The Table 10 showed that NCI0353858 had the highest docking score. The scores of Potential of mean force (PMF) of. 21.
(23) NCI0605737 and NCI0608647 were higher than 70 but the dock scores were less than 50 (Table 10). PMF was computed by summing pairwise interaction terms over all interatomic pairs of the receptor-ligand complex. According to PMF scores and docking scores, NCI0353858 was suggested as a potent inhibitor. In Figure 13, hydrogen bond acceptor features were located on ASN26, GLU38, and ASN59 (Figure 13a); besides, the hydrogen bond donor features were located on SER56, GLU38, and ASP58 (Figure 13a). The hydrophobic features didn’t centralize at the center of the binding site. NCI0353858 was formed with the 4 hydrogen bonds on LYS26, GLU38, ASP58, and ASN59 (Figure 13b). The results suggested that NCI0353858 should be a candidate for designing of H1 inhibitor. The first pharmacophore hypothesis developed by N1 was applied as criteria to screen NCI database. The 49 compounds were selected from the 365602 compounds by this protocol. In docking analysis, NCI0353858 which produced 4 hydrogen bonds in the ligand-protein complex was pointed out (Figure 13a and 13b). The structure of NCI0353858 was considered a lead compound for de novo drug design (Figure 13c). Considering to increasing the binding affinity for N1, the PLP. 22.
(24) score might play an important role in this study. PLP scores showed a trend with docking scores (Table 11). In our study, the major reason for decreasing binding affinity of oseltamivir in N1 that had low PLP score in the latest N1 structure. For improving binding affinity, extent the side chain for increasing positive charge may have effect. PROTOVERINE and NCI0607158 both had longer length than other 7 candidates (Figure 11).. 3-4 N1, N2 與 N7 藥效基團比較分析之結果(Results of N1, N2, and N7 藥效基團比較分析之結果 pharmacophore comparison analysis) In this result, the binding site of N2 and N7 both showed hydrophobic core (Figure 14a and 14b). However, the hydrophobic region in the binding site of N7 was deeper than in the binding site of N2. It was suggested that drug selectivity between N2 and N7 might be created by extent C-C bonds for moving the hydrophobic group on drugs into binding site in N7 structure. The yellow circles in Figure 2b labeled the major differences between N2 and N7 interaction maps. The mount of HBA features in N7 was more than that in N2 clearly. Over addition of HBA feature on NA inhibitors may cause the activity reducing in N7. The root-mean-squared error displacement (RMSD) was reported for the 23.
(25) matching pharmacophore features. The total RMSD of N1-N2 comparison analysis was 0.365, and the total RMSD of N1-N7 comparison analysis was 0.451. The major error occurred at the HBA features in the tow comparison results (Table 12). This difference was thought as the different amino acids on N1, N2, and N7 structures. We suggested that distances error between maps might cause different drug activities in N1, N2, and N7. This information was though to associate with drug resistance of influenza. Additionally, the compounds from NCI database were calculated of their fit values by pharmacopore mapping to the combining map and their average docking scores by docked into the three kinds of NA. The result was shown in Table 13. It was clearly observed that the top 6 potent compounds were shown in the binding site and fitted with the combined map (Figure 15). The structures of the top 6 potent compounds were shown in Figure 16.. 4. 結論(Conclusion) 結論 In this study, we have built the latest H1 and N1 structure model by homology modeling, which has high reliability by Verify Score plot and Ramachandran plot. 365,602 compounds from NCI database have been. 24.
(26) screened by docking study of H1 and N1, respectively. After the overall procedures presented in Fig. 1, NCI0624650, NCI0607158, NCI0605741, PROTOVERINE,. NCI0605737. KANAMYCIN-C,. NCI0608643,. NCI0606258, and NCI0608650 (Figure 11) were suggested potent dual target candidates. Moreover, the latest N1 structure might have drug resistance to oseltamivir; that maybe an alert for treatment H1N1 influenza. In N1, N2, and N7 pharmacophore comparison analysis, we brought up a proposal for design the versatile inhibitor of N1, N2, and N7 by combining ligand-based pharmacophore map and protein interaction maps. The ligand-based pharmacophore map was created from Lu’s study (Lu et al., 2008). Additionally, the map was consists with Shie’s study (Shie et al., 2008). Accordingly, the result was reliable. The protein-based pharmacophore maps were constructed by the protein structures of N2 and N7, using the protocol of interaction generation. By the protocol of pharmacophore comparison, the RMSD values between the three kinds of NA were calculated, then, the most matched map was elevated from the three maps. The most matched map was refined to form the combined map. The combined map fit Russell’s report (Russell et al., 2006). Based. 25.
(27) on this reason, the map was employed to virtual screening on NCI database. The screening results were analyzed by the ligandfit docking program. Six compounds were suggested as potent versatile inhibitors by their fit values and docking scores (Figure 16). We hope to put forward a constructive conception of designing H1N1 inhibitors.. 26.
(28) 5. 參考文獻(References) 參考文獻 Bersuker,. I.B.,. S.. Bahceci,. and. J.E.. Boggs,. “Improved. electron-conformational method of pharmacophore identification and bioactivity prediction. Application to angiotensin converting enzyme inhibitors,” J. Chem. Inf. Comput. Sci. 40, 1363 (2000). Chen, C. Y. C, “Discovery of novel inhibitors for c-Met by virtual screening and pharmacophore analysis,” J. Chin. Inst. Chem. Eng. 39, 617 (2008a). Chen, C. Y. C, “Inhibiting the vascular smooth muscle cells proliferation by EPC and DPPC liposomes encapsulated magnolol,” J. Chin. Inst. Chem. Eng. 39, 407 (2008b). Chen, C. Y. C. "Insights into the suanzaoren mechanism-From constructing the 3D structure of GABA-A receptor to its binding interaction analysis." J. Chin. Inst. Chem. Eng. 39, 663 (2008c). Chen, C. Y. C, “A novel perspective on designing the inhibitor of HER2 receptor,” J. Chin. Inst. Chem. Eng. 39, 291 (2008d).. 27.
(29) Chen, C. Y. C, “Chemoinformatics and pharmacoinformatics approach for exploring the GABA-A agonist from Chinese herb suanzaoren,” J. Chin. Inst. Chem. Eng. 40, 36 (2009a). Chen, C. Y. C, “De novo design of novel selective COX-2 inhibitors: From virtual screening to pharmacophore analysis,” J. Chin. Inst. Chem. Eng. 40, 55 (2009b). Chen, C. Y. C, “Pharmacoinformatics approach for mPGES-1 in anti-inflammation by 3D-QSAR pharmacophore mapping,” J. Chin. Inst. Chem. Eng. 40, 155 (2009c). Cheung, C. Y., L. L. Poon, A. S. Lau, W. Luk, Y. L. Lau, K. F. Shortridge, S. Gordon, Y. Guan, and J. S. Peiris, “Induction of proinflammatory cytokines in human macrophages by influenza A (H5N1) viruses: a mechanism for the unusual severity of human disease?” Lancet 360, 1831 (2002). Collins, P. J., L. F. Haire, Y. P. Lin, J. Liu, R. J. Russell, P. A. Walker, J. J. Skehel, S. R. Martin, A. J. Hay, and S. J. Gamblin, “Crystal structures of oseltamivir-resistant influenza virus neuraminidase mutants,” Nature 453, 1258 (2008).. 28.
(30) Gehlhaar, D. K., D. Bouzida, P. A. Rejto, “Rational Drug Design: Novel Methodology and Practical Applications ; Parrill, L.; Rami Reddy, M; Series title: ACS symposium series,” American Chemical Society 719, 292 (1999). Gehlhaar, D. K., G. M. Verkhivker, P. A. Rejto, C. J. Sherman, D. B. Fogel, L. J. Fogel, S. T. Freer, “Molecular Recognition of the Inhibitor AG-1343 by HIV-1 Protease: Conformationally Flexible Docking by Evolutionary Programming,” Chemistry & Biology 2, 317 (1995). Hauge, S. H., S. Dudman, K. Borgen, A. Lackenby, and O. Hungnes, “Oseltamivir-resistant influenza viruses A (H1N1), Norway, 2007-08,” Emerg. Infect. Dis. 15, 155 (2009). Ho, H. T., A. C. Hurt, J. Mosse, and I. Barr, “Neuraminidase inhibitor drug susceptibility differs between influenza N1 and N2 neuraminidase following mutagenesis of two conserved residues,” Antiviral. Res. 76, 263 (2007). Kash, J. C., T. M. Tumpey, S. C. Proll, V. Carter, O. Perwitasari, M. J. Thomas, C. F. Basler, P. Palese, J. K. Taubenberger, A. Garcia-Sastre, D. E. Swayne, and M. G. Katze, “Genomic analysis. 29.
(31) of increased host immune and cell death responses induced by 1918 influenza virus,” Nature 443, 578 (2006). Kobasa, D., S. M. Jones, K. Shinya, J. C. Kash, J. Copps, H. Ebihara, Y. Hatta, J. H. Kim, P. Halfmann, M. Hatta, F. Feldmann, J. B. Alimonti, L. Fernando, Y. Li, M. G. Katze, H. Feldmann, and Y. Kawaoka, “Aberrant innate immune response in lethal infection of macaques with the 1918 influenza virus,” Nature 445, 319 (2007). Kurogi,. Y.. and. O.F.. Guner,. “Pharmacophore. modeling. and. three-dimensional database searching for drug design using catalyst,” Curr. Med. Chem. 8, 1035 (2001). Kurogi, Y., K. Miyata, T. Okamura, K. Hashimoto, K. Tsutsumi, M. Nasu, and M. Moriyasu, “Discovery of novel mesangial cell proliferation inhibitors using a three-dimensional database searching method,” J. Med. Chem. 44, 2304 (2001). Lu, W.J., Y.L. Chen, W.P. Ma, X.Y. Zhang, F. Luan, M.C. Liu, X.G. Chen, and Z.D. Hu, “QSAR study of neuraminidase inhibitors based on heuristic method and radial basis function network,” Eur. J. Med. Chem. 43, 569 (2008).. 30.
(32) Moscona, A, “Global transmission of oseltamivir-resistant influenza,” N. Engl. J. Med. 360, 953 (2009). Muegge, I. and Y. C. Martin, “A General and Fast Scoring Function for Protein-Ligand Interactions: A Simplified Potential Approach,” J. Med. Chem. 42, 791 (1999). Mukhtar, M. M., S. T. Rasool, D. Song, C. Zhu, Q. Hao, Y. Zhu, and J. Wu, “Origin of highly pathogenic H5N1 avian influenza virus in China and genetic characterization of donor and recipient viruses,” J. Gen. Virol. 88, 3094 (2007). Palese, P, “Influenza: old and new threats,” Nat. Med. 10, S82 (2004). Raymond, L. W. and L. Leach, “Treatment of post-influenza pneumonia in health care workers,” J. Occup. Environ. Med. 49, 1181 (2007). Russell, R. J., L. F. Haire, D. J. Stevens, P. J. Collins, Y. P. Lin, G. M. Blackburn, A. J. Hay, S. J. Gamblin, and J. J. Skehel, “The structure of H5N1 avian influenza neuraminidase suggests new opportunities for drug design,” Nature 443, 45 (2006). Shie J. J., J. M, Fang, C.H. Wong, “A concise and flexible synthesis of the potent anti-influenza agents tamiflu and tamiphosphor,” Angew. Chem. Int. Ed. Engl. 47, 5788 (2008).. 31.
(33) Shimbo, T., M. Kawachi, K. Saga, H. Fujita, T. Yamazaki, K. Tamai, and Y. Kaneda, “Development of a transferrin receptor-targeting HVJ-E vector,” Biochem. Biophys. Res. Commun. 364, 423 (2007). Shirvan, A. N., M. Moradi, M. Aminian, and R. Madani, “Preparation of neuraminidase-specific antiserum from the H9N2 subtype of avian influenza virus,” Turk. J. Vet. Anim. Sci. 31, 219 (2007). Stevens, J., A. L. Corper, C.F. Basler, J. K. Taubenberger, P. Palese, I. A. Wilson, “Structure of the uncleaved human H1 hemagglutinin from the extinct 1918 influenza virus,” Science 303, 1866, (2004). Takabatake, N., M. Okamura, N. Yokoyama, K. Okubo, Y. Ikehara, and I. Igarashi, “Involvement of a host erythrocyte sialic acid content in Babesia bovis infection,” J. Vet. Med. Sci. 69, 999 (2007). Teramoto, R., and H. Fukunishi, “Consensus Scoring with Feature Selection for Structure-Based Virtual Screening” J. Chem. Inf. Model. 48, 288 (2008).. 32.
(34) Table 1. The structures of 18 compounds in data set. O. O. NH. O. NH. O. O. NH2. NH. O. NH2. HO. H O. NH. O. NH2. O. O. OH. 01. O. OH. 02. HO NH2. 04. 05. O. HN. NH O. NH O. NH. NH2. OH. 03. O O. O. O. NH H O. O. NH. O. O. OH. O. N. HO. O. N. OH. N. NH2. O. N. HN. NH. NH2. NH. HO. HN. HO. NH2. O. NH2. NH2. 06. O. 07. O. 09 O. O. O. O. HN. N. N. OH. OH. O. O O. N. OH. NH2 HN. HO. HO. NH2. O. OH. O. 14. OH. O O. O. OH. O. NH2 HN. N H. NH O. N H. NH2. 16. OH HN HN. NH2. NH. O NH2. oseltamivir. NH. NH. 13. zanamivir. 33. NH2. NH. N OH. O. O. 12. O. HN. NH2. HN. NH. 11. HN. HN HN O. HO. HN. O. 10 HO. O. O. HN. NH. OH. 08. O. N. O. O. O. O. 15.
(35) Table 2. The 18 compounds of data set. Name Activ Uncert Principal MaxOmitFeat 01 40 3.0 2 0 02 30 3.0 2 0 03 6 3.0 2 0 04 4000 3.0 0 0 05 6400 3.0 0 0 06 2700 3.0 0 0 07 11 3.0 2 0 08 12 3.0 2 0 09 6 3.0 2 0 10 6000 3.0 0 0 11 8 3.0 2 0 12 0.001 3.0 2 0 13 0.004 3.0 2 0 14 0.002 3.0 2 0 15 5500.47 3.0 0 0 16 1500.03 3.0 0 0 oseltamivir 0.001 3.0 2 0 zanamivir 0.005 3.0 2 0 Activ: It represented the compounds’ tested activities, which must be greater than 0.0. Uncert: It represented the ratio range of uncertainty in the activity value, set to 3.0 by default. Principal: It indicates whether the ligand was active (Principal= 2) or inactive (Principal= 0). MaxOmitFeat: It indicates how many features are allowed to miss for each molecule. By default, MaxOmitFeat was set to 0.. 34.
(36) Table 3. Interaction types of PLP1 Receptor PLP type Ligand PLP type. Donor. Acceptor. Both. Non-polar. Donor. Steric. H-bond. H-bond. Steric. Acceptor. H-bond. Steric. H-bond. Steric. Both. H-bond. H-bond. H-bond. Steric. Steric. Steric. Steric. Steric. Non-polar. This table is obtained from Gehlhaar’s study (Gehlhaar et al., 1995; Gehlhaar et al., 1999).. 35.
(37) Table 4. Parameters for PLP1 functional form Interaction type. A. B. C. D. E. F. H-bond. 2.3. 2.6. 3.1. 3.4. -2.0. 20.0. Steric. 3.4. 3.6. 4.5. 5.5. -0.4. 20.0. This data is obtained from Gehlhaar’s study (Gehlhaar et al., 1995; Gehlhaar et al., 1999).. 36.
(38) Table 5. Interaction types of PLP2 Receptor PLP type Ligand PLP type. Donor. Acceptor. Both. Non-polar. Repulsion. H-bond. H-bond. Dispersion. Acceptor. H-bond. Repulsion. H-bond. Dispersion. Both. H-bond. H-bond. H-bond. Dispersion. Donor. Non-polar. Dispersion Dispersion Dispersion Dispersion. This table is obtained from Gehlhaar’s study (Gehlhaar et al., 1995; Gehlhaar et al., 1999).. 37.
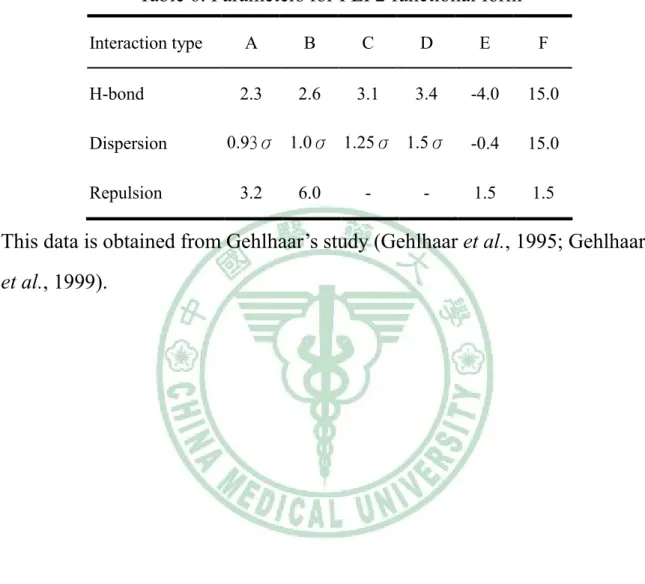
(39) Table 6. Parameters for PLP2 functional form Interaction type. A. B. C. D. E. F. H-bond. 2.3. 2.6. 3.1. 3.4. -4.0. 15.0. -0.4. 15.0. 1.5. 1.5. Dispersion Repulsion. 0.93σ 1.0σ 1.25σ 1.5σ 3.2. 6.0. -. -. This data is obtained from Gehlhaar’s study (Gehlhaar et al., 1995; Gehlhaar et al., 1999).. 38.
(40) Table 7. The results of hypotheses generation Hypo No. Total cost Error RMS Correlation. Features. 1. 137.95. 109.62 2.48. 0.888. HBA,HBA,HBD,POS. 2 3 4 5 6 7 8 9 10. 147.84 148.04 160.12 160.66 160.66 161.94 162.67 165.49 165.59. 116.57 118.88 135.89 132.58 125.63 132.74 137.30 135.14 133.63. 0.873 0.867 0.822 0.832 0.854 0.833 0.819 0.828 0.832. HBA,HBA,HBD,POS HBA,HBA,HBA,POS HBA,HBA,HBD,POS HBA,HBA,HBA,POS HBA,HBA,HBA,POS HBA,HBA,HBA,POS HBA,HBA,HBA,POS HBA,HBA,HBD,POS HBA,HBA,HBA,POS. 2.64 2.69 3.04 2.98 2.84 2.98 3.07 3.03 2.99. Null cost = 295.93, fixed cost = 69.68, configuration cost value = 11.375. HBA is hydrogen bond acceptor feature, HBD is hydrogen bond donor feature, and POS is positive ionizable feature.. 39.
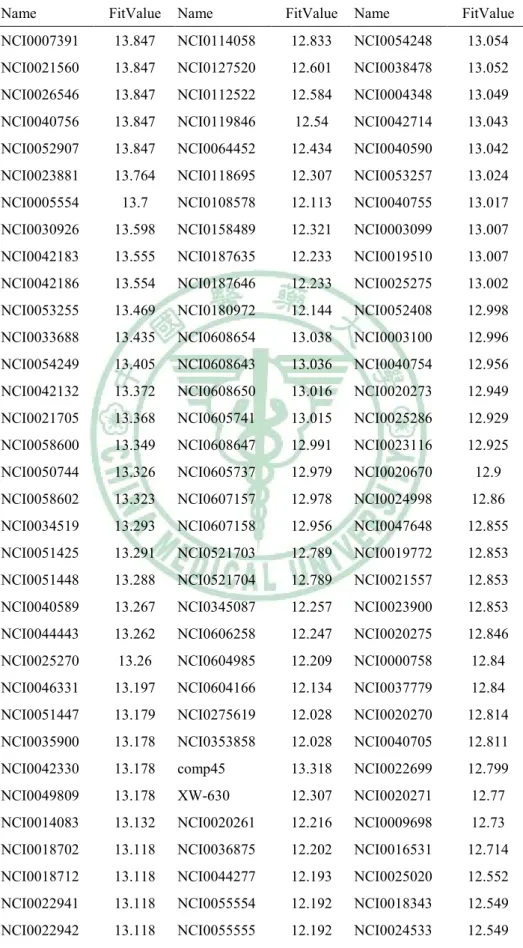
(41) Table 8. The screening results of NCI database by Hypogen. Name. FitValue. Name. FitValue. Name. FitValue. NCI0007391. 13.847. NCI0114058. 12.833. NCI0054248. 13.054. NCI0021560. 13.847. NCI0127520. 12.601. NCI0038478. 13.052. NCI0026546. 13.847. NCI0112522. 12.584. NCI0004348. 13.049. NCI0040756. 13.847. NCI0119846. 12.54. NCI0042714. 13.043. NCI0052907. 13.847. NCI0064452. 12.434. NCI0040590. 13.042. NCI0023881. 13.764. NCI0118695. 12.307. NCI0053257. 13.024. NCI0005554. 13.7. NCI0108578. 12.113. NCI0040755. 13.017. NCI0030926. 13.598. NCI0158489. 12.321. NCI0003099. 13.007. NCI0042183. 13.555. NCI0187635. 12.233. NCI0019510. 13.007. NCI0042186. 13.554. NCI0187646. 12.233. NCI0025275. 13.002. NCI0053255. 13.469. NCI0180972. 12.144. NCI0052408. 12.998. NCI0033688. 13.435. NCI0608654. 13.038. NCI0003100. 12.996. NCI0054249. 13.405. NCI0608643. 13.036. NCI0040754. 12.956. NCI0042132. 13.372. NCI0608650. 13.016. NCI0020273. 12.949. NCI0021705. 13.368. NCI0605741. 13.015. NCI0025286. 12.929. NCI0058600. 13.349. NCI0608647. 12.991. NCI0023116. 12.925. NCI0050744. 13.326. NCI0605737. 12.979. NCI0020670. 12.9. NCI0058602. 13.323. NCI0607157. 12.978. NCI0024998. 12.86. NCI0034519. 13.293. NCI0607158. 12.956. NCI0047648. 12.855. NCI0051425. 13.291. NCI0521703. 12.789. NCI0019772. 12.853. NCI0051448. 13.288. NCI0521704. 12.789. NCI0021557. 12.853. NCI0040589. 13.267. NCI0345087. 12.257. NCI0023900. 12.853. NCI0044443. 13.262. NCI0606258. 12.247. NCI0020275. 12.846. NCI0025270. 13.26. NCI0604985. 12.209. NCI0000758. 12.84. NCI0046331. 13.197. NCI0604166. 12.134. NCI0037779. 12.84. NCI0051447. 13.179. NCI0275619. 12.028. NCI0020270. 12.814. NCI0035900. 13.178. NCI0353858. 12.028. NCI0040705. 12.811. NCI0042330. 13.178. comp45. 13.318. NCI0022699. 12.799. NCI0049809. 13.178. XW-630. 12.307. NCI0020271. 12.77. NCI0014083. 13.132. NCI0020261. 12.216. NCI0009698. 12.73. NCI0018702. 13.118. NCI0036875. 12.202. NCI0016531. 12.714. NCI0018712. 13.118. NCI0044277. 12.193. NCI0025020. 12.552. NCI0022941. 13.118. NCI0055554. 12.192. NCI0018343. 12.549. NCI0022942. 13.118. NCI0055555. 12.192. NCI0024533. 12.549. 40.
(42) NCI0058595. 12.252. NCI0055560. 12.192. NCI0033298. 12.549. NCI0047461. 12.245. NCI0055561. 12.192. NCI0009629. 12.542. NCI0056714. 12.245. NCI0007290. 12.17. NCI0025962. 12.523. NCI0057034. 12.245. NCI0051451. 12.149. NCI0047151. 12.516. NCI0043891. 12.244. NCI0013252. 12.108. NCI0040586. 12.515. NCI0050352. 12.244. NCI0044180. 12.108. NCI0039358. 12.509. NCI0056711. 12.244. NCI0018757. 12.026. NCI0018695. 12.507. NCI0009130. 12.237. NCI0044283. 12.009. NCI0025274. 12.501. NCI0044181. 12.237. NCI0051812. 12.287. NCI0043417. 12.484. NCI0056275. 12.345. NCI0003055. 12.283. NCI0029431. 12.465. NCI0060439. 12.31. NCI0048600. 12.253. NCI0049798. 12.443. NCI0014659. 12.305. NCI0036314. 12.35. NCI0015771. 12.429. AC-983. 13.176. NCI0624650. 13.078. AC-984. 13.134. 41.
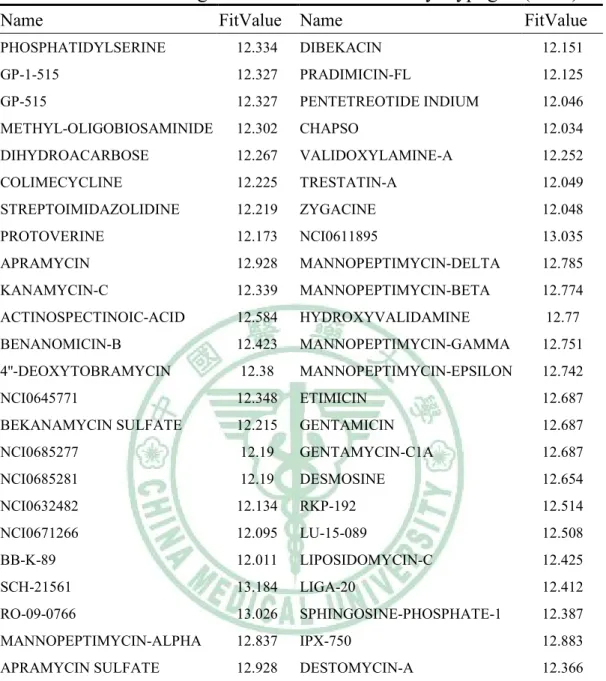
(43) Table 9. The screening results of NCI database by Hypogen (cont.). Name. FitValue. Name. FitValue. PHOSPHATIDYLSERINE. 12.334. DIBEKACIN. 12.151. GP-1-515. 12.327. PRADIMICIN-FL. 12.125. GP-515. 12.327. PENTETREOTIDE INDIUM. 12.046. METHYL-OLIGOBIOSAMINIDE. 12.302. CHAPSO. 12.034. DIHYDROACARBOSE. 12.267. VALIDOXYLAMINE-A. 12.252. COLIMECYCLINE. 12.225. TRESTATIN-A. 12.049. STREPTOIMIDAZOLIDINE. 12.219. ZYGACINE. 12.048. PROTOVERINE. 12.173. NCI0611895. 13.035. APRAMYCIN. 12.928. MANNOPEPTIMYCIN-DELTA. 12.785. KANAMYCIN-C. 12.339. MANNOPEPTIMYCIN-BETA. 12.774. ACTINOSPECTINOIC-ACID. 12.584. HYDROXYVALIDAMINE. 12.77. BENANOMICIN-B. 12.423. MANNOPEPTIMYCIN-GAMMA. 12.751. 4''-DEOXYTOBRAMYCIN. 12.38. MANNOPEPTIMYCIN-EPSILON. 12.742. NCI0645771. 12.348. ETIMICIN. 12.687. BEKANAMYCIN SULFATE. 12.215. GENTAMICIN. 12.687. NCI0685277. 12.19. GENTAMYCIN-C1A. 12.687. NCI0685281. 12.19. DESMOSINE. 12.654. NCI0632482. 12.134. RKP-192. 12.514. NCI0671266. 12.095. LU-15-089. 12.508. BB-K-89. 12.011. LIPOSIDOMYCIN-C. 12.425. SCH-21561. 13.184. LIGA-20. 12.412. RO-09-0766. 13.026. SPHINGOSINE-PHOSPHATE-1. 12.387. MANNOPEPTIMYCIN-ALPHA. 12.837. IPX-750. 12.883. APRAMYCIN SULFATE. 12.928. DESTOMYCIN-A. 12.366. 42.
(44) Table 10. The docking results of the fifty compounds with H1. Name. LigS1. LigS2. -PLP1. -PLP2. Jain. -PMF -PMF04. DS. CS. DESTOMYCIN-A. 4.72. 4.35. 46.64. 46.71. 0.35. 67.82. 20.32. 47.29. 8. NCI0624650. 5.14. 4.52. 33.96. 44.38. 1.92. 67.09. 29.22. 44.93. 7. NCI0607158. 4.32. 4.03. 39.37. 33.30. -1.46. 59.57. 18.16. 46.00. 6. NCI0605741. 4.56. 4.33. 46.85. 46.78. 2.36. 41.36. 7.12. 43.15. 6. NCI0608647. 4.94. 4.20. 31.56. 31.19. -0.52. 76.04. 36.82. 42.07. 6. BB-K-89. 3.96. 4.24. 45.99. 45.78. -0.80. 57.22. 12.29. 41.90. 6. PROTOVERINE. 4.24. 4.42. 43.88. 52.14. -0.29. 34.51. -1.08. 41.52. 6. IPX-750. 4.80. 4.54. 49.87. 57.00. 1.56. 34.77. 3.13. 40.23. 6. NCI0353858. 4.21. 3.49. 21.40. 26.58. 0.35. 69.00. 39.62. 64.60. 5. NCI0605737. 4.75. 3.91. 27.83. 30.26. -0.41. 74.57. 39.51. 44.73. 5. GENTAMYCIN-A. 4.15. 4.36. 40.58. 39.27. -0.23. 29.49. 4.30. 38.40. 5. KANAMYCIN-C. 4.19. 4.60. 52.82. 57.44. 0.26. 34.32. 12.73. 38.02. 5. NCI0685277. 4.43. 4.29. 41.48. 44.62. 1.00. 28.83. -1.88. 37.69. 5. NCI0685281. 4.43. 4.29. 41.48. 44.62. 1.00. 28.83. -1.88. 37.69. 5. APRAMYCIN. 5.01. 4.64. 66.28. 67.52. 1.05. 30.64. 1.82. 31.62. 5. NCI0608643. 4.07. 4.41. 36.85. 35.90. -1.96. 27.31. 1.35. 41.15. 4. NCI0606258. 3.39. 4.19. 35.53. 33.49. -1.69. 61.99. 18.05. 41.09. 4. NCI0608650. 4.12. 3.62. 24.44. 24.57. -1.43. 65.67. 34.59. 39.85. 4. GP-1-515. 4.26. 4.00. 30.92. 29.08. -0.26. 30.53. 7.32. 38.81. 4. GP-515. 4.26. 4.00. 30.92. 29.08. -0.26. 30.53. 7.32. 38.81. 4. NCI0671266. 4.13. 3.36. 23.89. 27.73. -0.66. 85.59. 44.36. 38.81. 4. 4''-DEOXYTOBRAMYCIN. 4.63. 4.42. 33.02. 33.74. -1.79. 79.24. 38.29. 33.01. 4. SPHINGOSINE-PHOSPHATE-1. 4.06. 4.27. 44.73. 44.77. -1.52. 51.41. 11.03. 25.87. 4. DIHYDROACARBOSE. 5.24. 4.55. 48.60. 52.66. -2.66. 22.15. -1.27. 6.86. 4. Zanamivir. 4.34. 3.80. 29.32. 31.90. -1.08. 85.92. 37.05. 45.00. 4. NCI0611895. 3.59. 3.99. 21.88. 18.33. -2.57. 59.60. 28.34. 42.46. 3. NCI0607157. 4.05. 3.79. 39.61. 37.31. -1.63. 31.77. 5.06. 41.12. 3. ACTINOSPECTINOIC-ACID. 2.91. 3.15. 10.84. 15.82. -2.45. 49.60. 19.44. 38.84. 3. PHOSPHATIDYLSERINE. 3.48. 3.51. 16.75. 13.26. -0.37. 50.90. 23.99. 32.84. 3. NCI0275619. 2.88. 3.50. 23.40. 26.12. 0.60. 53.55. 26.13. 32.71. 3. ETIMICIN. 1.10. 3.86. 38.96. 37.94. -1.32. 47.11. 11.55. 31.51. 3. GENTAMICIN. 1.10. 3.86. 38.96. 37.94. -1.32. 47.11. 11.55. 31.51. 3. GENTAMYCIN-C1A. 1.10. 3.86. 38.96. 37.94. -1.32. 47.11. 11.55. 31.51. 3. BENANOMICIN-B. 2.94. 4.03. 48.00. 41.39. -3.23. 33.47. 2.83. 30.71. 3. NCI0608654. 2.56. 3.24. 26.48. 27.34. -1.30. 42.56. 21.02. 41.98. 2. 43.
(45) METHYL-OLIGOBIOSAMINIDE. 3.12. 3.33. 27.05. 34.86. -1.21. 44.88. 25.47. 38.43. 2. DIBEKACIN. 2.55. 3.20. 21.82. 20.73. -3.97. 52.53. 15.62. 35.29. 2. HYDROXYVALIDAMINE. 3.18. 3.12. 13.78. 16.33. -1.14. 52.67. 26.77. 33.87. 2. Oseltamivir. 3.05. 3.99. 50.47. 46.67. -0.88. -6.35. -30.19. 23.90. 2. NCI0158489. 4.06. 3.90. 29.95. 34.48. -1.29. 37.31. 13.05. 39.63. 1. NCI0345087. 3.10. 3.41. 26.09. 29.65. -1.64. 37.33. 13.89. 24.72. 1. NCI0521703. 2.01. 3.79. 25.97. 23.76. -0.76. 26.03. -12.23. 24.67. 1. NCI0521704. 2.01. 3.79. 25.97. 23.76. -0.76. 26.03. -12.23. 24.67. 1. SCH-21561. 1.11. 2.86. 13.83. 12.37. -4.14. 40.90. 17.74. 24.23. 1. PRADIMICIN-FL. 3.55. 3.98. 37.29. 33.07. -5.95. 40.70. 8.46. 14.06. 1. DESMOSINE. 1.75. 3.38. 35.05. 27.79. -4.73. 17.63. -1.30. 34.04. 0. NCI0187635. -6.82. -11.83. -23.22. -12.94. -2.91. 38.35. 6.38. 26.00. 0. NCI0187646. -6.82. -11.83. -23.22. -12.94. -2.91. 38.35. 6.38. 26.00. 0. LU-15-089. 1.12. 3.35. 35.11. 33.51. -2.38. -9.65. -9.14. 25.60. 0. STREPTOIMIDAZOLIDINE. 1.46. 2.87. 15.22. 13.37. -6.45. 39.55. 11.67. 24.47. 0. DS : docking score; CS : consensus score.. 44.
(46) Table 11. The docking results of the forty-six compounds with N1. Name. LigS1. LigS2. -PLP1. -PLP2. Jain. -PMF -PMF04. DS. CS. KANAMYCIN-C. 6.94. 6.92. 93.83. 105.07. 6.43. 230.59. 165.70. 72.23. 8. PROTOVERINE. 6.94. 6.14. 71.04. 84.73. 4.19. 244.60. 130.43. 81.01. 8. Zanamivir. 5.68. 5.73. 72.21. 77.73. 1.49. 200.16. 123.85. 78.41. 8. NCI0624650. 6.28. 5.96. 73.34. 70.98. 4.13. 195.08. 124.74. 70.28. 8. NCI0611895. 6.86. 6.97. 69.55. 75.67. 5.62. 195.20. 136.36. 76.18. 8. APRAMYCIN. 6.67. 6.07. 97.07. 92.38. 4.31. 210.78. 152.16. 68.39. 8. NCI0608654. 6.81. 6.41. 74.08. 79.23. 5.06. 191.55. 125.29. 68.81. 8. NCI0608643. 6.80. 6.26. 72.65. 75.62. 5.25. 194.81. 125.48. 70.23. 8. NCI0608650. 6.61. 5.96. 66.67. 73.31. 4.26. 185.81. 121.62. 74.41. 8. NCI0605741. 6.71. 6.35. 69.09. 73.33. 4.77. 190.73. 121.03. 73.67. 8. NCI0605737. 6.60. 6.05. 67.56. 75.32. 5.15. 188.56. 118.85. 71.18. 8. NCI0607157. 6.68. 6.04. 69.36. 77.12. 5.74. 178.45. 128.09. 77.22. 8. NCI0607158. 6.78. 6.23. 73.52. 80.63. 5.21. 204.98. 135.52. 83.52. 8. NCI0606258. 6.52. 5.93. 68.04. 73.57. 5.37. 201.98. 128.54. 77.03. 8. Oseltamivir. 4.93. 4.31. 33.85. 38.08. 2.84. 180.44. 98.36. 44.91. 7. METHYL-OLIGOBIOSAMINIDE. 6.30. 5.92. 68.37. 79.88. 2.42. 190.64. 131.79. 71.41. 7. DIBEKACIN. 6.55. 6.30. 70.76. 74.23. 4.92. 220.30. 153.95. 64.58. 7. BENANOMICIN-B. 7.54. 5.88. 104.70 101.44. 4.78. 216.61. 139.35. 19.84. 7. NCI0671266. 6.71. 6.30. 72.77. 77.41. 2.10. 206.59. 149.51. 82.10. 7. BB-K-89. 7.15. 6.46. 97.05. 76.41. 5.38. 179.67. 127.28. 59.88. 7. NCI0158489. 6.62. 6.14. 66.14. 66.96. 3.49. 175.24. 117.37. 72.43. 7. DESTOMYCIN-A. 6.34. 5.10. 76.54. 71.82. 3.19. 208.11. 155.67. 80.09. 6. SCH-21561. 5.53. 4.92. 72.56. 78.35. 6.08. 204.71. 135.57. 35.61. 5. LU-15-089. 6.53. 6.52. 87.94. 91.05. 4.52. 172.35. 92.19. 62.60. 5. 4''-DEOXYTOBRAMYCIN. 6.09. 6.00. 69.01. 65.97. 2.51. 185.19. 131.35. 56.64. 5. NCI0685277. 6.25. 5.55. 68.65. 80.38. 3.35. 180.02. 108.89. 61.29. 5. NCI0685281. 6.25. 5.55. 68.65. 80.38. 3.35. 180.02. 108.89. 61.29. 5. NCI0608647. 5.92. 6.51. 71.24. 67.83. 4.95. 110.64. 75.49. 73.38. 5. IPX-750. 6.31. 5.88. 59.10. 72.04. 3.16. 128.60. 90.63. 71.99. 4. ETIMICIN. 5.98. 5.64. 74.61. 64.91. 5.47. 204.90. 129.22. 52.50. 4. GENTAMICIN. 5.98. 5.64. 74.61. 64.91. 5.47. 204.90. 129.22. 52.50. 4. GENTAMYCIN-C1A. 5.98. 5.64. 74.61. 64.91. 5.47. 204.90. 129.22. 52.50. 4. DESMOSINE. 6.93. 5.94. 78.44. 83.02. 1.73. 171.65. 115.90. 45.11. 4. GENTAMYCIN-A. 6.79. 5.26. 71.71. 64.17. 2.03. 218.87. 159.36. 60.45. 4. ACTINOSPECTINOIC-ACID. 6.49. 5.96. 64.50. 65.78. 2.46. 217.50. 139.58. 63.91. 4. 45.
(47) NCI0345087. 6.37. 5.83. 68.01. 65.70. 3.72. 165.36. 111.23. 58.00. 3. SPHINGOSINE-PHOSPHATE-1. 5.91. 4.95. 63.62. 73.98. -1.28. 180.82. 83.79. 53.95. 2. PHOSPHATIDYLSERINE. 5.57. 5.53. 47.51. 49.41. 4.05. 119.48. 82.96. 68.30. 2. NCI0521703. 5.37. 6.01. 46.60. 46.86. 4.40. 116.76. 95.14. 57.74. 2. NCI0521704. 5.37. 6.01. 46.60. 46.86. 4.40. 116.76. 95.14. 57.74. 2. HYDROXYVALIDAMINE. 5.41. 5.77. 58.93. 60.98. 4.48. 104.51. 67.53. 58.55. 1. NCI0275619. 4.41. 4.68. 40.72. 46.14. 3.24. 105.74. 71.61. 56.66. 1. GP-1-515. 5.27. 4.82. 34.81. 28.74. -0.14. 118.00. 94.03. 59.51. 0. GP-515. 5.27. 4.82. 34.81. 28.74. -0.14. 118.00. 94.03. 59.51. 0. NCI0187635. 3.96. 4.82. 49.58. 37.41. 1.12. 124.82. 79.27. 53.53. 0. NCI0187646. 3.96. 4.82. 49.58. 37.41. 1.12. 124.82. 79.27. 53.53. 0. DS : docking score; CS : consensus score.. 46.
(48) Table 12. Root-mean-squared error displacement (RMSD) in the results of comparison analysis. N1 N2. HBD. DonorPT1. HBA1. AcepterPT1. HBA2. AcepterPT2. location1.416 location1.415 location1.168 location1.167 location1.182 location1.181. RMSD N1-N2 N7 RMSD N1-N7. 0.220. 0.268. 0.520. 0.390. 0.306. 0.402. location1.420 location1.419 location1.336 location1.335 location1.252 location1.251 0.300. 0.280. 0.543. 47. 0.604. 0.298. 0.553.
(49) Table 13. The top 6 potent versatile inhibitors from NCI database. Name. dock score Fit value. NCI0054249. 129.058. 13.405. NCI0040590. 94.656. 13.042. NCI0051451. 83.849. 12.149. NCI0040589. 81.717. 13.267. NCI0054248. 81.579. 13.054. VALIDOXYLAMINE-A 80.407. 12.252. 48.
(50) Figure 1. Functional form of PLP1. This figure is obtained from Gehlhaar’s study (Gehlhaar et al., 1995; Gehlhaar et al., 1999).. 49.
(51) Figure 2. Functional forms of PLP2. (a) Pairwise potential for H-bond and dispersion terms. (b) Pairwise potential for repulsion terms. (c) Scaling factor for H-bond and repulsion terms based on the angle formed by the receptor and ligand atoms. This figure is obtained from Gehlhaar’s study (Gehlhaar et al., 1995; Gehlhaar et al., 1999).. 50.
(52) Figure 3. The result of H1 sequence alignment. The sequence identity and similarity between the latest H1 sequence and IRD8 are 70.8% and 78.9%, respectively.. 51.
(53) Figure 4. The results of N1 sequences alignment. The sequence identity and similarity between the latest N1 sequence and 2HU0 are 91.4% and 95.6%, respectively.. 52.
(54) 1.2 1 Verify score. 0.8 0.6 0.4 0.2 0 -0.2 -0.4 0. 20. 40. 60. 80. 100. 120. 140. 160. Amino acid index. Figure 5. The results of verify score plot of H1 homology modeling. The red line is the latest H1 sequence and the blue line is the template (PDB ID: 1RD8) for modeling.. 53.
(55) 1.6. Verify Score. 1.2 0.8 0.4 0 -0.4 60 100 140 180 220 260 300 340 380 420 460 500 Amino acid index. Figure 6. The results of verify score plot of N1 homology modeling. The Verify Score diagram shows the validity of our homology model. The amino acid from 119 to 293 is the major binding site. The blue line and the red line are the latest N1 sequence and the template (PDB ID: 2HU0), respectively.. 54.
(56) Figure 7. Ramachandran plotting of H1 homology modeling result. Glycine is labeled by triangles. It shows only 1.28% out of the region of possible angle formations.. 55.
(57) Figure 8. Ramachandran plotting of N1 homology modeling result. Glycine is labeled by triangles. It shows only 3.4% out of the region of possible angle formations.. 56.
(58) (a). (b). (c). Figure. 9. The linear correlation of SAR. (a) The correlation of log estimate versus Fit value. (b)The plotting of Fit value versus log active. (c) The plotting of log estimates versus log active.. 57.
(59) Figure 10. The features of hypotheses 1. The distances of features are labeled by blue lines. The green one is hydrogen bond acceptor feature, the purple one is hydrogen bond donor feature, and the red one is positive ionizable feature.. 58.
(60) NH2. OH. OH. H N. O. O. O. H N. N. S. OH. H N. N. OH. OH N. N. N HO. O. N. S. O. OH. OH N. O. OH. O OH. NCI0624650. OH. OH. OH. NCI0607158. NCI0605741 NH2. OH HO. H N. HO. O. O. N. HO. H2N. N. O. NH2. O. HO. N. O. HO. O. OH. OH. O. HO OH. HO HO. O. OH HO. OH. NCI0605737 S. H N. N. N. O OH. N. N. OH N H. O. H N. O. OH. HO. HO. OH. KANAMYCIN-C. OH. O. OH. OH. Br. I. HO. OH OH. PROTOVERINE. O. H2N. HO. N. N HO. O. O. O. OH OH. O. NCI0608643. NCI0606258. NCI0608650. Figure 11. The chemical structures of top 9 candidates.. 59.
(61) (a1). (a2). (b1). (b2). (c1). (c2). (d1). (d2). 60.
(62) (e1). (e2). (f1). (f2). (g1). (g2). (h1). (h2). 61.
(63) (i1). (i2). Figure 12. The docking poses of 9 candidates in H1 (a1-i1) and N1 (a2-i2), respectively. (a) NCI0624650, (b) NCI0607158, (c) NCI0605741, (d) PROTOVERINE, (e) NCI0605737, (f) KANAMYCIN-C, (g) NCI0608643, (h) NCI0606258, and (i) NCI0608650.. 62.
(64) (a). (b). (c). OH HO H O. OH. O. N+. O. Figure 13. The pharmacophore analysis of H1. (a) The interaction map of the latest H1 structure. The green ones are hydrogen bond acceptor features; the purple ones are hydrogen bond donor features, and the blue ones are hydrophobic features. (b)The docking pose of NCI00353858 in H1. The hydrogen bonds are labeled by green dotted lines. (c) The structure of NCI0353858.. 63.
(65) (a). (b). Figure 14. The interaction maps of N7 and N2. (a) The interaction map of N7. The green ones are hydrogen bond acceptor features, the purple ones are hydrogen bond donor features, and the blue ones are hydrophobic features. The yellow circles labeled the major differences between N2 and N7 interaction maps. (b)The interaction map of N2.. 64.
(66) Figure 15. The combined map was fit in the binding site of N1. The top 6 potent compounds are showed in the binding site and fitted with the combined map.. 65.
(67) OH O. N+. O N. OH. OH. HN. OH. N N. N. NH. +. OH. OH. N. NH. HO N. OH. OH OH. HN N. N. HO H O. NCI0040590. VALIDOXYLAMINE-A. O HN. N. OH. N H OH. HO H O. OH. OH. NCI0054249. N NH. OH. H N. OH. N NH. N. N NH. NCI0040589. OH. N. N. S. HO O. NCI0051451. O. O N. HO. N. HO. H N. N+ N. HO. OH OH. NH2. NCI0054248. Figure 16. The structures of the 6 candidates from NCI database.. 66.
(68) 6. 已發表之論文著作(Publications) 已發表之論文著作 6-1. 論文發表 Journal publications 1. Chien-yu Chen、Yea-huey Chang、Da-Tian Bau、Hung-jin Huang、 Fuu-Jen Tsai*、Chang-Hai Tsai*、Chen, Calvin Yu-Chian*,Discovery of potent inhibitors for phosphodiesterase 5 by virtual screening and pharmacophore analysis,ACTA PHARMACOLOGICA SINICA, 2009 Nov 2. Chien-Yu Chen、Hung-Jin Huang、Fuu-Jen Tsai*、Chang-Hai Tsai*、 Chen, Calvin Yu-Chian*,Development of AMP-activated protein kinase agonists by structure-based and ligand-based drug designing, ADVANCED MATERIALS & PROCESSES,2009 Oct 3. Chien-Yu Chen、Yea-Huey Chang、Fuu-Jen Tsai*、Chang-Hai Tsai*、 Chen, Calvin Yu-Chian*,Fabrication of multi-functional SiO2@Au core-shell nanoparticles,ADVANCED MATERIALS & PROCESSES, 2009 Oct 4. Chien-Yu Chen、Yea-Huey Chang、Da-Tian Bau、Hung-Jin Huang、 Fuu-Jen Tsai*、Chang-Hai Tsai*、Chen, Calvin Yu-Chian*,Ligand-Based Dual Target Drug Design for H1N1: Swine Flu- A Preliminary First Study , JOURNAL. OF. BIOMOLECULAR 67. STRUCTURE. &.
(69) DYNAMICS,2009 Oct,27(2):171-178 5. Chien-yu Chen、Yea-huey Chang、Da-Tian Bau、Hung-jin Huang、 Fuu-Jen Tsai*、Chang-Hai Tsai*、Chen, Calvin Yu-Chian*,Ligand-based design for heat shock protein 90 inhibitors,Surface Science,2009 Oct 6. Chien-Yu Chen、Da-Tian Bau、Yea-Huey Chang、Yuan-Man Hsu、 Tin-Yun Ho、Hung-Jin Huang、Fuu-Jen Tsai*、Chang-Hai Tsai*、Chen, Calvin Yu-Chian*、Yu-An Chang,Drug design for Influenza A virus subtype H1N1 , JOURNAL OF THE CHINESE INSTITUTE OF CHEMICAL ENGINEERS,2009 Oct 7. Chien-Yu Chen、Da-Tian Bau、Ming-Hsui Tsai、Yuan-Man Hsu、Tin-Yun Ho、Hung-Jin Huang、Yea-Huey Chang、Fuu-Jen Tsai*、Chang-Hai Tsai*、Chen, Calvin Yu-Chian*,Is That Possible to Design the Versatile Inhibitors for H1N1, H5N1, H5N2, and H5N7 ? , IEEE/ACM Transactions on Computational Biology and Bioinformatics,2009 Oct 8. Chien-Yu Chen、Da-Tian Bau、Ming-Hsui Tsai、Yuan-Man Hsu、Tin-Yun Ho、Hung-Jin Huang、Yea-Huey Chang、Fuu-Jen Tsai*、Chang-Hai Tsai*、Chen, Calvin Yu-Chian*,Drug Design for the Influenza A Virus Subtype H1N1,IEEE/ACM Transactions on Computational Biology and Bioinformatics,2009 Oct. 68.
(70) 9. Hung-Jin Huang、Da-Tian Bau、Ming-Hsui Tsai、Yuan-Man Hsu、Tin-Yun Ho、Chien-Yu Chen、Yea-Huey Chang、Fuu-Jen Tsai*、Chang-Hai Tsai*、Chen, Calvin Yu-Chian*,Dual-targeted Drug Design of HER2 and HSP90 by CoMFA Model and Pharmacophore Analysis,IEEE/ACM Transactions on Computational Biology and Bioinformatics,2009 Oct 10. Chien-Yu Chen、Da-Tian Bau、Ming-Hsui Tsai、Yuan-Man Hsu、 Tin-Yun Ho、Hung-Jin Huang、Yea-Huey Chang、Fuu-Jen Tsai*、 Chang-Hai Tsai*、Chen, Calvin Yu-Chian*,Drug Design for KU86 in DNA Break Repair System,IEEE/ACM Transactions on Computational Biology and Bioinformatics,2009 Oct 11. Chien-Yu Chen、Fuu-Jen Tsai、Jing-Gung Chung、Chang-Hai Tsai、 Yuan-Man Hsu、Hung-Jin Huang、Tin-Yun Ho、Yea-Huey Chang、 Da-Tian Bau*、Ming-Hsui Tsai*、Chen, Calvin Yu-Chian*,A Novel Strategy for Designing Dual-target Inhibitors of KU86 and XRCC4, IEEE/ACM. Transactions. on. Computational. Biology. and. Bioinformatics,2009 Oct 12. Yea-Huey Chang、Da-Tian Bau、Ming-Hsui Tsai、Yuan-Man Hsu、 Tin-Yun Ho、Chien-Yu Chen、Hung-Jin Huang、Fuu-Jen Tsai*、 Chang-Hai Tsai*、Chen, Calvin Yu-Chian*,Reducing without Side. 69.
(71) Effects? A Novel Strategy for Designing the PPAR Agonists,IEEE/ACM Transactions on Computational Biology and Bioinformatics,2009 Oct 13. Hung-Jin Huang、Da-Tian Bau、Ming-Hsui Tsai、Yuan-Man Hsu、 Tin-Yun Ho、Chien-Yu Chen、Yea-Huey Chang、Fuu-Jen Tsai*、 Chang-Hai Tsai*、Chen, Calvin Yu-Chian*,What is the Key Point for Designing. HER2. Inhibitors. ? , IEEE/ACM. Transactions. on. Computational Biology and Bioinformatics,2009 Oct 14. Chien-Yu Chen、Da-Tian Bau、Ming-Hsui Tsai、Yuan-Man Hsu、 Tin-Yun Ho、Hung-Jin Huang、Yea-Huey Chang、Fuu-Jen Tsai*、 Chang-Hai Tsai* 、 Chen, Calvin Yu-Chian* , Drug Design for AMP-Activated Protein Kinase Agonists in Silico , IEEE/ACM Transactions on Computational Biology and Bioinformatics,2009 Oct 15. Chien-Yu Chen、Da-Tian Bau、Ming-Hsui Tsai、Yuan-Man Hsu、 Tin-Yun Ho、Hung-Jin Huang、Yea-Huey Chang、Fuu-Jen Tsai*、 Chang-Hai Tsai*、Chen, Calvin Yu-Chian*,Could Traditional Chinese Medicine Used for Curing Erectile Dysfunction ? , IEEE/ACM Transactions on Computational Biology and Bioinformatics,2009 Oct 16. Chien-yu Chen、Yea-huey Chang、Da-Tian Bau、Hung-jin Huang、 Fuu-Jen Tsai*、Chang-Hai Tsai*、Chen, Calvin Yu-Chian*,Discovery the. 70.
(72) inhibitors of H5N1, H5N2, and H5N7 by pharmacophore analysis, Surface Science,2009 Oct. 71.
(73) 6-2. 研討會發表 Conference publications 1. Discovery the triple inhibitors of H5N1, H5N2, and H5N7 by pharmacophore analysis,20th International Conference on Adaptive Structures and Technologies (ICAST 2009),香港,2009.10.20 ~ 2009.10.22 2. Is That Possible to Design the Versatile Inhibitors for H1N1, H5N1, H5N2, and H5N7 ?,2nd International Conference on BioMedical Engineering and Informatics (BMEI'09),Tianjin, China,2009.10.17 ~ 2009.10.19 3. Could Traditional Chinese Medicine Used for Curing Erectile Dysfunction ?,2nd International Conference on BioMedical Engineering and Informatics (BMEI'09),Tianjin, China,2009.10.17 ~ 2009.10.19 4. Drug Design for KU86 in DNA Break Repair System,2nd International Conference on BioMedical Engineering and Informatics (BMEI'09), Tianjin, China,2009.10.17 ~ 2009.10.19 5. Drug Design for the Influenza A Virus Subtype H1N1,2nd International Conference on BioMedical Engineering and Informatics (BMEI'09), Tianjin, China,2009.10.17 ~ 2009.10.19. 72.
(74) 6. A Novel Strategy for Designing Dual-target Inhibitors of KU86 and XRCC4,2nd International Conference on BioMedical Engineering and Informatics (BMEI'09),Tianjin, China,2009.10.17 ~ 2009.10.19 7. Virtual Screening from the Maybridge Database and Molecular Docking Approach on Discovery of H5N1 Inhibitors,IEEE 2009 International Conference on Complex, Intelligent and Software Intensive Systems, Fukuoka Institute of Technology (FIT), Japan,2009.3.16 ~ 2009.3.19 8. Discovery the potent inhibitors of H5N1 by pharmacophore comparison analysis,第二屆中國醫藥大學暨亞洲大學生物科技研討會,立夫 B1 國際會議廳,2009.3.19 ~ 2009.3.19 9. Development a novo inhibitor of diarrhea from ginger components by virtual screening technique,第二屆中國醫藥大學暨亞洲大學生物科技 研討會,立夫 B1,2009.3.16 ~ 2009.3.16 10. Discovery the potent inhibitors for phosphodiesterase 5 by multiple linear regression QSAR model prediction,第二屆中國醫藥大學暨亞洲 大學生物科技研討會,立夫 B1 國際會議廳,2009.3.16 ~ 2009.3.16 11. Discovery the Potent Inhibitors for Phosphodiesterase 5 by Virtual Screening and Pharmacophore Analysis,13th Biochemical Engineering conference,元智大學,2008.6.27 ~ 2008.6.29 12. Structure Based and Phamacophore Analyses of Drug Resistance of Chicken Influenza A Virus (H5N1),第一屆中國醫藥大學生物科技研. 73.
(75) 討會,中國醫藥大學,2008.4.7 ~ 2008.4.7 13. Components of Epimedium sagittatum and its derivatives could inhibit PDE5 activity in the view of computer-aided drug design,Symposium of Bioinformatics and Systems Biology in Taiwan,中正大學,2007.9.3 ~ 2007.9.5. 74.
(76)
數據

+7
相關文件
The study explore the relation between ownership structure, board characteristics and financial distress by Logistic regression analysis.. Overall, this paper
The Centre for Learning Sciences and Technologies (CLST), The Chinese University of Hong Kong (CUHK) launched the!. EduVenture ® learning system, which has been well received by
In Section 4, we give an overview on how to express task-based specifications in conceptual graphs, and how to model the university timetabling by using TBCG.. We also discuss
Taiwan customer satisfaction index (TCSI) model shown in Figure 4-1, 4-2 and 4-3, developed by the National Quality Research Center of Taiwan at the Chunghua University in
To solve this problem, this study proposed a novel neural network model, Ecological Succession Neural Network (ESNN), which is inspired by the concept of ecological succession
This study reviewed ecological economics, general system theory and adopted the concept of emergy of ecosystem proposed by Odum, then built a ecological energetic system model of
Thus, the purpose of this study is to determine the segments for wine consumers in Taiwan by product, brand decision, and purchasing involvement, and then determine the
This study uses data envelopment analysis to investigate the main technology develop- ment evaluation models adopted by Asian (Taiwan, Japan, Korea, Singapore, and Mainland
