670 IEEE PHOTONICS TECHNOLOGY LETTERS, VOL. 7, NO. 6, JUNE 1995
Optoelectronic Phase Tracking and Electrooptic
Sampling of Free-Running Microwave Signals up
to 20
GHz in a Laser-Diode-Based System
Hsiao-Hua Wu, Member, IEEE,
Gong-Ru
Lin, and Ci-LingPan,
Member, IEEEAbstract-We report optoelectronk phase-tracking and elec- trooptic sampling of microwave signals from a free-running oscillator in a laser-diode-based system. A voltage-controlled oscillator (VCO) in a photoconductive harmonic mixer based phase-lock loop is utilized to gain switch a 0.8 pm laser diode for phase-tracking of the microwave signal at frequencies up to 20 GHz. Phase and amplitude of the microwave signal in a microstrip line is also measured using another 1.3-pm laser diode driven by the VCO.
I. INTRODUCTION
LECTROOPTIC sampling [l], [2] is a useful technique
E
applied for probing high-speed voltage signals noninva- sively at internal nodes of electronic devices and circuits. To characterize microwave integrated circuits in the frequency domain, electronically phase-locked synthesizers are com- monly employed for driving the circuit under test and the probing laser, respectively, and hence preventing the problem of synchronization [3], [4]. Nonetheless, such systems are expensive and require electrical connection for introducing the microwave signal to the circuit. Recently, several opto- electronic phase lock schemes have been addressed [5]-[7] with the intention of synchronizing the microwave and optical sources at the wafer level. In these schemes, a laser-activated photoconductive switch or an electrooptic sampler was used as the optoelectronic harmonic mixer for phase locking of the target voltage-controlled-oscillator (VCO) to the harmonics of optical probe pulses. In reality, the microwave signal under test might be free-running and originated from a mono- lithic microwave integrated circuit (MMIC). In this work, we demonstrate optoelectronic phase tracking and electrooptic sampling of the microwave signal generated from a free- running oscillator using gain-switched laser diodes.11. EXPERIMENT
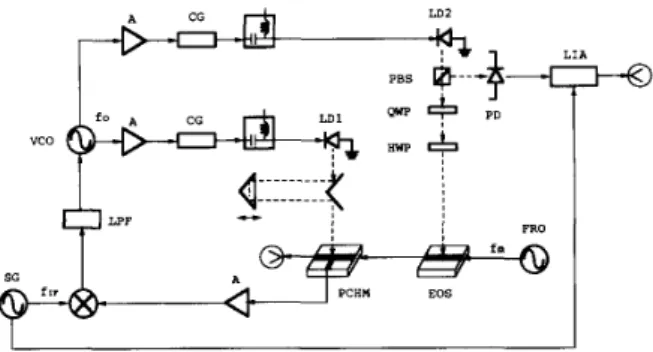
A schematic diagram of the experimental setup is shown in Fig. 1. It is divided into an optoelectronic phase lock loop (OE- PLL) and an electrooptic harmonic mixer (EOHM). A sweep oscillator (HP8350B mainframe with HP83592B plug-in) Manuscript received January 20, 1995. This work was supported in part by the National Science Council of the Repubic of China under Grants NSC83- 0417-E029-001 and NSC83-0417-EOO9-004.
H.-H. Wu is with the Depertment of Physics, Tunghai University, Taichung, Taiwan 407, Republic of China.
G.-R. Lin and C.-L. Pan are with the Institute of Electro-Optical Engineer- ing, National Chiao Tung University, Hsinchu, Taiwan 300, Republic of China.
IEEE Log Number 94 1 I3 18.
vco
b
/l Pcnn EOS
Fig. 1. Schematic diagram of the OEPLL based electrooptic sampling sys- tem. A: amplifier, CG: comb generator, EOS: electrooptic sampler, FRO:
free-running oscillator, HWP: half-wave plate, LDI: 0.8-pm laser diode, LD2: 1.3-pm laser diode, LIA lock-in amplifier, LPF: loop filter, PBS: polarizing beam-splitter, PCHM: photoconductive harmonic mixer, PD: photodetector, QWP: quarter-wave plate, SG: signal generator, VCO: voltage-controlled oscillator.
operating on the CW mode over a range of 0.01-20 GHz offers microwave signals under measurement which are fed to the OEPLL and the EOHM. The frequency stability with time for the sweep oscillator is worse from f l O O kHz at 0.01-2.4 GHz range to *300 kHz at 13.5-20 GHz range in a 10-min period. The phase of the microwave signal is therefore difficult to be measured prior to tracking its frequency and phase.
The OEPLL consists of a photoconductive harmonic mixer (PCHM), an electronic phase lock loop, and a 0.8-pm gain- switched laser diode (GSLD). A train of 50-ps pulses at an average power of 0.3 mW provided by the GSLD is collimated with a microscope objective, passes through an optical delay line, and is focused on a gap of the PCHM. The photoconductive effect mixes the microwave signal at frequency f m with the harmonics of the optical pulse train
and produces a desired intermediate frequency (IF) signal thru a low-passed amplifier. This IF signal is lately used as the external reference source of the lock-in amplifier for electrooptic sampling. An error signal obtained by comparing the phase of the IF signal to a IF reference which has a frequency
IF
within the operating range of traditional lock-in amplifier (typically below 100 kHz) is sent to a VCO via a loop filter. The repetition frequency of the GSLD controlled by the VCO is subsequently changed to track the microwave signal. When the phase-locking condition is achieved, the frequency of the VCO should be fo = ( f m f ~ I F ) / N , where N is an integer. In the OEPLL scheme, frequency tuning of the VCO 1041-1 135/95$04.00 0 1995 IEEEWU et al.: OFTOELECTRONIC PHASE TRACKING AND ELECTROOPTIC SAMPL -60 1 , . I , . , . , . . . . I . . . . iXlO8 4.98635 4.98640 4.98645 Frequency (Hz) (a)
-
2
-20 0 & n -40 5.00000 5.00005 5.0001 0 X I 08 Frequency (Hz) (b) Fig. 2.signals at (a) 500 MHz and (b) 20 GHz.
Power spectra of the VCO phase-locked to free-running microwave
over 15 kHz is readily to phase track a 20-GHz microwave signal with a frequency drift of 600 kHz.
Another InGaAsP-InP laser diode (Oki, model OL303A- 100, X = 1.3 pm) is utilized as sampling light source for the EOHM and to be gain switched by the same VCO as used in the OEPLL. This laser produces optical pulse train with an average power and pulse width on the order of 1 m W and 40 ps, respectively. The EOHM employed is a typical arrangement of reflection-mode electrooptic sampler with a GaAs microstrip line where the microwave signal mixes with the harmonics of the laser pulse and down converts to the IF signal that preserves the phase information. Phase and magnitude of the microwave signal is measured using a low frequency lock-in amplifier with an external reference source from the OEPLL. A stable magnitude and phase of electrooptic
.ING OF FREE-RUNNING MICROWAVE SIGNALS 67 1
* O t
0 20 40 60
Time (minutes)
Fig. 3.
and IF reference (trace(b)) as reference source.
signal can thus be observed on the lock-in amplifier when the phase of the microwave signal has been tracked by the VCO. Phase fluctuations for the electrooptic signal using IF signal (trace(a))
111. RESULTS AND DISCUSSION
The key component to achieve phase tracking of microwave signals is the PCHM, which is a laser activated photoconduc- tive switch biased with the microwave signal. The conversion loss of the PCHM, measured from the microwave input signal at 500 MHz down to the IF output signal at 100 kHz by mixing with the first harmonic of the GSLD, is 38.5 dB. The root- mean-square (rms) noise density of the IF signal measured at the same condition is less than 0.3 pV/- for 4 dBm of the microwave signal applied. To phase track the microwave signal at higher frequency, higher order of the laser harmonics is required for the mixing. When the frequency of microwave signal increases to 20 GHz, the conversion loss increases to 69 dB. Fortunately, the signal-to-noise ratio (S/N) of the IF signal is still allowed for phase tracking of microwave signals up to 20 GHz. Extension of the frequency beyond 20 GHz would be possible if the sweep oscillator operating at such frequency is available. The side-band power spectrum for the VCO has been monitored as one increases the frequency of the free-running microwave signals. As shown in Fig. 2, the phase-locked VCO exhibits better frequency stability when the frequency of the microwave signal to be tracked increases.
For the EOHM, the shot-noise-limited phase resolution and amplitude sensitivity is determined by the photocurrent, the measurement bandwidth, and the microwave voltage. With an average photocurrent of 70 mA, the electrooptic signal measured in the lock-in amplifier is 600 pVrms in response to a microwave power of 4 dBm at 500 MHz. The rms noise density accompanying the electrooptic signal is also measured to be 6 pV/&. This corresponds to a S/N of 40
dB
and rms phase fluctuation of 0.01 radians (or 0.57’) for a noise bandwidth of 1 Hz. Timing jitter between microwave signals and laser pulses can also give rise to the phase fluctuation of the electrooptic signal. For instance, 1 ps timing jitter results612 IEEE PHOTONICS TECHNOLOGY LETTERS, VOL. 7, NO. 6, JUNE 1995
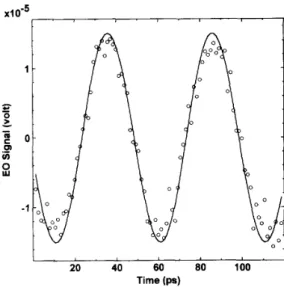
of the electrooptic signal due to slight change of the path caused by the optical delay is eliminated by this arrangement. Actual frequency of the measured signal is determined from the waveform and the delayed path length. The deviation of the experimental data from a 20 GHz sinusoid is due to insufficient S / N at such high frequency and can be improved by compressing the pulse width, amplifying the laser power, as well as using the differential detection.
o - ~ I *.
B
e o iii8
-
c-
IV. SUMMARYOptoelectronic phase-tracking and electrooptic sampling of microwave signals generated from a free-running oscillator have been accomplished in a laser-diode-based system. Phase and amplitude of the microwave signals at frequencies as high as 20 GHz are also measured. This system has potential applications for on wafer characterization of MMIC’s.
0
-1
20 40 60 80 100
Time (ps) REFERENCES
Fig. 4. Electrooptic sampling of 20-GHz signal generated from a free-running microwave oscillator.
in the phase fluctuation of 2.88’ at 8 GHz. Fig. 3 shows
the variations in the phase of the electrooptic signal for the measured microwave at 8 GHz as a function of time, by referencing the phase from the IF signal (trace (a)) and the IF reference (trace (b)), respectively. It is shown that phase drift of the electrooptic signal is less than 10” for trace (a) and less than 15’ for trace (b) within an hour of measured period. Timing jitter between the GSLD and the microwave signal at 8 GHz for the OEPLL is estimated from these data to be less than 2 ps. The phase and amplitude of the microwave signals generated from a free-running oscillator are measured at a power level of 4 dBm by electrooptic sampling over the range of 0.5-20 GHz. Fig. 4 shows the 20 GHz signal to be scanned by introducing an optical delay in the OEPLL. The variation
[ l ] J. A. Valdmanis, G. A. Mourou. and C. W. Gable, “Picosecond electro- optic sampling system,” Appl. Phys. Lett., vol. 41, pp. 211-212, 1982. [2] B. H. Kolner, D. M. Bloom, and P. S . Cross, “Electro-optic sampling
with picosecond resolution,” Electron. Lett., vol. 19, pp. 574-575, 1983. [3] K. J. Weingarten, M. J. W. Rodwell, and D. M. Bloom. “Picosecond op- tical sampling of GaAs integrated circuits,” IEEE J. Quanrum Elecrron., vol. 24, pp. 198-220, 1988.
[4] A. J. Taylor, R. S . Tucker, J. M. Wiesenfeld, C. A. B u m s , G .
Eisenstein, J. R. Talman, and S. S . Pei, “Direct electrooptic sampling of a GaAs integrated circuit using a gain-switched InGaAsP injection laser,” Electron. Letf., vol. 22, pp. 1068-1069, 1986.
[5] M. G. Li, E. A. Chauchard, C. H. Lee, and H.-L. A. Hung, “Intermixing optical and microwave signals in GaAs microstrip circuits for phase- locking applications,” IEEE Trans. Microwiave Theory Tech., vol. 38, pp. 1924-1931, 1990.
[6] H. H. Wu, C. S. Chang, and C. L. Pan, “Optoelectronic phase-locking of microwave signals up to 18 GHz by a laser-diode-based GaAs : Cr photoconductive harmonic mixer,” IEEE Micmwave Guided Wave Lett.,
[7] C. L. Pan and H. H. Wu, “Synchronization of electrical and optical signals by using an optoelectronic timing discriminator in a phase-lock loop,” IEEE Phoron. Technol. Lett., vol. 4, pp. 1298-1301, 1992. vol. 2, pp. 11-13, 1992.