ELSEVIER
Cryogenics 36 (1996) 365-312 0 1996 Elsevier Science Limited F’rinted in Great Britain. All rights reserved 001 l-2275/96/$15.00
Effect of oversize in wire-screen matrix to
the matrix-holding tube on regenerator
thermal performance
Ping-Hei Chen, Zei-Chi Chang and B.-J. Huang
Department of Mechanical Engineering, National Taiwan University, Taipei 10764, Taiwan
Received 25 September 1995
A typical regenerator in a cryocooler is usually made by packing hundreds of fine- mesh but oversize wire screens into a small circular tube to provide better thermal performance. By the use of the oversize wire screens, the flow leakage around the inner circumference of the tube is significantly reduced. The oversize in the wire screen is the difference between the diameter of the wire screen and the inner diameter of the tube. In the present study a single-blow test method was used to investigate the effect of oversize on the thermal performance of regenerators. Heat transfer and press- ure measurements were performed on three test regenerators. The value in oversize ranged from 0.05 mm to 0.55 mm. The average heat transfer rate of regenerators increases with oversize of wire screens. In addition, empirical relations are provided for the Nusselt number and friction factor
versus
the Reynolds number for each test regenerator.Keywords: regenerators; heat transfer measurements; cryocoolers
Nomenclature
Heat transfer area of screen-packed matrix Frontal area of screen-packed matrix Heat transfer area of external side wall Fluid specific heat at constant pressure Specific heat of screen-packed matrix Specific heat of the side wall
Hydraulic diameter, as defined in Equation (8)
Wire diameter of wire-screen
Friction factor, as defined in Equation (11) Average heat transfer coefficient of the screen-packed matrix
Average heat transfer coefficient of the side wall
Dimensionless Joule-Thomson coefficient, as defined in Equation (4)
Fluid conductivity
Length of screen-packed matrix Mass of screen-packed matrix Mass of external side wall Mass flow rate of fluid Number of nodes
Number of transfer unit of screen-packed matrix, as defined in Equation (4)
NTU, Nu P
R
Re R,, S maxT
Tf
Th,,
T,
TW
To
t t*sys v,, XNumber of transfer unit of side wall, as defined in Equation (4)
Nusselt number, as defined in Equation ( 12) Dimensionless pressure of fluid flow
Ratio of NTU, to NTU,
Reynolds number, as defined in Equation ( 10) Thermal capacitance ratio of screen-packed matrix to external tube wall, as defined in Equation (4)
Maximum slope of dimensionless exit fluid temperature
Dimensionless temperature
Dimensionless temperature of fluid flow as defined in Equation ( 12)
Dimensionless heated inlet temperature at the steady state
Dimensionless temperature of screen-packed matrix
Dimensionless temperature of side wall Dimensionless inlet fluid temperature at t = 0 Dimensionless time
Time scale, as defined in Equation (4) Volume of the regenerator
Dimensionless axial distance from the inlet of screen-packed matrix
Regenerator thermal performance: P.-H. Chen et al.
Greek letters 7 Dimensionless time constant of inlet fluid
temperature E Porosity of screen-packed matrix
El. Dynamic viscosity of fluid Superscripts
Ur Joule-Thomson coefficent . I
4
Shape factor in Equation (8)P Fluid average density
* Dimensional variable
One of the major methods to improve the thermal efficiency of cryocoolers is to increase the heat transfer performance of regenerators in cryocoolers. In practice, the regenerator is comprised of a circular tube stacked with oversize wire screens to seal off the leakage of working fluid through the inner circumference of the tube. It has been shown that mesh size and wire diameter affect the thermal performance of regenerators’-‘. Jones4 further measured the velocity pro- files of air flow through the wire-screen matrices. The mea- sured velocity profiles at the exit of regenerator matrices are non-uniform, high in the annular regions and low but uniform in the central regions. The effect of inhomogeneity in velocity distributions on the friction loss and thermal performance of regenerator matrices was theoretically assessed by Jones4. A single-blow technique’.’ or a test facility using oscillating flow5 are commonly adopted to evaluate the pressure loss and heat transfer characteristics of regenerators. Both heat transfer and pressure loss data of regenerators are essential considerations for the design of cryocoolers with higher efficiency. Although regenerator heat transfer coefficients determined using test facilities with an oscillating flow are closer to actual operation con- ditions in cryocoolers than those determined using the sin- gle-blow technique, the actual difference in determined heat transfer rates is not very signficant”. The advantages in using the single-blow technique are its simple operation and the low cost of instrumentation. In addition, measured results can easily be compared with abundant experimental and analytical data which are available from numerous studies performed on compact heat exchanger&’ using the same single-blow technique.
However, no prior studies have experimentally investi- gated the effect of the oversize in wire screen on the ther- mal performance of regenerators. Therefore, in this study the single-blow technique was used to measure the pressure loss and thermal performance of test regenerators with wire screens having different oversize values. For the test regen- erators in this study, the oversize in wire screen ranges from 0.05 mm to 0.55 mm. Measurements were conducted at a range of Reynolds numbers from 39 to 225. The effects of the Reynolds number on the heat transfer coefficient and friction factor of the regenerator were assessed. It is worth noting that the test regenerators used in prior studies’,’ using the single-blow method were stacked with less than
100 wire screens, much less than the 500-600 screens used in a typical regenerator. In the present study, three test regenerators have 560 wire screens. Such a large number of wire screens could increase the fluid flow-through time in the regenerator and the heat transfer coefficient. With both of these effects, adiabatic walls cannot be assumed for the single-blow model. An improve model for the single- blow method was proposed in the present study to deter- mine the heat transfer coefficient of the screen-packed matrix with an NTU,, value greater than 100.
Analysis of the improved single-blow
model
In single-blow measurement, a steady gas stream, typically an air stream, is supplied to flow through a regenerator as shown in Figure 1. When the fluid inlet temperature is sud- denly increased by turning on a heater installed upstream of the test regenerator, the temperatures of the screen-packed matrix, tube and air flow vary with both time and space. All these temperature histories at particular locations can be predicted from an adequate analytical model by assuming the average heat transfer coefficient between the hot air stream and screen-packed matrix remains constant. Thus, the average coefficient can be determined by match- ing the predicted and measured exit fluid temperature his- tories once the time-dependent inlet fluid temperature response is known.
To predict the temperature histories of the screen-packed matrix, tube and air flow, an improved model to describe the heat transfer system is proposed for the single-blow method. The present model is similar to the one in Liang and Yang7 but also includes the heat flow from the bound- ary of the test heat exchanger (screen-packed matrix in the present study) into the external tube and the Joule- Thomson expansion in the air stream. The pressure drop through the test screen-packed matrix stacked with hun- dreds of wire screens is usually greater than 0.1 MPa. If the fluid is not an ideal gas, Joule-Thomson expansion occurs when the air stream flows through the screen-packed matrix. To include the effects of both the Joule-Thomson expansion and the heat flux into the tube, additional assumptions other than those in Liang and Yang7 are made. These important assumptions are a linear decrease in fluid pressure through the matrix and no radial temperature vari- ation in the tube. Therefore, the dimensionless formulas for the heat transfer system of the single-blow measurements are given by
z+NTU,,,(T,-T,,,i+NTU,(T,-T,)=JTC (1)
for the working fluid,
/
Heater screen
FScreen-packed matrix
Regenerator thermal performance: P.-H. Chen et al. for the screen-packed matrix and
~+R,,NTU,(T,-T&O
(3)for the tube. Equation (3) is the additional energy equation in the present improved model used to solve the time- dependent temperature of the tube at different locations of x.
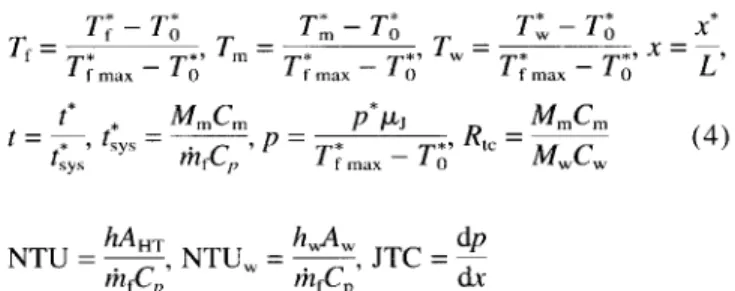
In Equations (l)-(3), the dimensionless variables or parameters are expressed as
NTU = z, NTU, = g, JTC = 2
f P f P
As compared with the model in Liang and Yang7, additional dimensionless groups such as NTU,, JTC and R,, and an extra variable T, are included in the present improved model. Equations (l)-(3) are subject to the fol- lowing initial and boundary conditions:
t = 0, Tf (x) = T<(x) = T, (x) = JTC x (5)
x=0, T,.= Tf (t) for t > 0 (6)
Numerical predictions of Tf, T, and T, are obtained by solving Equations ( 1 )-( 6) using a finite-difference method. First, the physical domain of the regenerator is divided using N equally spaced nodes. Except for both end nodes, Equation ( 1) is discretized on all internal nodes by using a central difference formulation which is second-order accuracy in space. Then, both Equations (2) and (3) are discretized by employing a Crank-Nicolson scheme which is second-order accuracy in time. At each successive time step, the discretized formula on the equally spaced nodes can be rearranged into a single matrix equation, CX=D. The (N- 1) elements of the unknown vector X represent the temperatures of the fluid on the second node to the Nth node at the successive time step. Note that the air tempera- ture on the first node is already known because the bound- ary condition at the inlet is given by Equation (6). The coefficient matrix of which the elements are related to the known properties of screen-packed matrix, fluid and tube is tri-diagonal. On the right-hand side of the single-matrix equation, the constant vector D has the (N-l) elements determined from the temperatures of screen-packed matrix, fluid and tube at the present time step. Therefore, the fluid temperatures at the successive time step can be directly solved from the known temperatures of screen-packed matrix, fluid and tube at the present time step. Once the fluid temperatures at the successive time step are known, the temperatures of screen-packed matrix and tube at the successive time step are obtained from the discretized Equations (2) and (3).
If the inlet fluid temperature response is an exponential function, given by
Tf (t) = 1 - exp (t/( T*ltTys)) (7)
in which r* is the dimensional time constant of the meas- ured inlet fluid temperature history, Equations (l)-(6) can be solved analytically by using a Laplace transformation. It has been proved that the analytic and numerical predic- tions for the exit fluid temperature are in close agreement”.
If the effects of both the heat flux into the tube wall and the Joule-Thomson expansion were further neglected in the energy Equations (l)-(3), the present numerical results also agree well with the analytic solutions in Liang and Yang’.
Experimental
apparatus
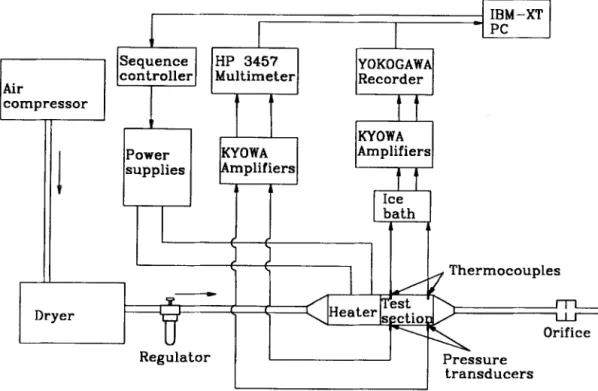
In the present study, a transient single-blow technique has been used to measure both the friction loss and heat transfer coefficient of test regenerators. As shown in Figure 2, the single-blow system includes a small air tunnel, a wire- screen heater system, and an automated data acquisition unit. The operating procedure of the present system is simi- lar to that used by Liang and Yang7. To establish a steady air flow through the test screen-packed matrix, the air flow was supplied by a reciprocating-type compressor. After leaving the regulator, the air flowed through a divergent nozzle, a flow straightener, a wire-screen heater, an upstream convergent adapter, the test section, a down- stream convergent adapter, an orifice flow meter and then exited into the atmosphere. The flow rate of dry air flow, measured by the calibrated orifice, was easily varied by adjusting the regulator, connected to the compressor.
Figure 3 shows a schematic view of the test section con- taining the test screen-packed matrix. There are two OMEGA T-typed thermocouples with a diameter of 0.25 mm located at the inlet and exit of the test regenerator. Both thermocouples were calibrated against an HP2804 quartz thermometer which has an uncertainty of 0.04”C. As the steady air flow was established to pass through the test regenerator, the screen heater was suddenly turned on. Consequently, the fluid temperatures at both inlet and exit of the screen-packed matrix were measured, digitized and then recorded into the personal computer. Two KYOWA PG-20KU absolute pressure transducers, one upstream and one downstream, were used to measure the pressure drop through the screen-packed matrix at different test con- ditions. The output voltages from both transducers were amplified five hundred times through the KYOWA CDV- 230B amplifiers. Both amplifiers were calibrated using a function generator to assure a linear amplification of analog signals in the range to be studied.
In the single-blow method, the uncertainty in determin- ing the NTU, value decreases with the time constant r of the inlet temperature response in Equation (7). Therefore, the single-blow system requires a heater which can heat up the fluid flow in a very short period. A wire-screen heating unit consisting of a pack of four wire-screen heaters and four DC power suppliers was constructed. In order to increase the heat transfer area between wires and the pass- ing air how, the spacing between each pair of wires was only 1 mm. To minimize the finite heat capacity of the wire, the diameter of the wire is 0.1 mm with a resistance of
126.2 R m-r. For typical runs, the inlet temperature rise in the fluid, pf,nfmax - r*,, was about 5-10°C depending on the flow rate. The inlet fluid temperature response curve can be fitted with an exponential function, with the time con- stant of inlet fluid temperature ranged from 0.8 to 0.4 s, decreasing with increase in how rate.
Regenerator thermal performance: P.-H. Chen et al.
compressor
Thermocouples
Figure 2 Single-blow measurement and data reduction system
Copper Holes for
Heat& /
Convergent Ho/les for nozzle pressure transducer
Figure 3 Test section
An automated data acquisition unit was set up to measure the temperature histories and pressure signals at the inlet and exit of the screen-packed matrix. The acquisition unit consisted of an YOKOGAWA 3655E recorder, four KYOWA CDV-230 amplifiers, an IEEE-488 interface bus, a PC computer, and an HP 3457A multimeter. The tempera- ture and pressure signals were amplified using the KYOWA CDV-230 amplifiers. The temperature and pressure signals were digitized by the YOKOGAWA 3655E recorder and the HP 3457A multimeter, respectively. The digitized results were immediately transmitted back to the PC com- puter through the IEEE-488 interface bus. The sampling rate for the temperature measurements was 10 Hz. The volumetric flow rate through the test regenerator was meas- ured by a flange-type orifice which was installed at the end of the test section. The calibration of the orifice was perfor- med in the precision measurement centre of ITRI in Tai- wan.
In order to study the effect of wire screen oversize, three
I
Holes forTest pressure
regenerator transducer
regenerators A, B and C were tested in the present study. Physical properties and dimensions of these regenerators are listed in Table I, where the definitions of the heat trans- fer area of the screen-packed matrix, AHT, and the hydraulic diameter of the wire screen, & are same as those in the paper by Tanaka et aL5. The equations for both parameters are given by
dll =
{(4E &)l& l--E)1 (8)A,, = {4(1-e) V&L1 (9)
where the porosity E is determined from the bulk density of stainless steel, 4 is a shape factor, V, denotes the volume of the screen-packed matrix and d, represents the wire diameter. The value of 4 is 4 for a wire screen. For all regenerators, the tubes are made of stainless steel and the regenerator matrices were made of 200 mesh SUS 3 16
Regenerator thermal performance: P.-H. Chen et al.
Table 1 Physical properties and dimensions of test regenerators
r
Regenerator type A B CWire-screen material SUS 316 SUS 316 SUS 316
External tube material SUS 316 SUS 316 SUS 316
L (mm) 60 60 60
Inner diameter of external tube (mm) 19.0 18.7 18.5 Diameter of wire screen (mm) 19.05 19.05 19.05
Tube thickness (mm) 0.28 0.43 0.53
V, (mm? 17011.4 16478.8 16128.2
Mesh number of wire screen 200 200 200
C,,, (J kg-’ Km’) 468 468 468
CL (mm) 0.0508 0.0508 0.0508
Number of wire screen 560 560 560
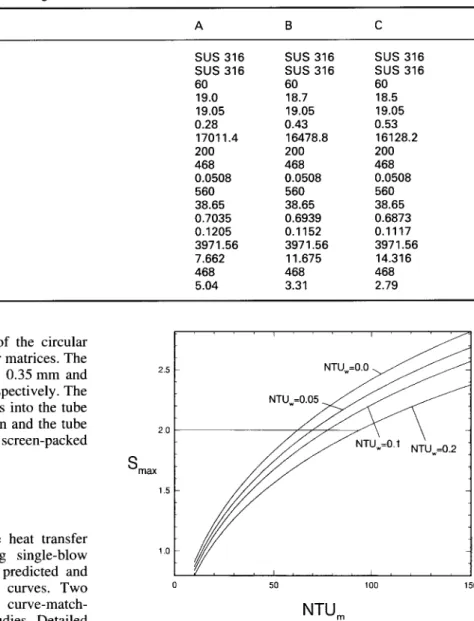
M, (g) 38.65 38.65 38.65 E 0.7035 0.6939 0.6873 dh (mm) 0.1205 0.1152 0.1117 A,, (cm’) 3971.56 3971.56 3971.56 Mw (g) 7.662 11.675 14.316 C, (J kg-’ K-‘) 468 468 468 R,,(NI,GJRL.,) 5.04 3.31 2.79
stainless-steel wire screens. The diameter of the circular wire screen was 19.05 mm for all regenerator matrices. The oversizes in the wire screen were 0.05 mm, 0.35 mm and 0.55 mm for the regenerators A, B and C, respectively. The purpose of stacking the oversize wire screens into the tube was to establish a tight fit between the screen and the tube to prevent leakage through the surrounding screen-packed matrix.
Data reduction
procedure
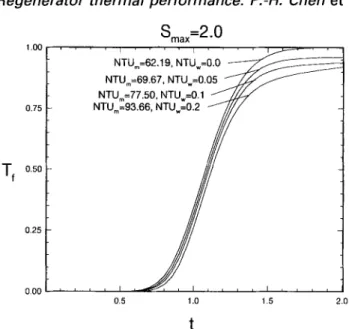
As described earlier, the evaluation of the heat transfer coefficient for the test regenerators using single-blow measurement was performed to match the predicted and measured exit fluid temperature response curves. Two popular schemes, the maximum-slope6 and curve-match- ing’-’ schemes, have been used in prior studies. Detailed descriptions of both matching schemes can be found in the aforementioned studies. It is worth note that the dimen- sionless maximum slope S,,, designates the maximum value of dT/dt, for the exit fluid temperature response curve. If an exponential rise in the inlet fluid temperature is assumed, analytical solutions of the exit fluid temperature response curve from Equations (l)-(6) can be obtained using a Laplace transformation. As shown in Figure 4 for the case of T= 0.1 and R,, = 5, the relationships between S,,, and NTU, can be then derived from the predicted exit fluid temperature. For a fixed value of NTU,, a unique relationship between S,,, and NTU, is observed so the NTU, value is then determined from this by matching both measured and predicted S,,, values. Note that the single- blow measurement with an assumption of adiabatic bound- ary conditions is the same as the one with NTU, = 0 in the present study.
However, there are two unknowns, NTU, and NTU,, to be determined as the heat flow into the tube wall is included in the present single-blow model. The maximum-slope scheme cannot be uniquely applied in this case because one S,,, value would correspond to more than one pair of NTU, and NTU, values. In Figure 4, four pairs of NTU, and NTU, values, NTU, = 62.19 and NTU, =O.O, NTU, = 69.67 and NTU, = 0.05, NTU, = 77.50 and NTU, = 0.1, and NTU, = 93.66 and NTU, = 0.2, corre-
0 50 100 150
NTU,
Figure4 Maximum slope value versus NTU, for different values of NTU, for 7= 0.1 and R,, = 5
spond to the same value of S,,, = 2.0. The curve-matching scheme avoids the above problem because a unique relationship still exists between the fluid exit temperature profile and the match of NTU, and NTU, values. Four exit temperature curves with the same value of S,,, = 2.0 in Figure 4 are shown in Figure 5. These four curves now are distinguishable although they have the same value of S IlXlX. The major drawback of the curve-matching scheme is that the uncertainty for the curve-matching scheme is higher than that for the maximum-slope scheme for regen- erators with high NTU, values”. Therefore, a hybrid- match method including both maximum-slope and curve- matching schemes was used at the same time to determine NTU, and NTU, values in the present study. In the evalu- ation procedure, a pair of values of NTU,, and NTU, are predicted and substituted into the present model to yield an exit fluid temperature profile prediction. This predicted temperature profile and the associated maximum slope S,,, are compared with the measured profile and value. If these two sets of profiles and the S,,, values match within speci- fied limits, then the NTU, and NTU, values are determ- ined. If they do not match, NTU, and NTU, values must
Regenerator thermal performance: P.-H. Chen et al 0.75 T osc f 0.25 000 NTUm=69.67. NTUw=0.05 NTU,=77.50, NTU,=O.l NTU,=93.66, NTU,=0.2 0.5 1.0 1.5 2.0 t
Figure5 Exit temperature response for different NTU, and NTU, values with S,,, = 2.0 for T= 0.1 and R,,= 5
be adjusted and the process is repeated until correct NTU, and NTU, values are obtained.
Although there are two unknowns to be simultaneously determined, the hybrid-match procedure will not be too slow to converge because there exists some ratio of the NTU, and NTU, values. This ratio is usually smaller than the heat transfer area ratio of the tube to the screen- packed matrix.
In the present model, one should be aware that the same predicted exit air temperature can be obtained by exchang- ing NTU, and NTU, values at R,, = 1.0 because both energy Equations (2) and (3) of the screen-packed matrix and tube then have the same form. When using the hybrid- match method, it is easy to distinguish between the NTU, and NTU, values because the NTU, value is much larger than NTU, due to a large heat transfer area ratio between the screen-packed matrix and the tube, approximately sev- eral hundreds to unity. The heat transfer coefficient of the screen-packed matrix is then determined from the value of NTU, obtained.
After the heat transfer coefficient of screen-packed matrix and the pressure drop through the screen-packed matrix were obtained from the temperature and pressure measurements, the heat transfer and friction loss results were presented in terms of Nusselt number Nu and friction factor 5 respectively. Definitions of Re, f and Nu are given by
Re = ( tif dJ( /J&E) (10)
.f= ZAP* pd,
(rir-/Af~)* L
(11)
Nu = hd,,lkf (12)
Test conditions
and error analysis
In the present study using the single-blow method, the heat transfer and pressure measurements were performed on three regenerators at a range of Re from 39 to 225. The oversize in wire screen for these three test regenerators var- ies from 0.05 mm to 0.55 mm. To estimate the uncertainties
Table 2 Uncertainty analysis for experimental data Parameter Uncertainty (%) px 0.38 T+ 0.054 P 0.384 mf 3.05 zr Lh 2.88 1.03 0.167 h 3.93 A NYU, 3.07 2.23 Re 4.32 f 6.63 Nu 5.66
in the measured quantities, an uncertainty analysis with a 95% confidence interval was carried out according to the method described in Kline and McClintock”. Based on the error analysis, uncertainties of measured parameters are listed in Table 2. The best estimate of uncertainties in f and Nu are 6.63% and 5.66%, respectively.
Results and discussion
Three regenerators A, B and C in this study were tested. Figure 6 shows the measured inlet and exit air temperatures as well as the predicted exit air temperature curves with three different combinations of NTU, and NTU, values plotted against time for Re = 148.56 for the test regenerator B. In Figure 6, actual measured and predicted exit tempera- ture curves have the same maximum slope value, S max = 2.55. The one with NTU, = 148.2 and NTU, = 0.13 is the best match. As mentioned earlier, the relationship between S,,, and NTU, is unique for a fixed value of NTU,. Therefore, the hybrid-match method can be used to determine both NTU, and NTU, values by matching a predicted exit air temperature curve with the actual meas- ured one. From this figure, it is apparent that the NTU,m value for the actual exit temperature curve (NTU, = 148.2) at S,,, = 2.55 is significantly larger than the NTU, value
S,,,=2.55, JTC=-0.032
0.75 ti NTU,=175.4,NTU,=0.2 0.00 0.0 0.5 1.0 1.5 2.0 2.5 3.0 tFigure6 Curve matching between measured and predicted exit fluid temperature histories of regenerator 6 at Re = 148.56, S max = 2.55 and JTC = -0.032
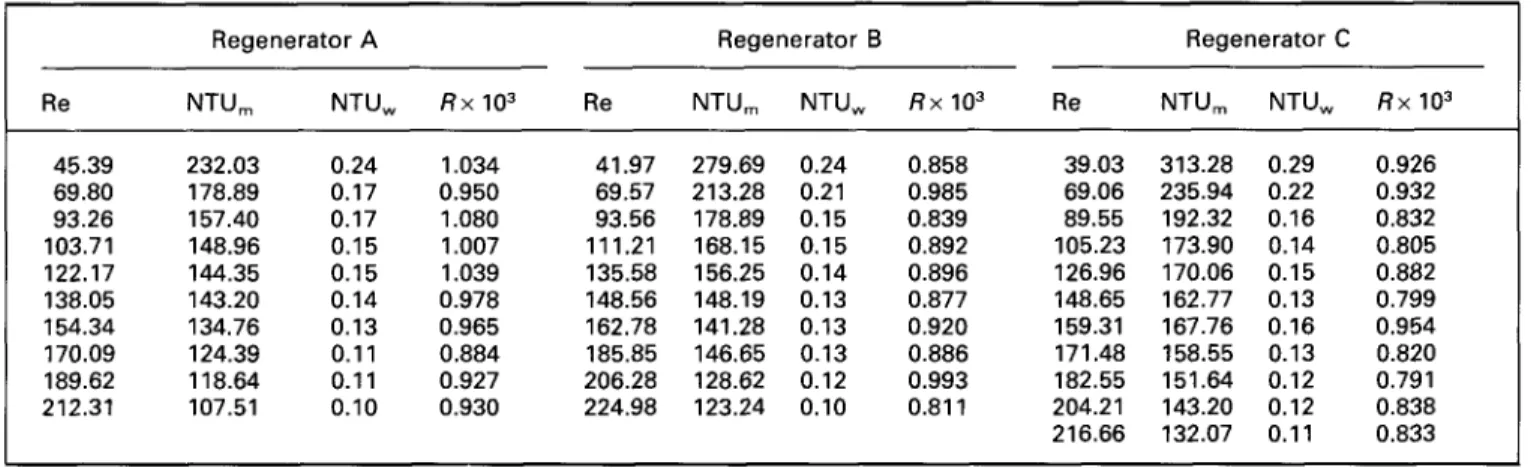
Regenerator thermal performance: P.-H. Chen et al. Table3 NTU, and NTU, values of test regenerators A, B and C (R=NTU,/NTU,)
Regenerator A Regenerator B Regenerator C
Re NTU, NTU, Rx103 Re NTU, NTU, Rx103 Re NTU, NTU, Rx lo3
45.39 232.03 0.24 1.034 41.97 279.69 0.24 0.858 39.03 313.28 0.29 0.926 69.80 178.89 0.17 0.950 69.57 213.28 0.21 0.985 69.06 235.94 0.22 0.932 93.26 157.40 0.17 1.080 93.56 178.89 0.15 0.839 89.55 192.32 0.16 0.832 103.71 148.96 0.15 1.007 111.21 168.15 0.15 0.892 105.23 173.90 0.14 0.805 122.17 144.35 0.15 1.039 135.58 156.25 0.14 0.896 126.96 170.06 0.15 0.882 138.05 143.20 0.14 0.978 148.56 148.19 0.13 0.877 148.65 162.77 0.13 0.799 154.34 134.76 0.13 0.965 162.78 141.28 0.13 0.920 159.31 167.76 0.16 0.954 170.09 124.39 0.11 0.884 185.85 146.65 0.13 0.886 171.48 158.55 0.13 0.820 189.62 118.64 0.11 0.927 206.28 128.62 0.12 0.993 182.55 151.64 0.12 0.791 212.31 107.51 0.10 0.930 224.98 123.24 0.10 0.811 204.21 143.20 0.12 0.838 216.66 132.07 0.11 0.833
in the case of an adiabatic side wall (NTU, = 108.4). Therefore, prior studies assuming an adiabatic side wall underestimate NTU, by around 26.8%. Such evidence from the present measured results strongly indicates that the assumption of an adiabatic side wall should not be made when using the single-blow method to determine the ther- mal performance of test regenerators with high NTU, values. Another study using the single-blow method con- ducted by Mullisen and Loehrke8 showed a larger side wall temperature rise for an increase in the NTU, value, which also suggests that adiabatic side wall assumption is not valid for test regenerator with high NTU, values. Mullisen and Loehrke 8 did not propose an improved model for solv- ing this problem.
The measured NTU, and NTU, values at given Re values are listed in Table 3. Note that the ratio of NTU, to NTU, (R) varies slightly with the Reynolds number for each regenerator. The average ratio of NTU, to NTU, for regenerators A, B and C are 9.79 x 10m4, 8.90 x lOA and 8.56 x 10m4, respectively. This ratio decreases slightly with an increase of the oversize of the test regenerator, most likely because the heat transfer area between the tube and the fluid decreases with increase in oversize in wire screens.
Figure 7 shows the relationship between f and Re for runs conducted with varying flow rates. It is apparent that the friction factor decreases with the Reynolds number. At the same Reynolds number, it is expected that regenerator C has the largest friction factor among the three regener-
.RegeneratorA,f=174.1/Re+2.645 ARegeneratorB,f=170.4/Re+2.757
l RegeneratorC,f=169.1/Re+2.843
Re
Figure7 Correlation between f and Re Figure8 Correlation between Nu and Re
ators because it has the largest oversize in wire screens packed into the tube. Accordingly, the flow leakage through the inner circumference of the tube is reduced with increase in oversize in wire screens. To correlate the measured data offversus Re using the least-squares fit method, the empiri- cal correlations for the three regenerators are given by
174.1 ‘= __ Re + 2.645 for regenerator A (13) 170.4 f= ~ Re + 2.757 for regenerator B (14) 169.1 ‘= __ Re + 2.843 for regenerator C (15)
Figure 8 shows the relationship between Nu and Re for the test regenerators. For comparison, experimental data for test regenerators packed with 40 wire screens obtained from Hamaguchi et ~1.~ are also presented. Various screen- packed regenerator matrices with mesh numbers ranging from 10 to 250 were tested in their study.
As indicated in Figure 8, the heat transfer rate increases with the flow rate. The empirical correlations for Nu versus Re for the three regenerators are given by
Nu = 0.483 Re”-548 for regenerator A (16)
Nu = 0.549 Re”-5”s for regenerator B (17)
IO’ Nu / I” I o RegeneratorA, Nu=0.483Re0.548 l Regenerator 8, Nu=0.549Re0535 A RegeneratorC,Nu=0.575Re054' --Hamaguchietal.(1983), Nu=0.570Re0"8 I /.I I 200 60 Re
Regenerator thermal performance: P.-H. Chen et al.
Nu = 0.575 Re0.541 for regenerator C (18) where the regenerator C has values closest to those of Ham- aguchi et cd.*. The small discrepancy between the measured results of both studies is possibly caused by the difference in the number of wire screens packed into the regenerator matrix, 40 in their study but 560 in the present study. Nevertheless, further studies should be conducted to ident- ify the exact cause of such a discrepancy. The regenerator with the largest oversize in wire screens has the highest heat transfer rate when the Reynolds number is fixed. This is probably due to the fact that an increase in oversize in wire screens reduces the leakage flow between the tube wall and the screen-packed matrix.
Conclusions
An improved model for the single-blow method was pro- posed to evaluate the thermal performance of cryocooler regenerators. Effects of heat transfer from the fluid flow into the tube wall and the Joule-Thomson expansion were included in this model. A hybrid method including both curve-matching and maximum-slope schemes was also pro- posed in the present study to determine NTU, and NTU, values.
An experimental system was set up to measure thermal and friction loss characteristics of three regenerators with screen-packed matrices with different oversize values. The Reynolds numbers for the single-blow measurements ranged from 39 to 225. Empirical correlations of friction factor and Nusselt number versus Reynolds number were
presented for all three test regenerators. For the oversize in the screen-packed matrix ranging from 0.05 mm to 0.55 mm, the regenerator with the largest oversize in the screen-packed matrix had the best thermal performance but the largest friction factor among the three test regenerators. A drop in oversize in the wire screen from 0.55 mm to 0.05 mm resulted in a decrease in heat transfer performance of the regenerator matrix on average of 17%.
Acknowledgements
The partial financial support of this study by the Energy Council under Grant No. 83226 is deeply appreciated.
References
I 2 3 4 5 6 I 8 9 10 11Walker, G. and Vasishta, V. Ad Clyo Eng (1971) 16 324-332
Hamaguchi, K., Takahachi, S. and Miyabe, H. JSME, Series B (1983) 49 2001-2010 (in Japanese)
Tanaka, M. Proc 6th [SEC, Eindhoven (1993) 353-358
Jones, J.D. ASME J Eng Gas Turbines and Power (1989) 111 595-600
Tanaka, M., Yamashita, I. and Chisaka, F. JSME Int J, Series II
(1990)33 283-289
Pucci, P.F., Howard, C.P. and Piersall, C.H. ASME / Eng Power ( 1967) 89 29-40
Liang, C.Y. and Yang, W.J. ASME J Heat Transfer (1975) 97
16-21
Mullisen, R.S. and Loehrke, R.I. ASME J Heat Transfer (1986) 108 370-376
Cai, Z.H., Li, M.L., Wu, Y.W. and Ren, H.S. Int J Heat Mass Transfer (1984) 27 971-978
Chen, P.H. and Chang, Z.C. Proc Inst Mech Eng, Part C J Mech
Eng Sci, in revised