行政院國家科學委員會補助專題研究計畫成果報告
高屏海域陸海交互作用(I)—子計畫二:
高屏附近海域浮游橈足類群聚之分布及攝食之研究
The distribution and grazing of planktonic copepods in the coastal
waters off Kaoping River, Southwest of Taiwan.
計畫類別:□個別型計畫
■整合型計畫
計畫編號:NSC 90-2621-Z-110-008
執行期間:90 年 08 月 01 日至 91 年 07 月 31 日止
計畫主持人:洪 佳 章
共同主持人:羅 文 增
本成果報告包括以下應繳交之附件:
□赴國外出差或研習心得報告一份
□赴大陸地區出差或研習心得報告一份
□出席國際學術會議心得報告及發表之論文各一份
□國際合作研究計畫國外研究報告書一份
執行單位:國立中山大學
海洋資源學系
中華民國 91 年 11 月 15 日
高屏海域陸海交互作用(II)—
高屏附近海域浮游橈足類群聚之分布及攝食之研究
執行單位:國立中山大學海洋資源學系 計畫編號:NSC90-2621-Z-110-008
計畫主持人:羅 文 增 共同主持人: 研究人員:黃祥豪、謝泓諺、洪禹邦 聯絡方式:高雄市蓮海路 70 號 國立中山大學海洋資源學系 E-Mail: [email protected]一、中文摘要
本研究是探討高屏附近海域浮游橈足類的時空分佈及其與環境因子之相關性以及 對浮游植物之攝食衝擊程度。由 1999 年 9 月至 2001 年 6 月期間每季採樣分析結果, 共發現 4 目 19 科 100 種橈足類 (其中 23 種僅鑑定到屬),平均豐度為 417±398 ind./m3。前 6 個主要優勢種橈足類為 Temora turbinata、Acrocalanus spp.、Paracalanus spp.、Copepodite、Farranula gibbula 及 Oncaea venusta,合佔橈足類總數的 58 %,其中 T. turbinata 即佔總數 20 %。近岸測站橈足類豐度有明顯的季節及年度間的變化, 且一般都較遠岸測站高。夏秋季時橈足類的豐度通常較冬季高,遠岸測站表層和 0~100m 水層橈足類的豐度差異不大,但在 0~100m 水層之種類數目明顯較表層多。橈 足類之豐度一般和鹽度呈顯著的負相關和葉綠素 a 呈顯著的正相關,而和溫度無顯著 相關性,推測高屏海域橈足類群聚可能受到沿岸湧升流、水團變化及陸源水影響。高 屏海域橈足類對於浮游植物之攝食衝擊並不高,在夏季 (6 月) 時介於 0.90~1.25 % /day,乾季 (11 月) 時則介於 0.44~4.55 % /day。 關鍵詞︰橈足類、季節分佈、高屏海域、攝食衝擊
Abstr act
This research aims to investigate seasonal and spatial distribution of planktonic copepods in relation to environmental factors in the Kaoping coastal waters, and their feeding impact on phytoplankton from September 1999 to June 2001. In total, 77 species of copepods belonging to 19 families and 4 orders, plus 23 unidentified species, were found, with the mean abundance of 417±398 ind./m3. Temora turbinata, Acrocalanus spp.,
Paracalanus spp., unidentified copepodites, Farranula gibbula and Oncaea venusta were the
six most dominant species, contributing to 58% of the total copepod abundance, among them,
T. turbinata was the most abundant species (20% of the total catch). The inshore stations
displayed obviously seasonal and interannual variations in abundance of copepods, and were higher than that at offshore stations. The abundance of copepods was generally higher in summer and fall and lower in winter. There was no significant difference in the abundance of copepod between surface water and 0~100 m water column, but higher copepod species number was always found in the 0~100 m layer. Most copepods showed significantly negative correlation with salinity and significantly positive correlation with chlorophyll a but
no significant correlation with temperature. It was probably interpreted that the community
structure and distribution of copepods in this study were influenced by coastal upwelling, change of water mass and river effluence. The grazing impact of copepods on phytoplankton was miner, it was 0.90~1.25%/day in June and 0.44~4.55/day in November.
Keywor ds: Copepod, Seasonal distribution, Kaoping coastal waters, Grazing impact.
二、緣由與目的
橈足類在海洋浮游動物群聚中經常是最優勢的類群,其在海洋生態食物鏈中是屬 於次級生產者的角色,大多以浮游植物為食(Nybakken, 1997; Pechenik, 1991)。近年來 橈足類在海洋生態系的重要性已廣泛地受到海洋生物學者的瞭解與重視,尤其是其對 浮游植物族群之攝食衝擊及物質通量之影響;例如,Miller, et al. (1991)在北太平洋亞 極區海域、Landry, et al. (1994)在南加州海灣所做之結果、及 Dam, et al. (1994)參與 JGOFS (the Joint Global Ocean Flux Study)計畫在赤道太平洋海域之研究均證明了此論 點。同樣地,浮游橈足類亦為其他海洋較高營養階動物之食物,故其在海域中之分布 情況亦會直接影響魚類資源動態。綜合以上所言,足可知浮游橈足類在海洋食物鏈中 對於物質與能量之傳輸,實占有不可或缺之地位。 海洋浮游性橈足類群聚組成之消長及分布易受環境因子變化之影響,尤其是在陸 海河交界水團變動頻繁之沿岸海域。當海域環境狀況或條件改變時,生物群聚組成經 常就會出現一定程度的變異;因此在不同的水團或環境條件下,自然就會出現一些不 同 的 種 類 組 成 , 例 如 Calanus finmarchicus 是 溫 寒 帶 大 洋 常 見 的 種 類 (Colebrook, 1982),Acartia tonsa 常在溫帶河口地區出現(Cervetto et al., 1999);而 Eucalanus bungii
bungii 則是北太平洋親潮的外洋冷水域中特有種之一(Yamaji, 1991)。地區性氣壓變動
所造成的季風亦會影響橈足類的分布,例如 Stephens et al. (1998)對於北大西洋震盪 (North Atlantic Oscillation, NAO)與C. finmarchicus 的分佈情形進行研究,並指出 NAO
的方向會影響到海流流向,間接使得 C. finmarchicus 的分布擴散至某些海域。在台灣 早期關於橈足類之研究十分缺乏,僅有 Tan (1967) 及 Tseng (1972)進行概略性的研 究;近幾年來才有較多的學者參與,例如,Shih and Young (1995) 首次收集並編輯台 灣附近海域橈足種類之區系名錄,其他有關橈足類之研究包括有:日週性垂直遷移(Su, 1996)、與仔稚魚之相關性(Cheng, 1998)、種類多樣性與水團的關係 (Shih and Chiu, 1998)、河口域之分布(Hsieh and Chiu, 1998)及其與季風之關係(Chen, et al., 1998)等,均
已陸續被發表。
近數十年來,已有很多學者從事有關橈足類攝食的研究,由於浮游橈足類多為草 食性,因此對於其攝食的研究,多半與浮游植物有關。Strickland and Parsons(1967) 在早期以色素分析來估算浮游植物的生物量,Nimoto(1968)亦以草食性橈足類腸色素 分析法來估計對浮游植物的攝食量,而 Mackas and Bohrer(1976)更以腸內螢光值停留 及衰減的時間來推算草食性橈足類對浮游植物的攝食速率。之後,許多有關橈足類腸 螢光色素分析研究陸續被發表,例如,橈足類的攝食狀況(Mackas and Bohrer, 1976)、 攝食時間(Dagg and Grill, 1980)、攝食地點(Dagg and Wyman, 1983)、影響食物通過腸道 的原因(Dagg, 1993)、橈足類的食性與生活型態(Atkinson et al., 1996; Sautour et al., 2000),或是影響腸螢光色素分析法的原因(Kiørboe and Tiselius 1987 ; Merrell and Stoecker, 1998)等。國內在近幾年亦開始有相關的研究進行,例如 Hwang et al. (1998)
在台灣北部海域的研究發現,橈足類的腸色素含量及攝食速率隨著種類不同及海域葉 綠素 a 濃度的改變而有很大的變化。而李(1999)及葉(2000)在台灣西南海域研究結果發 現,該區所測得之橈足類腸含量明顯較其他文獻(Bautista and Harris, 1992; Morales et al., 1991)之結果低。 台灣西南沿岸海域位於北回歸線以南,西北方有澎湖水道連接台灣海峽,東南方 有巴士海峽與太平洋連接,西南方為南海,高屏峽谷則是由高屏溪口向西南延伸至南 中國海盆,因此高屏海域的水文特性主要是受南海及附近沿岸河川淡水所控制 (黃 等,1993)。綜合多位學者對南海東北部、高屏峽谷海域及台灣海峽水文特性之研究發 現,台灣海峽大致受三種水團影響,分別為黑潮支流、大陸沿岸水及南海水,而高屏 海域則受黑潮支流及南海水的影響較多 (Fan and Yu, 1981; Fan, 1982; Shaw, 1989),
如此高變動的水文因子可能是影響橈足類分佈及組成的重要因子。因此,本研究之目 的在了解高屏溪口及附近海域浮游性橈足類之種類組成及豐度在測站上或季節性的分 佈狀況,並探討其與水文之相關性;此外,亦測定浮游橈足類之腸色素含量,並估算 其對浮游植物之攝食速率及攝食衝擊程度,並進一步探討其在海洋生態系中對碳傳輸 之貢獻。
三、採樣及研究方法
A. 浮游動物之採樣方法 本研究是在 1999 年 9 月至 2001 年 6 月期間,利用海研三號航次分別於 3 月 (春)、6 月(夏)、9 月(秋)及 12 月(冬)白天於高屏海域的五個測站(Figure 1)以一公尺網 (網徑 1 公尺,網長 4.5 公尺,網目 330 µm)進行近表層(0~5m)之水平拖網,每次拖網 約 10 分鐘,船速均維持在兩節左右,網口中央繫一流量計以估算過濾之水體積;2001 年 6 月測站 3 因在軍事演習而未採得樣品。2000 年 9 月至 2001 年 6 月四個航次,亦 在外海測站 (測站 4 及測站 5) 增加 0~100m 斜拖採樣,以便比較表水層跟 100 公尺水 層橈足類之分佈情形,兩年總共採得 47 個樣品。採得之浮游動物樣品均在船上直接以 5~10%之中性福馬林(PH=7.4~7.6)固定保存。每次採樣前亦以海研三號上之溫鹽深 儀測定海水之溫度、鹽度及螢光值等;另外亦採取一公升表水樣品置入暗瓶冷藏,俾 便進一步測定水體葉綠素 a 之濃度。 浮游橈足類腸淨空速率實驗是在 2001 年 6 月及 11 月進行,分別在近河口之測站 2 及遠岸之測站 4 及 5 多做一次拖網採樣,隨後即以過濾海水清洗過後,將橈足類快 速置入經玻璃纖維濾膜(Whatman GF/F)過濾之海水缸內,並馬上以濾網撈取約 500 隻 橈足類,放入封口袋中送入液態氮筒內保存,之後每 5~10 分鐘間隔同樣以網過濾後置 入液態氮桶內冷凍保存,每次實驗持續約 1~2 小時。樣品帶回實驗室後改以-20℃之恆 溫冰箱蔽光保存,以便進一步進行橈足類腸螢光色素之分析。 B.浮游動物之鑑定計數及資料分析 浮游動物大類之鑑定及計數是先以分樣器將中性福馬林保存之浮游動物樣品視量 分成 1/2 1/8 之子樣品後,再置於解剖顯微鏡下計數各主要組成大類的數量。對於橈 足類則取約含 500 個橈足類個體之子樣品,置於光學顯微鏡下進行鑑定,並儘可能鑑定至種或屬。本研究除了依目的進行基礎之圖表分析外,亦利用複迴歸分析法來探討 水體溫度、鹽度及葉綠素 a 等環境因子與橈足類豐度間的相關性。 C. 葉綠素a 濃度及浮游橈足類腸色素之測定分析 攜 回 之 冷 凍 樣 品, 包 括 浮 游 動 物 及 海 水 過 濾 後 之 樣 品, 均 照 Strickland and Parsons (1967)之方法來測定熒光色素。水樣葉綠素a 濃度測定,是以濾膜(孔徑 0.45μ m,濾膜半徑 20mm)過濾 500ml 的海水後,將濾膜置入 5ml 之 90%的丙酮內,並放入-20℃之恆溫冰箱蔽光保存 24 小時使其充分萃取葉綠素後,以離心機速率 3300rpm 離 心 20 分鐘,取上層液以螢光光度計於加酸前後(0.1N HCl) 測量吸光值,再計算得到葉 綠素 a 濃度。浮游動物樣品亦參考 Dagg and Walser (1987)及 Morales et al. (1991)之方 法,在紅色微光顯微鏡下儘速依個體大小挑揀一定數量之橈足類分別加入 90%丙酮 (約 10 ml)後,置黑暗中 24 小時俾便充分萃取,然後用離心機(3300 rpm)離心約 20 鐘後,再以熒光光度計量測上層之萃取液在加酸(約兩滴 10% HCl)前及後之熒光值。 由上述實驗可得現場海水及浮游動物體內熒光色素之數值,以及經一段時間後之色素 衰減值,浮游動物腸色素之瞬時淨空速率乃應用 Mackas and Bohrer(1976)之公式計 算,而浮游動物之攝食速率則由現場新鮮之浮游動物腸色素均值乘以瞬時淨空速率而 得。
四、結果
高屏海域水文環境之季節變化
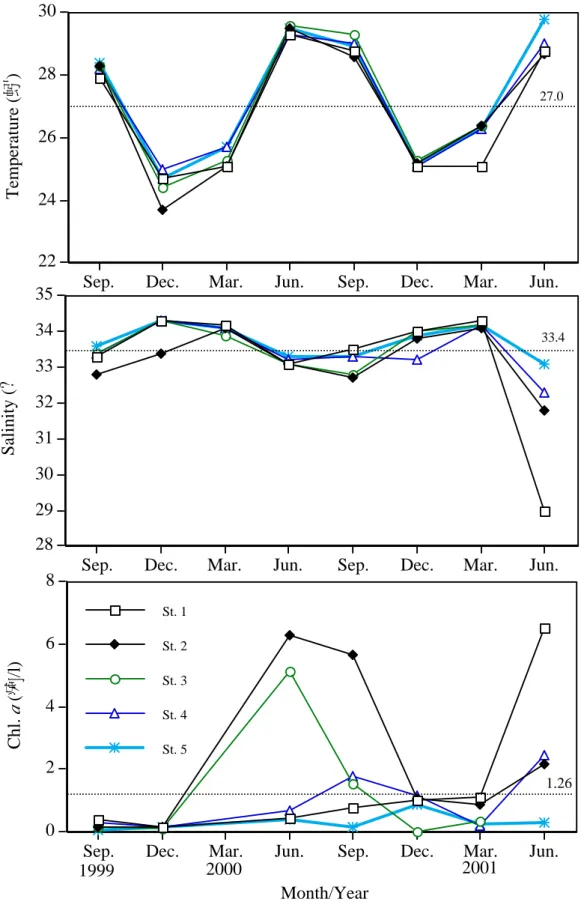
高屏海域水表層溫度有明顯的季節變化(圖 1),夏季及秋季時水溫經常超過 29℃ 及 28℃,而冬季及春季時之水溫則多在 24℃及 26℃之間。遠岸測站水溫一般較近岸 測站高,最高表水溫是出現在 2000 年夏季的遠岸測站 5 (29.8℃);最低在 1999 年冬季 的河口測站 2 ( 23.7℃)。高屏海域表水鹽度變化介於 29.0~34.3‰ 間,亦有明顯的季節 變化,但和水溫呈相反趨勢,近岸測站鹽度一般較遠岸測站低,尤其是在 2001 年夏季 靠近高雄港口外的測站 1,鹽度僅 29.0‰ ,較高值通常是出現在冬季或春季的遠岸測 站(34.2 ‰ )。葉綠素 a 濃度變化在 0.1~6.5µg/L 之間,夏季或秋季時偶爾會出現較高濃 度,離岸測站之葉綠素 a 濃度相對較低。橈足類種類組成及豐度之季節分布
由研究期間於高屏海域採得之樣品分析結果,共發現 4 目 19 科 100 種浮游性橈足 類 (包含 23 種僅能鑑定到屬),平均豐度為 417±398 ind./m3
(Table 1)。在本研究海域 中所發現前 20 種優勢種橈足類如表 7 所示,其中排名前 6 種為 Temora turbinata、
Acrocalanus spp.、Paracalanus spp.、Copepodite、Farranula gibbula、Oncaea venusta
等,此 6 個優勢種佔總橈足類豐度 57.8%。其中 T. turbinate(佔總豐度 20.4 %)體長介於 1.0~1.7 mm 間,而Acrocalanus spp. (13.5 %)體長介於 0.9~1.3 mm 間,此兩種出現率均 在 82 %以上,是本研究海域中相當常見種類。在其他優勢種中,除 U. vulgaris 為大型 種 (體長大於 2 mm) 外,其餘多為中小型種。 近岸測站 (測站 1、2 及 3)的豐度有明顯的季節及年度間的變化,且一般都較遠岸 測站 (測站 4 及 5)高(Figure 3)。例如,位於高雄港外的近岸測站 1 在 2001 年夏季時出 現最高豐度 (1805 ind./m3 ),在 1999 年秋季時出現次高豐度,但是在 1999 年冬季及 2000 年秋季時則明顯偏低,季節間豐度變化差異達 60 倍之多。位於高屏溪河口的測 站 2 之季節及年度間的變化趨向和測站 1 相似,測站 3 的豐度亦以冬季時最低,但年 度間的變化較大,並以 2000 年各季的豐度相對較高。遠岸測站橈足類豐度並無明顯一 致性的季節變化,且變化幅度相對亦較近岸測站小,表層和 0~100m 水層間亦無明顯 一致性的差異(Figure 3)。各測站橈足類種類數目介於 17~40 之間,測站間及季節間的 變化趨向並不一致,但 0~100m 水層的數目均較表層多(Figure 4)。如果以各測站所發 現的總種類數目來看,測站 2 的種類數目最多 (70 種),遠岸測站 (測站 4 及 5) 亦有 66 種,最低則是測站 3 (54 種)。
優勢種的時空分布
前六個主要優勢種在測站間及季節間的變化頗大且不一致(Figure 5)。第一優勢種 (T. turbinate)以夏秋季之豐度較高而冬季則偏低,尤其是在 1999 年秋季時的近岸測站 1 出現最高豐度,達 1113 ind./m3,並有明顯向南岸及遠岸遞減的現象;在 2000 年 春、夏及秋季時亦均以近岸測站 3 豐度最高。第二優勢種(Acrocalanus spp.)亦以夏秋 季之豐度較高而冬春季較低,尤其是在 2000 年秋季時的近岸測站 2 及 3,豐度分別達 401 ind./m3及 379 ind./m3,並有明顯向遠岸遞減的現象。第三優勢種(Paracalanus spp.) 在 2000 年秋季之前的豐度均明顯偏低,之後則逐季增加,冬季時在遠岸的測站 5 出現 較高豐度,夏季則以近岸測站 1 最高。居第四優勢量的橈足類幼生(Copepodite),其豐 度一般在春夏季時較高,近岸測站的豐度亦較遠岸測站高。第五優勢種 F. gibbula 在冬季時之豐度普遍偏低,爾後之後則逐季增加,夏及秋季時位於河口的測站 3 及測站 4 經常出現較高豐度,但年度間亦有頗大的差異。第六優勢種O. venusta 是相當常見的 種類,出現率達 97%,其豐度在時空上之變化幅度不大,但是似乎有逐年增加的趨 向,並以春季時之豐度相對較高。
浮游橈足類豐度與環境因子相關性
以複迴歸分析結果(Table 2)發現,橈足類總豐度分別和鹽度及葉綠素 a 呈顯著的 負相關及正相關 (p<0.001),而和溫度則無顯著相關性。至於在前 6 個主要優勢橈足 類,除了 T. turbinata 及 O. venusta 外,其他種類皆與鹽度有顯著的負相關 (p<0.01), 而和葉綠素 a 呈顯著正相關 (p<0.05);溫度方面則僅 F. gibbula 與溫度呈顯著正相關 (p<0.01),其餘優勢種均無顯著相關性。浮游橈足類對浮游植物之攝食速率
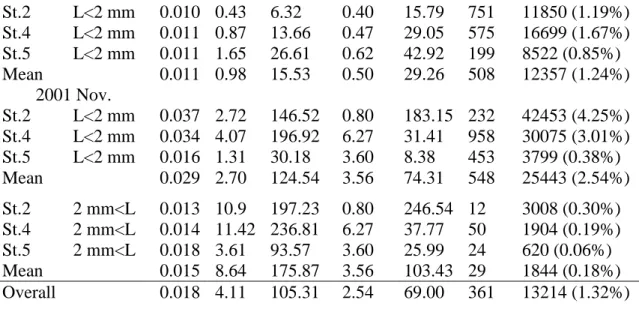
高屏海域橈足類之攝食速率有明顯的季節及近遠岸間之差異(Table 3)。11 月時所 測得小型橈足類(L<2mm)之腸排空率 (k)均值(0.029/min)較 6 月份(0.011/min)高出約 3 倍,腸色素含量 (G) 也相差約 3 倍 (各為 2.70 及 0.98 ng chl. a/ind.),而所估算攝食速 率 (I) 則相差約 8 倍,(各為 15.53 及 124.54 ng chl. a/ind./day)。在近遠岸方面,6 月 時近岸測站所測得之攝食速率值相對較遠岸測站低,11 月時則以測站 4 最高,測站 5 最低。在 11 月所測得之大型橈足類(2mm L)腸排空率(為 0.015 /min) 較小型橈足類 低,腸色素含量(為 8.64 ng chl. a/ind)則高出約 3 倍,而攝食速率(為 175.87 ng chl. a/ind./day) 僅高出約 40%。近遠岸方面,濾食速率以測站 4 最高,測站 5 最低。橈 足類對浮游植物之攝食衝擊會因橈足類的豐度及水域中浮游植物濃度變化而有頗大差 異 ,經 估算結果發 現單位 水體積內整體橈足類 對浮游植物之攝食衝 擊並不大(僅 1.32%),在 6 月時橈足類之攝食衝擊 (FA) 介於 0.90~1.25 % day 之間,但在 11 月則 介於 0.44~4.55 % day 間,小型橈足類對浮游植物之攝食衝擊程度(2.54%)明顯較大型橈 足類(0.18%)高出許多。五、討論
季節性及測站間的變化
高屏海域近岸測站浮游橈足類的豐度有明顯的季節及年度間的變化,且一般都較 遠岸測站高,夏秋季之橈足類平均豐度較高,而冬季時較低(Figure 3)。黃等 (1991)在福建羅源灣中對橈足類季節分布研究亦有相似的結果,均以夏季時豐度最高。朱等 (1993) 在福建東山灣之研究發現,浮游動物在冬季及夏季均有高豐度值,並以橈足類 所佔比例最高,其推測浮游動物豐度之所以出現雙高峰,可能是由於不同季節沿岸高 低溫水團的變動造成夏季及冬季浮游生物族群消長所致,此現象在福建沿海亦相當常 見,且夏季高峰期的形成也和沿岸湧升流有相當大關係。根據張 (2000) 在高屏海域 流場特性的研究中指出,春末至秋季時高屏沿岸表層淨流多為東南流,且因科氏力作 用會將沿岸水帶往外海,而有利於湧升流生成。本研究發現夏秋季時測站2、3及4的葉 綠素a濃度值一般較其他測站高,而測站2及3的橈足類亦有高豐度值出現,推測湧升流 可能是造成橈足類高豐度的原因之一。此外,在春季時東北季風減弱,黑潮入侵現象 亦逐漸減少,夏秋季時則因西南季風盛行使得南海表層水延展至高屏海域,加上正值 濕季因降雨量增加使得沿岸海域鹽度偏低,使得T. turbinata、F. gibbula、O. venusta及
C. furcatus等能適應較低鹽度的暖水類群 (蔡等,1994;蔡等,1995) 數量明顯增加。
Rios-Jara (1998) 在Phosphorescent Bay的浮游動物族群之時空變化研究中亦指出,沿岸 河口域常在降雨後因河川沖刷帶入大量營養鹽,造成浮游植物及浮游動物(尤其是橈足 類)豐度增加。Toru and Tsutomu (2001) 於親潮海域的研究中亦發現,在春季藻華時
Neocalanus plumchrus橈足類幼體會大量增加。Hwang et al. (2000) 及藍等 (2002)分別
於南海東北部及淡水河鄰近海域進行的橈足類研究,亦發現近岸或河口附近測站的橈 足類豐度較遠岸測站高,並推測可能是受淡水注入影響,致使近岸或河口海域含有高 量營養鹽及較高豐度的浮游動物。這些結果在本研究中亦得到印證,尤其是在濕季時 近河口及沿岸海域,橈足類豐度常因葉綠素 a 濃度增加而有明顯增加的現象。 在乾季(冬春季)時,高屏海域橈足類的種類組成及豐度變化主要受到沿岸水團 及潮汐流影響;根據蘇 (1998) 及 Chen (1998)的研究結果顯示,高雄沿岸水域漲潮時 流向是由西北向東南走向,退潮時則為東南向西北走向。本研究於春季日間採樣時多 為漲潮,最南端的測站 3 可能因沿岸潮流東南走向帶來富營養的高屏溪水而造成橈足 類數量相對較北岸測站多;位於高雄港外之北岸測站 1 因地形的關係剛巧位於近遠岸 水流屈折處,漲潮時會引入較貧營養鹽的外洋水而使得橈足類數量相對較低;冬季採 樣時多為退潮,則以最北端測站 1 橈足類豐度較高,而種類數目上也有類似趨勢。我 們之前在高屏海域所做的橈足類日夜分佈研究結果(Lo et al., 2001)亦得知,冬季時偏南 測站(楓港外海)在日間時橈足類豐度、歧異度及種類數皆較北方測站(高雄港外)高,亦 可能是受沿岸流及漲退潮的變化所致。
浮游動物大多有明顯的日夜垂直遷移行為,白天時會聚集在較深的水層晚上則移 至水表層(Lo and Hwang, 2000; Visser et al., 2001; Grunewald et al., 2002),其可能原因 是 避 免 被 捕 食 (Dawidowicz et al., 1990; Fortier et al., 2001)或 追 求 最 適 光 度 水 層 (Ringelberg, 1993)。浮游動物的垂直遷移行為亦會因不同種類、食物及捕食者而有所 改變 (Bollens, 1996),而相同種類也會因不同地理區、水文環境、季節及生活史而有 所差異 (Pagès and Gili, 1991; Hays et al., 1998)。本研究發現遠岸測站表層和深層的橈 足類豐度差異並不大,但種類數目以深層居多,顯示白天時有較多的種類棲息在較深 水層,此亦可能由於本研究在測站 4 及 5 進行採樣時大多是接近黃昏時,日照強度逐 漸減弱,因此有部分橈足類種類開始向表層遷移所致。Lo and Hwang (2000) 於南海北 部海域之研究結果亦發現大多數浮游動物類群(尤其是橈足類)均有明顯垂直遷移的行 為;Visser et al. ( 2001) 在北海海域進行的研究顯示,Metridia lucens 在白天大多棲息 在水深 60m 水層,夜晚則遷移至表層進行攝食;Grunewald et al. (2002)於智利外海的 研究亦發現較大型橈足類(>1000 µm)在夜晚水表層之豐度及腸色素含量均明顯較高, 顯示橈足類在夜晚有遷移至表層進行攝食的行為。李(1999)於台灣西南海域的研究顯 示,橈足類腸色素含量在下午 4 至 6 點有上升趨勢,顯示日照強度變弱時會促使橈足 類開始上升至表層進行攝食。
浮游橈足類對於浮游植物攝食衝擊之評估
高屏海域浮游橈足類對於浮游植物的攝食衝擊並不高 (0.44~4.55 %/day),此與李 (1999)之研究結果(0.10~1.16%/day)相較下高出約三倍,但與其他相關研究結果差異並 不大,例如,Morales and Harris (1991)於北海海域研究不同體型橈足類的攝食衝擊介 於1.6~3.9%/day之間;Bautista and Harris (1992)於英國Plymouth海域藻華時估算不同體 型橈足類的攝食衝擊介於0.17~8.37%/day之間;Gowen et al. (1999)於西愛爾蘭海域藻 華時估算Temora spp.及Pseudocalanus spp.的攝食衝擊為0.7~8.6%/day;Grunewald et al. (2002)於智利外海估算四種體型橈足類的攝食衝擊則介於1~5%/day之間。至於腸含量 及淨空速率方面,小型橈足類的攝食速率較Grunewald et al. (2002)的研究低1/5,但較 李 (1999) 的研究高出約2倍,惟兩者腸淨空速率則差異不大;大型橈足類之攝食速率 則較Grunewald et al. (2002) 的研究低1/2,但比李(1999)高出3倍且有較高腸淨空速率。 這些差異可能是由於種類不同所致(Hwang et al., 1998),而水域溫度也是重要因素之一 (Kiørboe et al., 1982; Dam and Peterson, 1988),食物的質量亦會影響橈足類攝食模式及其攝食速率 (Head and Harris, 1987; Gowen et al., 1999),例如,Gowen et al. (1999) 於 西愛爾蘭海域進行的研究發現,Temora spp.及Pseudocalanus spp.的攝食速率在藻華時 較高並會隨藻華消失而降低。由於本研究與其他研究橈足類體型及種類不盡相同,地 理及環境因素也不同,因此所估測對浮游植物的攝食衝擊多少有所差異,而6月及11月 間的差異除主要優勢橈足種類不同外,海域中浮游植物量亦是影響估值的重要因素 (兩月份相差約7倍)。綜合言之,高屏海域內橈足類對浮游植物的攝食衝擊程度並不 大,但其優勢的數量在海域生態物質及能量傳遞上仍扮演重要角色。
六、計畫成果自評
本研究已初步達成總計畫預期的目標。所採集之樣品現亦提供 10 位研究生作為 論文研究之題材,針對橈足類、管水母、毛顎類、海月水母及仔稚魚等的種類組成及 分布進行研究,並獲致初步的成果。由於浮游動物群聚種類繁多,無法及時一一鑒種 完成,故以主要浮游動物大類及針對橈足類群聚來探討海陸交互作用可能之影響仍有 其學術及應用價值;去年成果亦已在今年七月舉行之第八屆世界橈足類國際會議(8th ICOC)發表並投稿至中研院動物所刊(SCI)。近年來浮游動物攝食速率研究備受重視, 國外許多學者均積極熱衷探討,並試圖瞭解浮游動物對海洋生態系物質傳輸甚而全球 變遷之貢獻。因此本計畫在大鵬灣及高屏海域針對浮游橈足類進行腸色素之測定分析 研究並已獲豐碩之成果,可提供總計畫生態模式建立之參考。七、參考文獻
Atkinson, A., Ward, P. and Murphy, E.J. (1996). Diel periodicity of subantarctic copepods: relationships between vertical migration, gut fullness and gut evacuation rate. J. Plankton Res., 18: 1387-1405.
Bollens, S.M. (1996). Diel vertical migration in zooplankton-trade offs between predators and food. Oceanus, 39: 19.
Bautista, B. and Harris, R.P. (1992). Copepod gut contents, ingestion rates and grazing impact on phytoplankton in relation to size structure of zooplankton and phytoplankton during a spring bloom. Mar. Ecol. Prog. Ser., 82: 41-50.
Cervetto, G., Gaudy R. and Pagano, M. (1999). Influence of salinity on the distribution of
Acartia tonsa (Copepoda, Calanoida). J. Exp. Mar. Biol. Ecol., 239: 33-45.
Chen, Q.C., Hwang, J.S. and Wong, C.K. (1998). The characteristics of zooplankton in the northern coastal water of Taiwan during the initial period of NE monsoon. J. Taiwan Strait (Taiwan Haixia) 17: 87-90 (in Chinese. With English summary).
Chen, Y.Y. (1998). Investigation of the effect of oil pollution on the ecology and hydrography in the coastal waters of Kaohsiung. Technique Report of National Yat-sen
Cheng, C.C. (1998). The distributional correlation between planktonic copepods and ichthyoplankton in the western North Pacific. M.Sc. Thesis, National Taiwan University.
Colebrook, J.M. (1982). Continuous plankton records: seasonal variations in the distribution and abundance of plankton in the North Atlantic Ocean and North Sea. J. Plankton Res.,
4: 435-462.
Dagg, M. (1993). Grazing by the copepod community does not control phytolankton prodution in the subarctic Pacific Ocean.Prog. Oceanogr., 32: 163-183.
Dagg, M.J. and Grill, D.W. (1980). Natural feeding rates of Centropages typicus females in
the New-York Bight. Limnol. Oceanogr., 25: 597-609.
Dagg, M.J. and Walser, W.E. (1987). Ingestion, gut passage, and egestion by the copepod
Neocalanus plumchrus in the laboratory and in the subarctic Pacific Ocean. Limnol. Oceanogr., 32: 178-188.
Dagg, M.J. and Wyman, K.D. (1983). Natural ingestion rates of the copepods Neocalanus plumchrus and N. cristatus calculated from gut contents. Mar. Ecol. Prog. Ser., 13:
37-46.
Dam, H.G. and Peterson, W.T. (1988). The effects of temperature on the clearance rates constant of planktonic copepods. J. Exp. Mar. Biol. Ecol., 123: 1-14.
Dam HG, Zhang, X., Butler, M., Roman, M. R. (1994). Mesozooplankton grazing and Metabolism on the Equator at 140° W during the JGOFS EQUPAC study. EOS, Trans Am Geophy Union, 75(3): 50.
Dawidowicz, P., Pijanowska, J. and Ciechomski, K. (1990). Vertical migration of
Chaoborus larvae induced by the presence of fish. Limnol. Oceanogr., 35: 1631-1637.
Fan, K.L. (1982). A study of water masses in Taiwan Strait. Acta Oceanogr. Taiwanica, 13:
140-153.
Fan, K. L. and Yu, C. Y. (1981). A study of water masses in the seas of southernmost Taiwan. Acta Oceanogr. Taiwanica, 12: 94 -111.
Fortier, M., Louis, F., Hiroshi, H., Hiroaki, S. and Louis, L. (2001). Visual predators and the diel vertical migration of copepods under Arctic sea ice during the midnight sun. J. Plankton Res., 23: 1263-1278.
Gowen, R.J., McCullough, G., Kleppel, G.S., Houchin, L. and Elliott, P. (1999). Are copepods important grazers of the spring phytoplankton bloom in the western Irish Sea?
J. Plankton Res., 21: 465–483.
Grunewald, A.C., Morales, C.E., Gonzalez, H.E., Sylvester, C. and Castro, L.R. (2002). Grazing impact of copepod assemblages and gravitational flux in coastal and oceanic waters off central Chile during two contrasting seasons.J. Plankton Res., 24: 55–67.
Hays, G.C., Webb, P.I. and Frears, S.L. (1998). Diel changes in the carbon and nitrogen content of the copepod Metridia lucens. J. Plankton Res., 20: 727-737.
Head, E.J.H. and Harris, L.R. (1987). Copepod feeding patterns before and during a spring bloom in Bedford Basin, Nova Scotia. Mar. Ecol. Ser., 40: 221-230.
Hsieh, C.H. and Chiu, T.S. (1998). Copepod abundance and species composition in Tanshui River estuary and adjacent waters. Acta Zoologica Taiwanica, 9: 1-9.
Hwang, J.S., Chen, Q.C. and Wong, C.K. (1998). Taxonomic composition and grazing impact of calanoid copepods in coastal waters of northern Taiwan. Crustaceana, 71:
378-389.
Hwang, J.S., Chen, Q.C., Lo, W.T. and Chen, M.P. (2000). Taxonomic composition and abundance of the copepods in the northeastern South China Sea. Nat'l. Mus. Taiwan Spec. Publ., 10: 101-108.
Kiørboe, T., Mohlenberg, F. and Nicolaajsen, H. (1982). Ingestion rate and gut clearance in the planktonic copepod Centropages hamatus (Lilljeborg) in relation to food
concentration and temperature. Ophelia, 21: 181-194.
Kiørboe, T. and Tiselius, T. (1987). Gut clearance and pigment destruction in a herbivorous copepod, Acartia tonsa, and the determination of in situ grazing rates. J. Plankton Res.,
9: 525-534.
Landry, M.R., Lorenzen, C.J. and Peterson, W.K. (1994). Mesozooplankton grazing in the Southern California Bight. II. Grazing impact and particulate flux. Mar. Ecol. Prog. Ser.,
115: 73-85.
Lo, W.T. and Hwang, J.S. (2000). The diel vertical distribution of zooplankton in the northeastern South China Sea. Nat'l. Mus. Taiwan Spec. Publ., 10: 59-73.
Lo, W.T., Hwang, J.S. and Chen, Q.C. (2001). Identity and abundance of surface-dwelling, coastal copepods of southwestern Taiwan. Crustaceana, 74(10): 1139-1157.
Mackas, D.L. and Bohrer, R. (1976). Fluorescence analysis of zooplankton gut contents and an investigation of diel feeding patterns. J. Exp. Mar. Biol. Ecol., 25: 77-85.
Merrell, J.R. and. Stoecker, D.K. (1998). Differential grazing on protozoan microplankton by developmental stages of the calanoid copepod Eurytemora affnis (Poppe, 1880). J. Plankton Res., 20: 289-304.
Miller, C.B., Frost, B.W., Booth, B., Wheeler, P.A., Landry, M.R. and Welschmeyer, N. (1991). Ecological processes in the Subarctic Pacific: Iron limitation cannot be the whole story. Oceanogr., 4: 71-78.
Morales, C.E., Bedo, A., Harris, R.P., and Tranter, P.R.G. (1991). Grazing of copepod assemblages in the north-east Atlantic: the importance of small size fraction. J. Plankton Res., 13: 455-472.
Morales, C.E. and Harris, R.P. (1991). A review of the gut fluorescence method for estimating ingestion rates of planktonic herbivores. Biol. Oceanogr. Otto., 8: 239-250.
Nimoto, T. (1968). Chlorophyll pigment in the stomach of euphausiids. J. Oceanogr. Soc. Japan., 24: 253-260.
Nybakken, J.W. (1997). Marine Biology: An Ecological Approach. Adision-Wesley Education Publishers Inc., 41-43.
Pagès, F. and Gili, J.M. (1991). Vertical distribution of epipelagic siphonophores at the confluence between Benguela waters and the Angola Current over 48 hours.
Hydrobiologia, 216/217: 355-362.
Pechenik, J.A. (1991). Biology of the Invertebrates. Wm. C. Browm Publishers, 375-381. Ringelberg, J. (1993). Phototaxis as a behavioural component of diel vertical migration in a
pelagic Daphnia. Arch. Hydrobiol. Beih. Ergeb. Limnol., 39: 45-55.
Rios-Jaha, E. (1998). Spatial and temporal variations in the zooplankton community of Phosphorescent Bay, Puerto Rico. Est. Coastal Shelf Sci., 46: 797-809.
Sautour, B., Artigas, L.F., Delmas, D., Herbland, D. and Laborde, P. (2000). Grazing impact of micro- and mesozooplankton during a spring situation in coastal waters off the Gironda Estuary. J. Plankton Res., 22: 531-552.
Shaw, P.T. (1989) The intrusion of water masses into the sea southern of Taiwan. J. Geophys. Res., 94(C12): 18213-18226.
Shih, C.T. and Chiu, T.S. (1998) Copepod diversity in the water masses of the southern East China Sea north of Taiwan. J. mar. Systems, 15: 533-542.
Shih, C.T. and Young, S.S. (1995) A checklist of free-living copepods, including those associated with invertebrates, reported from the adjacent seas of Taiwan. Acta Zool. Taiwanica, 6: 65-81.
Stephens, J.A., Jorden, M.B., Taylor, A.H. and Proctor, R. (1998). The effects of fluctuations in North Sea flows on zooplankton abundance. J. Plankton Res., 20:
943-956.
Strickland, J.D.H. and Parsons, T.R. (1967). A practical Handbook of seawater analysis.
Bull. Fish. Res. Board Can., 167: 1-310.
Su, C.H. (1996). Vertical migration of five dominant copepods in the northern South China Sea. M.Sc. Thesis, National Taiwan Ocean University.
Tan, T.H. (1967). Distribution of biomass and abundance of zooplankton in water surrounding Taiwan. Acta Oceanogr. Taiwanica, 1: 127-136.
Toru, K. and Tsutomu, I. (2001). Ontogenetic vertical migration and life cycle of
Neocalanus plumchrus (Crustacea:Copepoda) in the Oyashio region, with notes on
regional variations in body sizes.J. Plankton Res., 3: 287–302.
Tseng, W.Y., (1972). On Copepoda of the family Candaciidae in the northeast sea-waters of Taiwan. In: Sugawara, K. (ed.). The Kuroshio II. Proceedings of the Second Symposium on the Results of the Cooperative Study of the Kuroshio and Adjacent Regions. Tokyo. September 28-October 1, 1970. Saikon Publishing Comp. Ltd. Tokyo, pp. 245-259.
Visser, A.W., Saito, H., Saiz, E. and Kiørboe, T. (2001). Observations of copepod feeding and vertical distribution under natural turbulent conditions in the North Sea. Mar. Biol.,
138: 1011-1019.
Yamaji, I. (1991). Illustrations of the marine plankton of Japan. Hoikusha, Pub. Co. Ltd.,
538pp. 朱長壽、萬傳龍、陳栩、蘇鳴及林元燒,1993,福建東山灣浮游動物的種類組成和分 佈特點,熱帶海洋,12(3):10-15。 李佳蓉,1999,台灣西南海域草食性橈腳類哲水蚤 (Calanoida) 攝食效應之研究,國 立台灣海洋大學海洋生物研究所碩士論文,pp. 57。 張育嘉,2000,利用船碇式 ADCP 觀測高屏峽谷之流場特性,國立中山大學海洋資源 研究所碩士論文,pp. 96。 黃加祺、李少菁及陳亞萍,1991,福建羅源灣浮橈足類的分布,台灣海峽,10(1):46-51。 黃煌煇等人,1993,高雄海域海氣象調查研究: 台南水工試驗所,研究試驗報告第140 號。 葉曉菁,2000,台南七股潟湖及其附近海域浮游橈足類的種類組成、分佈及其攝食研 究,國立中山大學海洋資源研究所碩士論文,pp. 106。 蔡秉及、連光山、林茂及林玉輝,1994,廈門港及鄰近海域浮游動物的生態研究。海 洋學報,16(4): 137-141。 蔡秉及、連光山、林玉輝、林茂、戴燕玉、林景宏及陳瑞祥,1995,台灣海峽西部海 域浮游動物的基本特徵。海洋學報,17(2): 95-98。 藍揚麒、李明安及石長泰,2002,淡水河鄰近海域橈腳類之種類多樣性與其分布之研 究,2002 年「台灣鄰近海域海洋科學研討會」。 蘇青和,1998,高雄港近岸及港內地區海流特性研究,台灣省政府交通處港灣技術研 究所,pp. 200。
Table 1. The mean abundance (ind./m3), relative abundance (RA, %) and occurrence (OR, %) of the 20 most dominant copepod species in the coastal waters southwest of Taiwan during 1999~2001.
Copepod species Mean abundance ± Std RA OR
Acrocalanus spp. 56.5 ± 90.7 13.5 97 Paracalanus spp. 30.4 ± 64.6 7.3 74 Copepodite 27.8 ± 32.1 6.7 97 Farranula gibbula 22.1 ± 32.7 5.3 82 Oncaea venusta 19.3 ± 19.1 4.6 97 Paracalanus parvus 14.9 ± 45.6 3.6 56 Undinula vulgaris 12.4 ± 43.1 3.0 82 Clausocalanus furcatus 11.5 ± 17.3 2.8 77 Canthocalanus pauper 11.5 ± 12.7 2.7 92 Clausocalanus spp. 11.1 ± 14.5 2.7 92 Acrocalanus gracilis 8.4 ± 13.7 2.0 79 Eucalanus spp. 7.3 ± 21.0 1.7 64 Corycaeus crassussulus 6.6 ± 11.7 1.6 74 Farranula concina 6.6 ± 14.0 1.6 67 Corycaeus pacific 6.0 ± 10.6 1.4 72 Temora discaudata 5.9 ± 8.9 1.4 82 Corycaeus agilis 5.0 ± 8.6 1.2 69 Farranula sp. 4.9 ± 4.1 1.2 92 Oiothona plumifera 4.7 ± 7.4 1.1 64 Other copepods (80 spp.) 58.6 ± 56.8 14.2 Total copepods 417.3 ± 397.7
Table 2. Multiple regression coefficients of the 6 most dominant copepod species in the
coastal waters southwest of Taiwan during 1999-2001. Species as dependent variables are listed in rows and environmental factors as independent variables are listed in columns. * = significance at 0.05 level, ** = significance at 0.01 level, *** = significance at 0.001 level. Temperature Salinity Chl.a Temora turbinata 2.261 -3.654 0.533 Acrocalanus spp. 3.442 -9.623** 10.864** Paracalanus spp. -0.183 -11.127** 3.984 Copepodite 0.588 -13.708*** 5.947* Farranula gibbula 8.033** -6.914** 12.529*** Oncaea venusta -1.336 0.365 0.001 Total copepods 2.860 -27.176*** 18.582***
Table 3. The gut pigment content (G, ng chl a/ind), evacuation rate (k, min-1), ingestion rate (I, ng/cop/day), clearance rate (C, ml/cop/day), annual mean abundance (A, ind./m3) and feeding impact (F, ml/m3/day, %) of copepods and chl a (µg/l) at three sampling stations in
the coastal waters southwest of Taiwan during1999-2000
Station Size K G I Chla C A F 2001 Jun.
St.2 L<2 mm 0.010 0.43 6.32 0.40 15.79 751 11850 (1.19%) St.4 L<2 mm 0.011 0.87 13.66 0.47 29.05 575 16699 (1.67%) St.5 L<2 mm 0.011 1.65 26.61 0.62 42.92 199 8522 (0.85%) Mean 0.011 0.98 15.53 0.50 29.26 508 12357 (1.24%) 2001 Nov. St.2 L<2 mm 0.037 2.72 146.52 0.80 183.15 232 42453 (4.25%) St.4 L<2 mm 0.034 4.07 196.92 6.27 31.41 958 30075 (3.01%) St.5 L<2 mm 0.016 1.31 30.18 3.60 8.38 453 3799 (0.38%) Mean 0.029 2.70 124.54 3.56 74.31 548 25443 (2.54%) St.2 2 mm<L 0.013 10.9 197.23 0.80 246.54 12 3008 (0.30%) St.4 2 mm<L 0.014 11.42 236.81 6.27 37.77 50 1904 (0.19%) St.5 2 mm<L 0.018 3.61 93.57 3.60 25.99 24 620 (0.06%) Mean 0.015 8.64 175.87 3.56 103.43 29 1844 (0.18%) Overall 0.018 4.11 105.31 2.54 69.00 361 13214 (1.32%) 22?0' N 120?0' 120?0' 120?0' E 22?0' 22?0' Kaohsiung Hengchun Fengkang Kaoping River Taiwan 2 3 4 5 1 Taiwan Strait Pacific Ocean L at it u d e Longitude
Figure 1. Map of the coastal waters southwest of Taiwan showing
22 24 26 28 30 Temperature ( 蚓)
Sep. Dec. Mar. Jun. Sep. Dec. Mar. Jun.
28 29 30 31 32 33 34 35 Salinity ( ?
Sep. Dec. Mar. Jun. Sep. Dec. Mar. Jun. 33.4 27.0 0 2 4 6 8 Chl. a (痢 /l)
Sep. Dec. Mar. Jun. Sep. Dec. Mar. Jun. Month/Year St. 5 St. 4 St. 3 St. 2 St. 1 1999 2000 2001
Figure 2. Seasonal changes of surface water temperature, salinity and chl. a in the
coastal waters southwestern Taiwan during 1999-2001. Dash lines indicate annual mean.
0 500 1000 1500 St. 1 0 500 1000 1500 St. 2 0 500 1000 1500 Abundance (ind./m 3) St. 3 0 500 1000 1500 St. 4 0 500 1000 1500 St. 5
Sep. Dec. Mar. Jun. Sep. Dec. Mar. Jun. Month/Year
Figure 3. Seasonal change in numerical abundance of copepods in the coastal
waters southwest of Taiwan during 1999~2001. 100m oblique tow Surface tow
1805
nd
Figure 4. Seasonal change of the copepod species number in the coastal waters
southwest of Taiwan during 1999~2001. 10 20 30 40 10 20 30 40 10 20 30 40 Species number 10 20 30 40 100m oblique tow Surface tow 10 20 30 40
Sep. Dec. Mar. Jun. Sep. Dec. Mar. Jun. Month/Year St. 1 St.2 St. 3 St.4 St. 5 nd 1999 2000 2001
0 200 400 600 Abundance (ind./m 3)
Sep. Dec. Mar. Jun. Sep. Dec. Mar. Jun.
Temora turbinata
1113 0 100 200 300 Abundance (ind./m 3)Sep. Dec. Mar. Jun. Sep. Dec. Mar. Jun.
Acrocalanus
spp. 401 379 0 100 200 300 Abundance (ind./m 3)Sep. Dec. Mar. Jun. Sep. Dec. Mar. Jun. Month/Year
Paracalanus
spp. mean St. 5 St. 4 St. 3 St. 2 St. 1 1999 2000 2001Figure 5. Seasonal change in numerical abundance of the 6 most dominant copepod
0 50 100 150 Abundance (ind./m 3)
Sep. Dec. Mar. Jun. Sep. Dec. Mar. Jun. Copepodite 0 50 100 150 Abundance (ind./m 3)
Sep. Dec. Mar. Jun. Sep. Dec. Mar. Jun.
Farranula gibbula
Figure 5. Seasonal change in numerical abundance of the 6 most dominant copepod
species in the coastal waters southwest of Taiwan during 1999~2001. 0 50 100 150 Abundance (ind./m 3)
Sep. Dec. Mar. Jun. Sep. Dec. Mar. Jun. Month/Year Oncaea venusta mean St. 5 St. 4 St. 3 St. 2 St. 1 1999 2000 2001