Kaohsiung J Med Sci February 2009 • Vol 25 • No 2 53 Cardiac memory (CM) is characterized by persistent
changes in the T wave on electrocardiogram (ECG), which follows the resumption of sinus rhythm after a period of an altered ventricular activation sequence [1,2]. The direction of the change in the T wave vector
is the same as that of the vector of the inciting and abnormally activated QRS complex. Changes in the T wave can be induced by both short and long periods of pacing from the right ventricle and can also occur in a variety of clinical settings that follow abnormal ventricular activation, such as left bundle branch block, ventricular pre-excitation, post-tachycardia syn-dromes and extrasystoles [3–8]. The mechanisms of CM have been widely studied in animal models and in humans. In canines, 4-aminopyridine, which blocks the transient outward current (Ito), can abolish the T wave change after a short period of right ventricular Received: Dec 9, 2008 Accepted: Jan 7, 2009
Address correspondence and reprint requests to: Dr Wen-Ter Lai, Division of Cardiology, Depart-ment of Internal Medicine, Kaohsiung Medical University Hospital, 100 Tzyou 1st Road,
Kaohsiung 807, Taiwan. E-mail: [email protected]
E
FFECT OF
S
HORT
-
TERM
C
ARDIAC
M
EMORY ON
V
ENTRICULAR
E
LECTRICAL
R
ESTITUTION AND
QT I
NTERVALS IN
H
UMANS
Kun-Tai Lee,1,2Chih-Sheng Chu,1,2Kai-Hung Cheng,2Ye-Hsu Lu,2Chih-Hsin Huang,2 Tsung-Hsien Lin,1,2Ming-Chuan Lee,2Sheng-Hsiung Sheu,1,2and Wen-Ter Lai1,2
1Department of Internal Medicine, College of Medicine, Kaohsiung Medical University, and 2Division of Cardiology, Department of Internal Medicine, Kaohsiung Medical University Hospital,
Kaohsiung, Taiwan.
Cardiac memory (CM) can alter the configuration of action potentials and the transmural repo-larization gradient in ventricular tissue. This study evaluated the effects of CM on ventricular arrhythmogenicity. A total of 20 patients (12 females, 8 males; mean age, 46± 13 years) were enrolled. The following indicators were measured to evaluate ventricular arrhythmogenicity: (1) the action potential duration at 90% repolarization (APD90) recorded from the right ventricular apex (RVA); (2) the maximal slope of the action potential duration restitution curve (APDR) con-structed by programmed extra stimuli from RVA; and (3) the maximal corrected QT interval (QTc) and QT interval dispersion (QTd). The short-term CM was induced by constant pacing from the RVA at a pacing cycle length (PCL) of 400 ms for 20 minutes. After induction of CM, the mean APD90were significantly shortened at both PCLs of 600 ms and 400 ms (252.9± 6.4 ms vs. 235.6± 6.4 ms and 231.2 ± 6.4 ms vs. 214.4 ± 7.3 ms, respectively; p = 0.001). No significant change regarding the maximal slopes of APDR were found at both PCLs of 600 ms and 400 ms (1.05± 0.09
vs. 0.96± 0.11 and 0.85 ± 0.08 vs. 0.84 ± 0.09, respectively). QTc (417.3 ± 9.1 ms vs. 454.7 ± 8.3 ms; p= 0.001), but not QTd (63.4 ± 5.4 ms vs. 65.7 ± 6.1 ms), was significantly shortened. Short-term CM
significantly decreased ventricular APD90and QTc, but did not significantly change the maximal slope of APDR or QTd. These results suggest that CM might not have a significant effect on ventricular arrhythmogenicity.
Key Words:cardiac memory, QT interval, ventricular arrhythmias, ventricular electrical restitution
pacing, which suggests that the kinetics of ion chan-nels may play an important role in CM [7]. In addi-tion, the roles of the L-type calcium current (ICaL), delayed rectifier potassium currents (IKr, IKs) and inward rectifier current (IK1) in the modulation of CM expression have been well established in animal studies [9,10]. In our previous human study, the expression of short-term CM was found to be sup-pressed by verapamil and lidocaine but not by pro-cainamide and nitroglycerin [11]. Previous animal studies have demonstrated that CM could alter the configuration of action potentials and the transmural repolarization gradient in ventricular tissue [9,10,12]. Recently, Jeyaraj et al reported that segmental disper-sion of repolarization caused by mechanoelectrical feedback played a significant role in the genesis of T wave memory [13]. All of these reports raise the question of whether the expression of CM would in-crease ventricular arrhythmogenicity. Because dynamic changes of QT intervals, QT interval dispersion (QTd) and electrical restitution curve have been reported to be correlated with the propensity for ventricular arrhythmias [14–16], we investigated the effect of CM on changes in the QT interval and the ventricular action potential duration restitution curve.
M
ETHODSThe study protocol was approved by the institutional review board of our hospital. Informed consent was obtained from all patients.
Patients
The study group consisted of 20 patients, 12 females and eight males (mean age, 46± 13 years), with parox-ysmal supraventricular tachycardia who were referred for electrophysiologic study and catheter ablation. None of the patients had taken amiodarone, and the other antiarrhythmic drugs were discontinued at least five half-lives before the electrophysiologic study. The electrophysiologic study and catheter ablation were performed in unsedated and postabsorptive states. Thirteen patients had common slow-fast atrioventric-ular nodal reentrant tachycardia and seven patients had atrioventricular reciprocating tachycardia and used a concealed accessory pathway for retrograde conduc-tion. None of the patients had overt pre-excitaconduc-tion. Before the electrophysiologic study and catheter
ablation, all patients underwent routine physical examinations, echocardiography, a 12-lead ECG exam-ination and an exercise treadmill test; no significant organic heart disease was found.
Monophasic action potential duration
recording and measurement
After catheter ablation, a 7F monophasic action potential (MAP) recording catheter (Boston Scientific EP Technologies, San Jose, CA, USA) was inserted through the right femoral vein to the right ventricu-lar apex (RVA) for MAP recording and pacing. The catheter position was adjusted under fluoroscopy until a stable catheter position and an acceptable MAP signal was obtained. The MAP electrogram was filtered from 0.05 Hz to 500 Hz. Twelve-lead surface ECG and MAP electrogram were recorded and stored digitally (Bard LabSystem EP Laboratory, Lowell, MA, USA) for retrospective analysis. The monophasic action potential duration was measured at 90% re-polarization (MAPD90) by a computer caliper on the screen at a speed of 100 mm/s.
Construction of the monophasic action
potential duration restitution curve
The MAPD90 restitution curve of RVA was deter-mined by a standard S1–S2 protocol at pacing cycle lengths (PCLs) of 600 ms and 400 ms, respectively, as described previously [16]. In brief, a single pulse (S2) was delivered after every eighth basic pulse (S1) by the MAP catheter at the RVA and started with an S1–S2 coupling interval of 500 ms and 380 ms at PCLs of 600 ms and 400 ms, respectively. The S1–S2 interval was decreased in 60-ms steps while the S1–S2 inter-val was longer than 400 ms. Subsequently, the S1–S2 interval was decreased in 20-ms steps while the S1–S2 interval was longer than 300 ms. When the S1–S2 interval was shorter than 300 ms, the S1–S2 interval was decreased in 10-ms steps until the S2 capture failed. The S1–S2 interval was then increased by 20 ms and decreased in 2-ms steps until the ven-tricular effective refractory period (ERP) was reached. The MAPD90at PCLs of 600 ms and 400 ms from the RVA for each patient was calculated from the mean value of the last three beats of S1. The MAP duration restitution (MAPDR) curve was constructed by plot-ting the MAPD90of S2 versus the preceding diastolic interval (DI) at PCLs of 600 ms and 400 ms, respec-tively. The DI was defined as the S1–S2 interval
minus the MAPD90 at the eighth S1. The MAPDR curve obtained by S1–S2 was fit using the monoexpo-nential equation: y(APD90)= y0+ A1× (1–e–DI/t), where A1is the free-fitting variable, with each A1 and t at the correspondent DI, the slope was calculated using the equation: Slope= (A1/t)× [Exp(–DI/t)]. The slope of the shortest DI was defined as the maximal slope of the MAPDR curve.
Measurement of corrected QT interval
and QTd
The QT interval and R–R interval were measured on a computer screen using a digital caliper at a screen rate of 100 mm/s. The QT interval was the interval from the initial Q wave to the end of the T wave. The end of the T wave was: (1) a return to T-P baseline or (2) the nadir of the curve between T and U wave if the U wave was present. When the end of T wave could not be identified, the lead was excluded. The mean of the QT intervals and RR intervals were obtained by measuring the QT intervals and RR intervals of three consecutive sinus beats in each lead. The QTd was the difference between the maximal and minimal mean QT interval calculated from 12-lead ECG. The corrected QT interval (QTc) was calculated by the equation of: maximal mean QT interval/√mean R–R interval.
Induced short-term cardiac memory
The method for inducing short-term CM has been described in our previous study [11]. In brief, sus-tained pacing was introduced by applying rectangu-lar pulses of 2-ms duration at 2 times the diastolic threshold from RVA by the MAP catheter. The pacing cycle length was 400 ms and ventricular capture for each pacing was confirmed. The pacing duration was 20 minutes.
Study protocol
After 30 minutes of catheter ablation, a baseline 12-lead ECG was recorded to measure the QTc interval and the QTd. The baseline MAPDR curves were con-structed from the MAP recordings obtained from the RVA by the S1–S2 pacing protocol at PCLs of 600 ms and 400 ms, respectively. After baseline MAPDR curves were achieved, a short-term CM was induced by constant RVA pacing for 20 minutes. The induction of short-term CM was confirmed by the occurrence of characteristic changes in T wave morphology in
each of the 12-lead ECGs after stopping RVA pacing [11]. Immediately after RVA pacing was stopped and short-term CM was presented, the QTc and the QTd were measured and the MAPDR curves were recon-structed by the same S1–S2 pacing protocol as de-scribed for the baseline state. To evaluate the effect of short-term CM, all of the MAPDR curve construction protocols were completed within 15 minutes after the induction of short-term CM [11]. The QTc, QTd and MAPD90at ventricular pacing and the maximal slope of MAPDR curves were compared between baseline and after the induction of short-term CM.
Statistical analysis
All data were analyzed using SPSS version 11.0 (SPSS Inc., Chicago, IL, USA). Results are presented as mean± standard error of the mean. Comparisons of RR interval, QTc, QTd and MAPD90 at ventricular pacing and the maximal slope of MAPDR curves before and after the induction of short-term CM were made using Wilcoxon’s test. A p value of less than 0.05 was considered statistically significant.
R
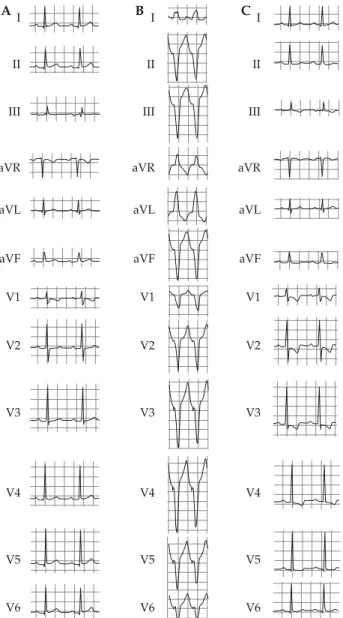
ESULTSNo significant ventricular arrhythmias could be in-duced during constructing MAPDR curves by extra-stimuli protocol (S1–S2) pacing from the RVA at both baseline and after induction of short-term CM. The expression of CM induced by short-term pacing from the RVA is shown in Figure 1. After 20 minutes of pacing from the RVA, the changes in polarity of T waves corresponded to the polarity of the QRS complex induced by pacing from the RVA in individ-ual leads.
MAPD
90at ventricular pacing and
MAPDR curve
At baseline, before CM was induced, the mean MAPD90at PCLs of 600 ms and 400 ms from the RVA were 252.9± 6.4 ms and 231.2 ± 6.4 ms, respectively. After induction of CM, the mean MAPD90at PCLs of 600 ms and 400 ms from the RVA was significantly shortened to 235.6± 6.4 ms and 214.4 ± 7.3 ms, respec-tively (p= 0.001). Figure 2 shows a representative example of MAPD90 recordings during basic PCLs of 600 ms and 400 ms with serial ventricular extrasti-muli at both baseline and after the induction of CM.
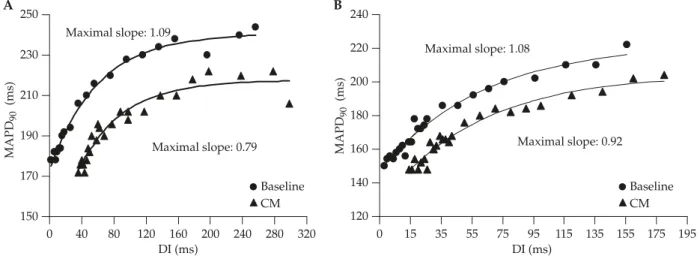
When the coupling interval of S1–S2 and consequently the DI was progressively shortened, the MAPD90of S2 was also gradually decreased. The MAPDR curves at PCLs of 600 ms and 400 ms were constructed for each patient. Representative MAPDR curves from one subject constructed at both baseline and after the induction of CM are shown in Figure 3. At baseline, the maximal slopes of the MAPDR curve were more than 1 in 12/20 and 10/20 patients at PCLs of 600 ms and 400 ms, respectively. The mean values of the maximal slope of the MAPDR curves of each patient
were 0.96± 0.11 and 0.84 ± 0.09 at PCLs of 600 ms and 400 ms, respectively. After the induction of CM, the maximal slopes of MAPDR curve were more than 1 in 13/20 and 11/20 patients at PCLs of 600 ms and 400 ms, respectively. The mean values of the maximal slope of the MAPDR curves of each patient were 1.05±0.09 and 0.85±0.08 at PCLs of 600ms and 400ms, respectively. Comparing the mean value of the maxi-mal slope of the MAPDR curves between baseline and after the induction of short-term CM, there were no significant changes at PCLs of 600 ms (p= 0.64) and 400 ms (p= 0.98), respectively.
QTc and QTd
After the induction of CM, the mean QTc interval (417.3± 9.1 ms vs. 454.7 ± 8.3 ms; p = 0.001) was signifi-cantly shortened. However, there were no significant changes in the QTd (63.4± 5.4 ms vs. 65.7 ± 6.1 ms;
p= 0.5) or the mean RR intervals (824.1 ± 31.7 ms vs.
776.8± 34.1 ms; p = 0.06) (Figure 4).
D
ISCUSSIONAfter the induction of short-term CM, the MAPD90at RVA pacing and the QTc were significantly short-ened; however, the QTd and the maximal slopes of the MAPDR curves at PCLs of 600 ms and 400 ms did not change significantly.
The electrical restitution curve was first defined by Bass, who described the time course of recovery of MAPD as a function of the DI between a steady state and an extrastimulus response [17]. The maximal slope of the MAPDR curve constructed by MAP recordings was reported to be related to the propensity of arrhy-thmogenesis. Steeper slopes of the MAPDR curves have been found in the ventricular endocardium of patients with cardiomyopathy at high risk of ventric-ular arrhythmias and in atrial endocardium of patients with atrial fibrillation [18,19]. The electrical restitu-tion curve may reflect the sum of various ion channel recovery kinetics and the respective intracellular cal-cium recycling and recovery of contractile force [20].
Three types of myocardial cells, the epicardial, M and endocardial cells, with distinct electrophysiologic properties were found within the ventricular wall [21]. The M cell has the ability of its action potential to prolong more than that of the epicardium or endo-cardium with slowing of rate. Previous studies have I II III aVR aVL aVF V1 V2 V3 V4 V5 V6 I II III aVR aVL aVF V1 V2 V3 V4 V5 V6 I II III aVR aVL aVF V1 V2 V3 V4 V5 V6 A B C
Figure 1.Twelve-lead ECG: (A) at baseline; (B) during pacing from the right ventricular apex (RVA); (C) after RVA pacing. After 20 minutes of pacing from the RVA, the cardiac memory was expressed as significant changes of T waves on leads II, III, aVF, and V1 to V5 (C) compared with baseline ECG (A).
defined the transmural voltage gradients responsible for the ECG patterns observed in normal conditions and in patients with a variety of arrhythmogenic cardiomyopathies [22]. The transmural differences in
repolarization of the three representative myocardial cell types have been shown to be responsible for the inscription of the J wave and the T wave of ECG [22,23]. The repolarization of the M cell is consistent
S1 S1 S1 S2 S2 600 256 254 222 218 216 214 198 500 S1600 S1500S2 440 S1440S2 S1 S2 340 S1 S2 270 S1 S1 S2 380 S1 S2 320 S1 S2 270 S1 S2 230 400 202 196 194 188 166 S1 S2 S1 S1 S1 S1 S1 S1 S2 S2 S2 S2 S2 168 340 270 400 380 320 230 226 206 270 230 196 230 200 238 A B C D
Figure 2.An example of monophasic action potentials recorded from the right ventricular apex by the S1–S2 protocol at pacing cycle lengths (PCLs) of 600 ms and 400 ms at baseline and after the induction of short-term cardiac memory (CM). (A) At baseline, the monophasic action potential duration at 90% repolarization (MAPD90) was 256 ms at the basic PCL (S1–S1) of 600 ms. While the
coupling interval of S1–S2 was progressively shortened from 500 ms to 270 ms, the MAPD90of S2 (from 254 ms to 200 ms) was also
gradually shortened. (B) After induction of short-term CM, the MAPD90was 222 ms at the basic PCL of 600 ms. While the coupling
interval of S1–S2 was progressively shortened from 500 ms to 270 ms, the MAPD90of S2 (from 218 ms to 198 ms) was also gradually
shortened. At the basic PCL of 400 ms, the MAPD90was 230 ms and 202 ms at baseline (C) and after induction of short-term CM (D),
respectively. While the coupling interval of S1–S2 was progressively shortened from 380 ms to 230 ms, the MAPD90of S2 was also
grad-ually shortened at both baseline and after induction of short-term CM (from 226 ms to 168 ms and from 196 ms to 166 ms, respectively).
120 0 15 35 55 75 95 115 135 155 175 195 140 160 180 200 220 240 B A 150 170 190 210 230 250 0 40 80 120 160 200 240 280 320 Baseline CM Baseline CM MAPD 90 (ms) MAPD 90 (ms) DI (ms) DI (ms) Maximal slope: 1.09 Maximal slope: 0.79 Maximal slope: 1.08 Maximal slope: 0.92
Figure 3.Representative examples of a monophasic action potential duration restitution (MAPDR) curve at baseline and after the induction of short-term CM at PCLs of: (A) 600 ms; (B) 400 ms. Compared between baseline (circle) and after the induction of CM (tri-angle), the maximal slopes of MAPDR curves were not significantly changed at the PCLs of 600 ms and 400 ms (1.09 vs. 0.79 and 1.08 vs. 0.92, respectively). MAPD90= monophasic action potential duration at 90% repolarization; DI = diastolic interval.
with the end of the T wave and the action potential duration of the M cell determines the QT interval. The prolongation of the QT interval may reflect pro-longation of cardiac repolarization. The QTd, which is the interlead difference between the maximal and minimal QT interval calculated in the surface ECG, may represent the degree of repolarization hetero-geneity in the ventricular myocardium. Prolongation of the QT interval and QTd could increase the risk of ventricular arrhythmias and cardiac mortality in population-based studies and in patients with cardio-vascular disease [15]. In this study, after the induction of term CM, the QTc was significantly short-ened and the QTd did not change significantly. This finding suggests that short-term CM may not prolong the ventricular repolarization time and may not signif-icantly increase the degree in ventricular repolarization heterogeneity.
The mechanisms of CM are complex. Results from animal studies have suggested that changes in the characteristics of multiple ion channels and angioten-sin II synthesis induced by stretching of the myocar-dial tissue might be involved in the initiation of short-term CM [24]. The effects of CM on ventricular arrhythmogenicity are controversial. Janse et al re-ported that short-term CM induced by left ventricular
epicardial pacing was the result of altering apicobasal repolarization gradients and shortened ventricular repolarization time and action potential duration of ventricular tissue [10]. Goyal et al studied short-term CM in humans and reported that it could shorten the MAPD90of ventricular tissue [25]. However, animal studies from isolated tissue showed that CM could prolong the action potential duration by modulating the expression of ion channels [9]. In our previous study, we demonstrated that, in humans, the QT interval was prolonged after long-term CM and the prolonged QT interval could be shortened by inter-action with short-term CM [26]. The controversial results of the effects of CM on action potential dura-tion may result from the different study materials and different pacing protocols, including pacing sites and duration to induce CM. The occurrence of CM in a clinical setting is not uncommon. However, only a few reports on the effect of CM on ventricular arrhy-thmogenicity are available. Kurita et al reported a patient with implantation of pacemaker who devel-oped torsade de pointes shortly after the loss of pacing [27]. They proposed that the mechanisms responsible for torsade de pointes may involve an increased dis-persion of ventricular repolarization, which occurred shortly after the loss of pacing, and the pacing in-duced CM. In this study, the QTc, the QTd and the slope of the MAPDR curve were used as indicators to evaluate the effects of short-term CM on ventricular arrhythmogenicity. Consistent with the results of pre-vious studies, the effects of short-term CM on the ventricular repolarization properties included short-ening of the MAPD90and the QTc. As described above, the slope of the MAPDR curve was considered to be a powerful determinant of the functional behavior of reentrant spiral and scroll waves [16,28]. The steeper slope may promote rotor instability and easily induced ventricular arrhythmias. In this study, the maximal slopes of the MAPDR curve were not significantly changed before and after the induction of short-term CM. In addition, the QTd did not show any signifi-cant change. All these results suggest that short-term CM may not significantly affect the reentrant stability and ventricular repolarization homogeneity. This find-ing may partially explain why ventricular arrhythmias related to CM are rarely reported in clinical practice.
Some limitations in this study should be addressed. First, the MAPDR cure was plotted only from the RVA. Changes in the slope of the MAPDR curve constructed
Figure 4.The maximal mean corrected QT interval (QTc) and mean QT interval dispersion (QTd) at baseline and after the induction of cardiac memory (CM). The mean value of QTc was significantly decreased by induction of CM while the mean value of QTd was not significantly changed. *p< 0.05. Bars represent mean± standard error of the mean.
0 100 200 300 400 500 Baseline ms QTc QTd * CM
from other sites of the ventricle might not be equal to that calculated from the RVA. Second, the maximal slope of the MAPDR curve, QTc and QTd were used to evaluate the effects of short-term CM on ventri-cular arrhythmogenicity in this study. We did not directly use programmed ventricular stimulation to evaluate the effect of short-term CM on ventricular arrhythmogenicity. However, no significant episodes of ventricular arrhythmia were observed during the construction of the MAPDR curve by S1–S2 pacing from the RVA at baseline or after the induction of short-term CM. Third, we only evaluated effects of the short-term CM. Further studies are needed to evaluate whether the effects of long-term CM on ven-tricular arrhythmogenicity are similar. Fourth, none of our patients had clinically significant organic heart disease, and the results from this study may not apply to patients with organic heart disease. Finally, the number of subjects in this study is small. The lack of a significant effect of short-term CM on QTd and the maximal slope of MAPDR curve may be due to the small number of subjects. Further studies with a larger number of subjects may be needed.
Short-term CM could decrease MAPD90at ventric-ular pacing and the QTc interval, but did not signifi-cantly change the maximal slope of the ventricular MAPDR curve or the QTd. These results suggest that short-term CM may not have a significant effect on ventricular arrhythmogenicity.
R
EFERENCES1. Chatterjee K, Harris AM, Davies JG, et al. T-wave changes after artificial pacing. Lancet 1969;1:759–60.
2. Rosenbaum MB, Blanco HH, Elizari MV, et al.
Electrotonic modulation of the T wave and cardiac memory. Am J Cardiol 1982;50:213–22.
3. Dense P, Pick A, Miller RH, et al. A characteristic pre-cordial repolarization abnormality with intermittent left bundle-branch block. Ann Intern Med 1978;89:55–7. 4. Engel TR, Shah R, DePodest LA, et al. T-wave abnor-malities of intermittent left bundle-branch block. Ann Intern Med 1978;89:204–6.
5. Nicolai P, Medvedowsky JL, Delaage M, et al. Wolff-Parkinson-White syndrome: T wave abnormalities during normal pathway conduction. J Electrocardiol 1981;14:295–300.
6. Levine HD, Lown B, Streeper RB. The clinical signifi-cance of postextrasystolic T-wave changes. Circulation 1952;6:538–48.
7. del Balzo U, Rosen MR. T wave changes persisting after ventricular pacing in canine heart are altered by 4-aminopyridine but not by lidocaine. Circulation 1992; 85:1464–72.
8. Shvilkin A, Danilo P Jr, Wang J, et al. Evolution and resolution of long-term cardiac memory. Circulation 1998;97:1810–7.
9. Patberg KW, Rosen MR. Molecular determinants of
cardiac memory and their regulation. J Mol Cell Cardiol 2004;36:195–204.
10. Janse MJ, Sosunov EA, Coronel R, et al. Repolarization gradients in the canine left ventricle before and after induction of short-term cardiac memory. Circulation 2005;112:1711–8.
11. Lee KT, Chu CS, Lin TH, et al. Effect of sodium and cal-cium channel blockers on short-term cardiac memory in humans. Int J Cardiol 2008;123:94–101.
12. Coronel R, Opthof T, Plotnikov AN, et al. Long-term cardiac memory in canine heart is associated with the evolution of a transmural repolarization gradient. Cardiovasc Res 2007;74:416–25.
13. Jeyaraj D, Wilson LD, Zhong J, et al. Mechanoelectrical feedback as novel mechanism of cardiac electrical remodeling. Circulation 2007;115:3145–55.
14. Perkiomaski JS, Koistinen MJ, Yli-Mayry S, et al. Dispersion of QT interval in patients with and without susceptibility to ventricular tachyarrhythmias after previous myocardial infarction. J Am Coll Cardiol 1995; 26:174–9.
15. Elming H, Brendorp B, Kober L, et al. QTc interval in the assessment of cardiac risk. Card Electrophysiol Rev 2002;6:289–94.
16. Pak HN, Hong SJ, Hwang GS, et al. Spatial dispersion of action potential duration restitution kinetics is asso-ciated with induction of ventricular tachycardia/fibril-lation in humans. J Cardiovasc Electrophysiol 2004;15: 1357–63.
17. Bass BG. Restitution of action potential in cat papillary muscle. Am J Physiol 1975;228:1717–24.
18. Selvaraj RJ, Picton P, Nanthakumar K, et al. Steeper restitution slopes across right ventricular endocardium in patients with cardiomyopathy at high risk of ven-tricular arrhythmias. Am J Physiol Heart Circ Physiol 2007;292:H1262–8.
19. Kim BS, Kim YH, Hwang GS, et al. Action potential duration restitution kinetics in human atrial fibrilla-tion. J Am Coll Cardiol 2002;39:1329–36.
20. Franz M. The electrical restitution curve revisited: steep or flat slope—which is better? J Cacrdiovasc Electrophysiol 2003;14:S140–7.
21. Antzelevitch C, Fish J. Electrical heterogeneity within the ventricular wall. Basic Res Cardiol 2001;96:517–27. 22. Yan GX, Antzelevitch C. Cellular basis for the
electro-cardiographic J wave. Circulation 1996;93:372–9. 23. Yan GX, Antzelevitch C. Cellular basis for the normal
T wave and the electrocardiographic manifestations of the long QT syndrome. Circulation 1998;98:1928–36.
24. Patberg KW, Shvilkin A, Plotnikov AN, et al. Cardiac memory: mechanisms and clinical implications. Heart Rhythm 2005;2:1376–82.
25. Goyal R, Syed ZA, Mukhopadhyay PS, et al. Changes in cardiac repolarization following short periods of ven-tricular pacing. J Cardiovasc Electrophysiol 1998;9:269–80. 26. Lee KT, Chu CS, Lu YH, et al. Modulation of the expression of long-term cardiac memory in patients
with Wolff-Parkinson-White syndrome after catheter ablation. Circ J 2007;71:331–7.
27. Kurita T, Ohe T, Maeda K, et al. QRS alteration-induced torsade de pointes in a patient with an artificial pace-maker and hypokalemia. Jpn Circ J 1996;60:189–91. 28. Weiss JN, Chen PS, Qu Z, et al. Ventricular fibrillation:
how do we stop the waves from breaking? Circ Res 2000;87:1103–7.