Abstract
According to the previous researches of sandstone, it was found that the key microscopic parameters influencing unconfined compressive strength (UCS) are porosity and grain area ratio (GAR). However, the relation of macroscopic properties with the microscopic ones highlights necessities further study in exploring how the microscopic properties influence the macroscopic properties. In this study, numerical analyses based on the bonded particle model were conducted to systematically study the microscopic mechanism. The model is firstly verified by simulating the variation of UCS with different GAR and porosity n. Furthermore, the elasto-plastic deformation of sandstone is explored by means of CTC tests. Analysis results demonstrate the mechanical behaviour of sandstone has the following characteristics: (1) The greater GAR and porosity will lead to the less cohesion, and the higher porosity leads to the lower friction angle; (2) The elastic shear modulus increases with decreasing porosity and increasing GAR; (3) A series of elliptic plastic potential surfaces can be observed; and (4) The variations of plastic angle and plastic strain trajectory under different shear stress are similar to actual behaviours of sandstone.
Keywords: bonded particle model, elasto-plastic deformation, sandstone.
1 Introduction
Sedimentary rocks such as sandstone are composed of rock fragments and mineral grains. The macroscopic mechanical behaviour of sandstone, the uniaxial compressive strength (UCS) for instance, is inherently affected by the microscopic properties, e.g. the mineral types, porosity, bonding strength, etc. of the rock forming materials. Therefore, it has been of interest to understand how the macroscopic mechanical behaviour of rock is influenced by the microscopic properties.
Paper 230
The Microscopic Mechanism associated with Mechanical
Behaviour of Sandstone: Using a Bonded Particle Model
M.C. Weng1 and H.H. Li2
1 Department of Civil and Environmental Engineering National University of Kaohsiung, Taiwan
2 Chung Cheng Institute of Technology National Defense University, Taiwan
©Civil-Comp Press, 2009
Proceedings of the Twelfth International Conference on Civil, Structural and Environmental Engineering Computing, B.H.V. Topping, L.F. Costa Neves and R.C. Barros, (Editors), Civil-Comp Press, Stirlingshire, Scotland
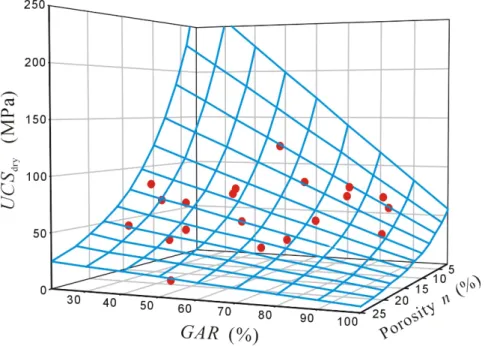
The previous researches [1-3] performed mechanical experiments and petrographic analyses on 13 different sandstone layers obtained the Western Foothill Range in Taiwan. Based on the results, two parameters, the porosity n and the grain area ratio GAR, defined by Eesoy and Waller [4], were found to be the key parameters. The uniaxial compressive strength (UCS) can be related to porosity n and GAR as shown in Eq. 1 and Fig. 1.
(
)
0.107
(133.7 n) 3.2 0.026
UCS = ⋅e− − GAR (MPa) (1)
Furthermore, the deformability (Young’s modulus E) was found to be related to porosity n and GAR as well and can be expressed as:
E =(36.3⋅e−0.106n)
(
0.017+0.354GAR)
(MPa) (2) It should be noted that the porosity n typically ranges between 5% and 25%, and GAR ranges between 20% and 75% for the studied sandstone. The two empirical equations, Eq. 1 and 2, represent how the macroscopic strength and deformability of natural sandstones are related to porosity n and GAR.Figure 1 Influence of microscopic parameters on UCS.
Though it has been shown that the petrographic factors do affect the mechanical behaviour of sandstone, the mechanism of relative mechanical properties between grain and matrix is difficult to be studied either by laboratory experiments or by petrographic analysis. Given this difficulty, a numerical model, provided that it is capable of accounting for the discrete packing nature of grains and the bonding strength, can serve as convenient means to study the influence of microscopic
properties on the macroscopic behaviour of rock. Among the existing discrete numerical models, bonded-particle model (BPM) possesses the above-mentioned requirements, and this model is adopted in this research. By using BPM, the distribution of the grain and the pore can be systematically varied and the corresponding variation of macroscopic mechanical behaviour can be observed. As a result, clarification on the effects of the porosity on strength and deformation behaviours of sandstones is accordingly obtained.
2 Methodology
2.1 Description of distinct element model
In this study, a bonded-particle model [5-6], which is characterizing with assembly and bonding of discrete circle particles, is considered to be adopted for simulating the aggregation and cementation of the sandstone. Intuitively, the bonded-particle model differs from the natural sandstone in the following aspects: (1) the grains of nature sandstone are far from sphere; (2) the contact of natural grains may often has “line-contact” observed from slice; however, the contact of BPM is either “point-to-point” or discontinuous line contact in between spheres; and (3) the number of grains allowed when conducting numerical analysis can be much less than the actual grain number of the actual rock. Therefore, before using BPM model for studying microscopic mechanisms, the numerical model must be tested and modified until it shows adequate macroscopic mechanical behaviour. As such, the uniaxial compression was first modelled using BPM, and it was revised iteratively until it yields reasonable macroscopic uniaxial compression behaviour. This test also serves the purpose of determining BPM’s microscopic parameters. After the test, a 2-dimensional numerical model was found to be capable of yielding a reasonable macroscopic mechanical response and was thus adopted as the tool for further analyses.
Since the natural sandstone is composed of grains, matrix and pore. Particles representing grains and matrix were accordingly introduced. One of the major difficulties simulating nature sandstone is to model sandstone with high porosity. Natural sandstone typically shows porosity of 10% ~ 25%, but when using BPM to model sandstone with large porosity may result in ”floating particles”, i.e. some particles are not supported owing to the limited number of particles that can be used. Therefore, in previous work [7], an additional type of particle representing the “porous matrix” was introduced to enable modelling high-porosity sandstones without leading to unsupported, floating particles. As a result, the proposed model contains three types of particles representing grain, matrix and porous matrix, which are respectively denoted as GP, MP and PP. This modification enables us to vary the GAR and porosity n of the model while observing the macroscopic variation of UCS and Young’s modulus E.
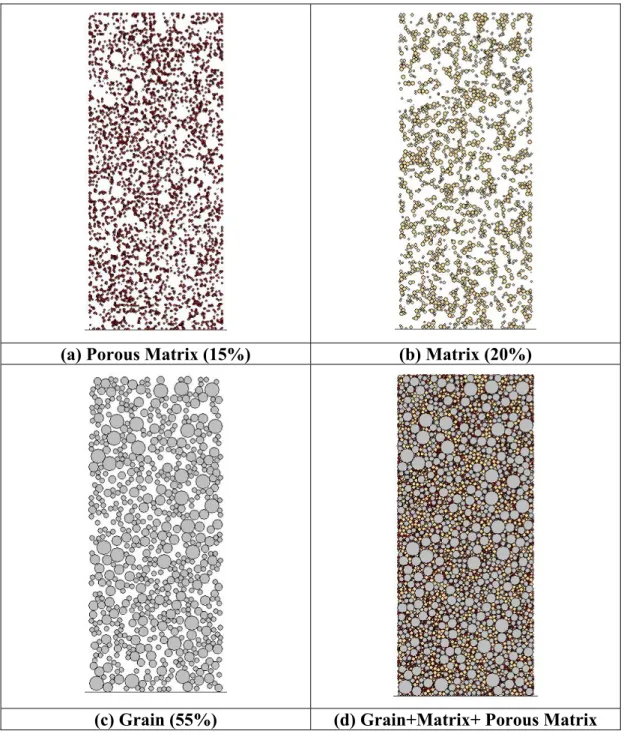
Based on the above-mentions concepts, the typical distributions of PP, MP and GP particles are respectively shown in Figs. 2a, b and c, in which the particles are randomly distributed inside a specimen of 5.5 cm in width and 13 cm in height. Figure 2d shows the complete model specimen for a model with GAR=55% and n = 25%; there are 8,487 particles. The number of particles will vary with the variation of petrographic parameters, e.g. GAR and n. Using the basic model shown in Fig. 2d, the GAR can be increased by randomly changing some of the MP into GP, and the resultant porosity used in this study ranges from 10% to 25%.
(a) Porous Matrix (15%) (b) Matrix (20%)
(c) Grain (55%) (d) Grain+Matrix+ Porous Matrix
To simulate uniaxial compressive tests, the upper and lower boundaries are selected to be frictionless rigid plates, and lateral boundaries are unconstrained. The unconfined uniaxial compression test is simulated by vertically moving both the upper and the lower plates toward the center of the specimen at a constant velocity of 10-2 m/s. This loading rate, confirmed in this study and by Iverson [8], is the
upper limit for which the loading rate poses little effect on the resultant UCS.
Moreover, the deformation of sandstone is explored by means of conventional triaxial compression tests (CTC), and simulated tests were carried out under confining pressure ranging from 5 to 40 MPa to study the effect of confining stress. Meanwhile, two cycles of unloading and reloading are conducted in every test for obtaining the elastic deformation, which will be used to decompose the total deformation into elastic and plastic components.
2.2 Grain size distribution and parameters of the studied model
The grain size distribution of the studied sandstone specimen is up-scaled to determine the number of particles and their sizes, as shown in Figure 3. In the BPM, particles with diameter less than 2 mm are defined as matrix particle or porous matrix, and only particles with diameter larger than 2 mm are considered as grain particle. In this study, models were setup with GAR 35%, 55%, and 75%, and these models respectively contains 12113, 8487, and 7606 particles in total.0 20 40 60 80 100 0.01 0.1 1 10 100
Grain or particle size (mm)
Pe rc en t fi ne r by w ei gh t or ar ea (% ) MS2 PFC2D, GAR35 PFC2D, GAR55 PFC2D, GAR75
Figure 3 Grain size distribution of the sandstone studied and the grain size
distribution adopted.
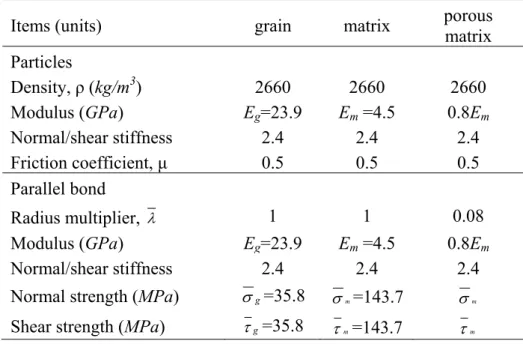
Additionally, all parameters needed in BPM model are shown in Table 1, and these parameters are determined through a calibration process by matching the observed material strength with the computed strength by the adopted BPM model.
Items (units) grain matrix porous matrix Particles
Density, ρ (kg/m3) 2660 2660 2660
Modulus (GPa) Eg=23.9 Em =4.5 0.8Em
Normal/shear stiffness 2.4 2.4 2.4
Friction coefficient, μ 0.5 0.5 0.5
Parallel bond
Radius multiplier, λ 1 1 0.08
Modulus (GPa) Eg=23.9 Em =4.5 0.8Em
Normal/shear stiffness 2.4 2.4 2.4
Normal strength (MPa) σg=35.8 σm=143.7 σm Shear strength (MPa) τg=35.8 τm=143.7 τm
Table 1 Microproperties of grain, matrix and porous matrix particles
2.3 Model verification
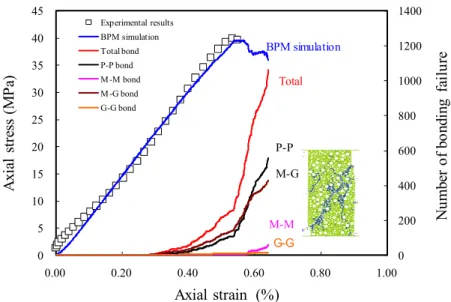
The validity of the proposed model was firstly tested by simulating a series of uniaxial compression tests and by comparing to the experimental results by Jeng et al. [1]. Figure 4 compares the stress-strain curves obtained by experiment and by numerical simulation. It can be seen these two curves shown in Fig. 4 are consistent in general and the peak strength are also similar. Similar to natural rocks, the bonded- particle model fractures at peak strength, followed by substantial drop of strength after peak; such behaviour represents a typical brittle fracture. After the peak, a major, inclined fracture surface is formed in the specimen upon subsequent loading, and eventually the original intact specimen is broken apart. This fracture pattern is also similar to the natural rock.
Furthermore, Figure 5 shows the variation of UCS with GAR and porosity n obtained from the proposed model and the comparison to the empirical correlations founded by Jeng et al. [1]. It can be seen that, for a given porosity n, increasing GAR decreases the UCS. This observation, combined with the fact that increasing of GAR under a given porosity n reduces the matrix content, suggests the possibility that the bonding strength of matrix is greater than the bonding strength of grain. On the other hand, under a particular GAR, the decrease of porosity n leads to an increase in UCS as shown in Fig. 1. The increase of grains and matrix, namely the decrease of porosity n, tends to better support the applied load and accounts for the increase of UCS.
0 200 400 600 800 1000 1200 1400 0 5 10 15 20 25 30 35 40 45 0.00 0.20 0.40 0.60 0.80 1.00 N um be r o f bo ndi ng f ai lu re A xia l s tre ss (M P a) Axial strain (%) Experimental results BPM simulation Total bond P-P bond M -M bond M -G bond G-G bond Total P-P BPM simulation M-G M-M G-G
Figure 4 Comparison of the experimental and simulated stress-strain curves (n = 20% and GAR = 35%). 0 25 50 75 100 125 150 25 35 45 55 65 75 GAR (%) UCS (M P a) Empirical relation Simulation n =10% Simulation n =15% Simulation n =20% Simulation n =25% n = 10% n = 15% n = 20% n = 25%
Figure 5 Empirical and simulated relations of UCS with porosity n and GAR.
3 Results and discussion
3.1 Strength
The simulated stress-strain curves obtained from the triaxial compressive test are presented in Fig. 6. Furthermore, the failure envelopes of the sandstone tend to be linear, when expressed in the normal and shear stress plane. As such, the linear relationship, known as the Mohr-Coulomb criterion (Eq. 1), is adopted
tan
f c
τ =σ φ+ (1)
where τf and σ are the shear strength and normal stress respectively, and the
parameters φ and c are the frictional angle and the cohesive intercept of the failure envelope.
Figure 7 depicts the variation of cohesion c with GAR and porosity obtained from the simulation. It is clear that the cohesion is significantly influenced by both GAR and porosity. The greater GAR and porosity values will lead to the less cohesion. Furthermore, for friction angle as shown in Fig. 8, the lower porosity induces the higher friction angle, and the influence of GAR on the friction angle is insignificant.
0 50 100 150 200 250 0 0.005 0.01 0.015 0.02 0.025 0.03 0.035 Axial strain Ax ia l st re ss ( M P a) P = 40 MPa P = 20 MPa P = 10 MPa P = 5 MPa
Figure 6 Stress-strain curves obtained from triaxial compression tests.
0 5 10 15 20 25 30 25 35 45 55 65 75 GAR (%) Co he si on ( M P a) n = 10 % n = 15 % n = 20 % n = 25 %
20 22 24 26 28 30 32 34 36 38 25 35 45 55 65 75 GAR (%) Frict io n a ng le ( deg re e) n = 10 % n = 15 % n = 20 % n = 25 %
Figure 8 Simulated relations of friction angle with porosity n and GAR.
3.2 Characteristics of elastic deformation
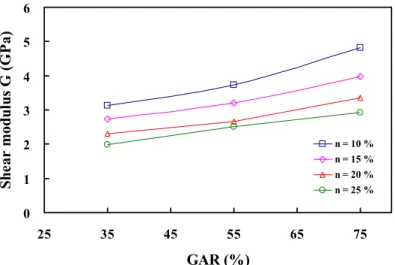
The deformation obtained from triaxial test is further decomposed into elastic and plastic components, which are deduced from the unloading–reloading curve. For the elastic deformation, Fig. 9a illustrates the variations of elastic shear modulus under different confining pressure. It can be seen that the elastic modulus varies almost linearly with the confining pressure. Similar relationships have also been observed on actual behaviour of sandstone by Weng et al. [2]. Moreover, the variations of shear modulus with various GAR and porosity are plotted in Fig. 8b, and it can be found that the modulus increases with decreasing porosity and increasing GAR. The numerical results are similar with the tendency of Young’s modulus with different GAR and porosity.
0.5 1.0 1.5 2.0 2.5 3.0 0 10 20 30 40 50
Confining pressure (MPa)
Sh ea r m od ul us G ( GPa ) n = 10 % n = 15 % n = 20 % n = 25 %
0 1 2 3 4 5 6 25 35 45 55 65 75 GAR (%) She ar m odul us G ( G P a) n = 10 % n = 15 % n = 20 % n = 25 %
(b) Simulated relations of shear modulus with porosity n and GAR
Figure 8 Variations of elastic shear modulus.
3.3 Characteristics of plastic deformation
For the plastic deformation, considering both of the volumetric and the shear strain increments, the plastic flow can be presented as vectors. Figure 9 shows the variations of plastic flow under different stress paths. Notably, p
v
δε and p s
δε are volumetric strain increment and shear strain increment, respectively. Remarkably, plastic deformation occurs before failure of the material, and the plastic flow indicates that the plastic compression occurs at earlier stages of shearing, followed by dilation at higher shear stress. Finally, the flow vectors tend to be perpendicular to the failure envelope of sandstone. Moreover, elliptic plastic potential surfaces can be determined according to the plastic flow distribution. These elliptic surfaces are similar to those of sandstone, reported by Weng et al. [2].
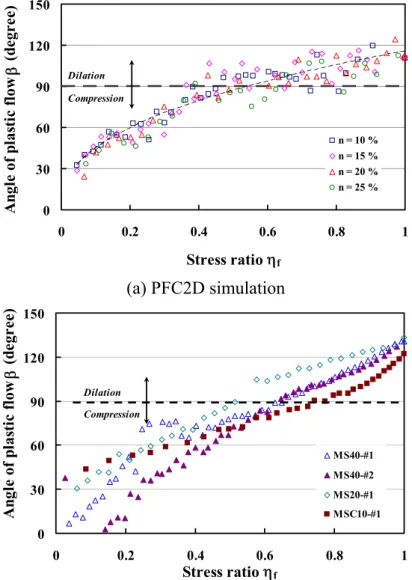
Base on the plastic flow, the plastic flow angle β, defined as p v p s δε δε β = tan ,
can be obtained from each plastic flow vector. When β ranges from 0º to 90 º, the
p v
δε will be compressive; when β is greater than 90 º, the p v
δε will be dilative. Figure 10a shows the variations of plastic angle β under various shear stress ratios (ηf =τ τf ), which is similar to actual behaviour of sandstone (Fig. 10b).
0 30 60 90 120 150 0 0.2 0.4 0.6 0.8 1 Stress ratio ηf A ngl e o f p las ti c fl ow β ( deg ree) n = 10 % n = 15 % n = 20 % n = 25 % Dilation Compression (a) PFC2D simulation 0 30 60 90 120 150 0 0.2 0.4 0.6 0.8 1 Stress ratio ηf A ngl e of p las ti c fl ow β ( deg ree) MS40-#1 MS40-#2 MS20-#1 MSC10-#1 Dilation Compression
(b) Test data from weak sandstone
Figure 10 Variations of plastic flow angle β during shear loading. Dilation occurs
when β is greater than 90º. Additionally, the plastic strain trajectory
ξ
is defined as:p p
ij ij
where dεijp is the tensor of plastic strain increment. Figure 11a illustrates the
plastic strain trajectory at various stages of shearing. It indicates that plastic strain occurs even for a minor degree of shearing (ηf = 0 ~ 0.4) and significantly increases,
by about two orders while approaching the failure state (ηf = 0.8 ~ 1). The
simulated plastic strain trajectory is also similar to that of sandstone (Figure 11b).
1.E-05 1.E-04 1.E-03 1.E-02 1.E-01 0 0.2 0.4 0.6 0.8 1 Stress ratio ηf P la sti c s tr ai n tr aje ct or y ξ n = 10 %n = 15 % n = 20 % n = 25 % (a) PFC2D simulation 1.E-05 1.E-04 1.E-03 1.E-02 1.E-01 0 0.2 0.4 0.6 0.8 1 Stress ratio ηf Pla st ic s tra in t ra jec to ry ξ MS80-#1MS60-#1 MS60-#2 MS40-#1 MS20-#1
(b) Test data from MS sandstone
Figure 11 Variations of plastic strain increment with different shear stress levels.
4 Conclusion
This study explored how the microscopic factors, e.g. particles types and the pore and stiffness, affect the macroscopic strength and deformation of sandstone. A
model based on bonded-particle method is proposed to simulate the macroscopic mechanical behaviour. The proposed numerical model contains three types of particles: grain particles (GP), matrix particles (MP), and porous matrix particles (PP). The model has been tested for modelling sandstones and shows good capability in simulating the behaviour of sandstone under uniaxial compression. Furthermore, the simulated variation of UCS with different GAR and porosity n is consistent with the empirical correlations founded by Jeng et al. [1].
The elasto-plastic deformation of sandstone is further explored by means of CTC tests. Simulation results demonstrate the mechanical behaviour of sandstone has the following characteristics:
(1) The cohesion is significantly influenced by both GAR and porosity n. The greater GAR and porosity values will lead to the less cohesion. However, for friction angle, the influence of GAR is insignificant, and the lower porosity leads to the higher friction angle;
(2) The elastic shear modulus increases with decreasing porosity and increasing GAR;
(3) A series of elliptic plastic potential surfaces can be observed according to the plastic flow distribution. These elliptic surfaces are similar to those of sandstone; and
(4) The variations of plastic angle β and plastic strain trajectory under different shear stress ratios are similar to actual behaviours of sandstone.
Acknowledgements
The research is supported by the National Science Council of Taiwan, Grant no. NSC 97-2221-E-390-019.
References
[1] F.S. Jeng, M.C. Weng, M.L. Lin, T.H. Huang, “Influence of petrographic parameters on geotechnical properties of Tertiary sandstones from Taiwan”, Engineering Geology, 73, 71-91, 2004.
[2] M.C. Weng, F.S. Jeng, T.H. Huang, M.L. Lin, “Characterizing the Deformation Behavior of Tertiary Sandstones”, International Journal of Rock Mechanics and Mining Science, 42, 388-401, 2005.
[3] M.L. Lin, F.S. Jeng, L.S. Tsai, T.H. Huang, “Wetting Weakening of Tertiary Sandstones – Microscopic mechanism”, Environmental Geology, 48, 265-275, 2005.
[4] A. Erosy, M.D. Waller, “Textural characterisation of rock”, Engineering Geology 39, 123-136, 1995.
[5] D.O. Potyondy, P.A. Cundall, “A bonded-particle model for rock”, International Journal of Rock Mechanics and Mining Science, 41, 1329–1364, 2004.
[6] Itasca Consulting Group Inc. “PFC2D (Particle Flow Code in 2 Dimensions), Version 3.0”, Minneapolis, MN: ICG, 2002.
[7] Y.M. Hsieh, H.H. Li, T.H. Huang, F.S. Jeng, “Interpretations on how the macroscopic mechanical behavior of sandstone affected by microscopic properties—Revealed by bonded-particle model”, Engineering Geology, 99, 1–10, 2008.
[8] S.R. Iverson, “Investigation of bulk solids engineering properties and application of PFC2D to ore pass flow problems, Numerical modeling in micromechanics via particle methods”, Proceedings of the 1st International PFC Symposium, Balkema Press, Netherlands, 251-258, , 2003.