To Improve Investors’ Valuation on Accounting Earnings in Emerging Markets: Evidence from Taiwan
Anlin Chen*
Professor, Department of Business Management National Sun Yat-Sen University
Kaohsiung 80424, TAIWAN ph: +886-7-5252000 ext 4656
fax: +886-7-5254698 email: anlin@mail.nsysu.edu.tw
Lanfeng Kao
Associate Professor, Department of Finance National University of Kaohsiung
Kaohsiung 81148, TAIWAN ph: +886-7-5919502 fax: +886-7-5919331 email: lanfeng@nuk.edu.tw
Meilan Tsao
Associate Professor, Department of Finance and Banking National Pingtung Institute of Commerce
Pingtung 90004, TAIWAN ph: +886-8-7238700 ext 6209
fax: +886-8-7237942 email: meilan@npic.edu.tw
Keywords: Accounting accruals, Corporate governance, Earnings management, Emerging markets, Mishkin test, Ownership characteristics
*Corresponding author: Anlin Chen. We thank Roger C. Y. Chen, Wenchih Lee, Chinshun Wu, and the seminar participants at National Sun Yat-Sen University for their helpful comments. We also appreciate the research grant from National Science Council (NSC 96-2416-H-110-022-MY2).
To Improve Investors’ Valuation on Accounting Earnings in Emerging Markets: Evidence from Taiwan
Abstract
Valuation of accounting earnings is profoundly related to earnings management.
In emerging markets where earnings management is typically strict, investors lose
confidence on accounting earnings and thus tend to under-value earnings. With
Taiwan data, we show that enhancing governance on ownership characteristics can be
used to improve investors’ valuation on accounting earnings. Under weaker
governance structure, for example, shareholders’ over control; small board size; and
CEO duality, market tends to downgrade the information contents of reported
accounting earnings and to under-value accounting earnings. Reducing controlling
shareholders’ ownership and reinforcing the monitoring function of the board improve
1. Introduction
Previous studies document that accounting earnings, particularly the accruals
components of earnings, are often mis-valued. Sloan (1996) demonstrates that U.S.
investors over-value accruals. This “accrual anomaly” is robust across various
samples and time period of U.S. firms. However, Pincus et al. (2007) show that
accounting earnings are more often under-valued rather than over-valued in emerging
countries such as Taiwan.
Perry and Williams (1994), Friedlan (1994), Erickson and Wang (1999), Teoh et
al. (1998) and Kao and Chen (2007) indicate that managers engage in earnings
management to mislead the stock markets. Under earnings management, the
financial statements become less credible leading to the under-valuation of accounting
earnings. Leuz et al. (2003) examine earnings management in 31 countries around
the world and assert that emerging markets generally experience higher earnings
management scores than the developed markets do. Coincidently, Pincus et al. (2007)
indicate that accounting earnings in developed markets are over-valued whereas
accounting earnings in emerging markets are under-valued.
The over/under-valuation of accounting earnings implies investors’
over/under-confidence on reported accounting earnings. In the developed markets
where earnings management scores are relatively low, investors tend to over-value
management scores are high, investors doubt about the reported earnings and
consequently under-value accounting earnings.
Under-valuation of accounting earnings means that stock prices are lower than
they should be. Consequently, under-valuation hurts the interests of the stockholders
and impedes the development of a solid capital market. Therefore, how to mitigate
or even to eliminate the under-valuation of accounting earnings is important and
worth examining, especially in emerging markets.
Ownership characteristics are the key features for a solid corporate governance.
A good corporate governance is able to promote transparent and efficient markets, to
protect and facilitate the exercise of shareholders’ rights, to ensure the equitable
treatment of all shareholders, and to ensure that timely and accurate disclosure is
made on all material matters.
In this paper, we examine how to alleviate under-valuation of accounting
earnings in emerging markets with Taiwan data via ownership characteristics. The
reason why we use Taiwan data is that Taiwan is an emerging country of high
earnings management score and that investors tend to under-value accounting
earnings in Taiwan. The uniqueness of Taiwan data helps us examine the role of
ownership characteristics on protecting investors’ interests and the development of a
The remaining of this paper proceeds as follows. Section 2 reviews literature
related to the relationship between earnings management and governance structures.
Section 3 introduces our sample and defines our variables. Section 4 examines
investors’ valuation on accounting earnings and how ownership characteristics
influence investors’ valuation. Finally, we conclude in Section 5.
2. Related Literature
2.1 Accounting discretion and earnings management
Management has discretions over the recognition of accruals. Discretion can
be used to opportunistically manipulate accruals. Anecdotal evidence suggests that
insiders (controlling shareholders and top mangers) generally engage in earnings
management to conceal true performance from outsiders. Firms tend to manage
reported earnings to avoid earnings decreases and loss (Burgstahler and Dichev, 1997)
to smooth income in anticipation of future earnings (DeFond and Park, 1997), and
even to satisfy the demand for dividends (Kasanen et al., 1996). Leuz et al. (2003)
indicate that earnings management is expected to increase with inside control and to
decrease with outside investor protection.
Rational expectation argues that rational valuation should correctly anticipate the
persistence of earnings performance. Sloan (1996) investigates the valuation of
earnings of U.S. capital markets and finds that market over-values accruals of
earnings. Sloan (1996) and Xie (2001) argue that accruals are less persistent than
cash flows and that abnormal accruals, on the other hand, are less persistent than
regular accruals. Over-valuation of accounting earnings is not pervasive around the
world. Pincus et al. (2007) find that the investors in developed markets tend to
over-value accounting earnings while investors in emerging markets under-value
accounting earnings.
While valuation of accounting earnings is extensively investigated in developed
markets, little attempt has been made to enlighten the under-valuation of accounting
earnings in emerging markets. This paper contributes to literature by making up the
gap of under-valuation of accounting earnings in emerging markets with Taiwan
evidence.
2.3 Corporate governance and earnings management
Klein (2002) asserts that earnings management is positively related to poor
corporate governance mechanisms. Corporate governance can improve the quality
of accounting reports. Warfield et al. (1995) demonstrate that managers’ accounting
al. (1995) define managerial ownership as the percent of equity shares held by officers,
directors, and principal owners who can exercise significant influence over corporate
affairs. Dechow et al. (1996) study firms subject to Enforcement Action by the SEC
and find that firms manipulating earnings are more likely to experience CEO duality
(Chief Executive Officer, CEO, simultaneously serves as Chairperson of the Board,
COB). Klein (2002) argues that an independent board of directors is more effective
in monitoring the financial accounting process. Chen et al. (2007) further
demonstrate that corporate governance can mitigate the abuse of accounting earnings.
Consequently, well-structured governance mechanism improves the quality of the
reported income. Managerial ownership, CEO duality, and board function are
important factors for the quality of accounting earnings.
This paper provides insights into the under-valuation of accounting earnings in
emerging markets. It contributes to the literature by showing the role of ownership
characteristics enhancing corporate governance in market valuation on accounting
earnings. We demonstrate that under-valuation of earnings is a consequence of
earnings management under the circumstance that investors are under little protection.
3. Data Source, Variable Measurement, and Descriptive Statistics
3.1 Sample selection
sample consists of all firms listed in Taiwan Security Exchange from 1991 to 2004.
We delete firm-year observations with 1) missing ownership characteristics
information, such as controlling shareholders’ holding, number of directors on board,
and/or CEO and COB information; 2) insufficient data to calculate accruals as defined
in the section 3.2; and 3) missing subsequent annual stock return data. A total of
4,784 firm-year observations are generated from this sample screening procedure.
3.2 Variable measurement
Earnings are measured as net income before extraordinary items and
discontinued operations to lagged assets. Cash is net cash flows from operations to
lagged assets. Accruals of firm i at year t (Accrualsit) are computed following Healy
(1985) and Jones (1991) as follows.
Accrualsit=[(ΔCAit-ΔCashit)-(ΔCLit-ΔSTDit)-DEPit] (1) where,
ΔCAit = change in current assets at year t to lagged assets of firm i;
ΔCashit = change in cash at year t to lagged assets of firm i;
ΔCLit = change in current liabilities at year t to lagged assets of firm i;
ΔSTDit = change in short term debt at year t to lagged assets of firm i;
DEPit = depreciation and amortization at year t to lagged assets of firm i;
fiscal year as follows.
it it
i
it
it iit-i
it β ΔREV -ΔREC β PPE ε
Assets α Accruals 1 2 1 1 (2)
it it
i
it
i it-iit β ΔREV -ΔΔRE β PPE
Assets α Accruals Normal 1 2 1 ˆ ˆ 1 ˆ (3) where,
ΔREVit = change in revenues at year t to lagged assets of firm i;
ΔRECit = change in receivables at year t to lagged assets of firm i;
PPEit = gross property plants and equipment at year t to lagged assets of firm i.
ˆ , ˆ , and 1 ˆ are the parameters estimated from equation (2). 2
Abnormal Accrualsit = Accrualsit – Normal Accrualsit (4)
mt it it R -R turn Re Abnormal (5) where Ritis the annual stock return of firm i at year t; Rmt is the annual return of
Taiwan Stock Index (TAIEX) at year t.
This paper examines if ownership characteristics can improve investors’
valuation on accounting earnings. We employ three ownership characteristics
including controlling shareholders’ ownership, board size, and CEO duality which are
explicitly defined as follows.
CS Hold = the percentage of shares owned by the controlling shareholders.
Controlling shareholders are defined as in La Porta et al. (1999).
CEO Duality = 1 if CEO also serves as COB; CEO Duality = 0, otherwise. ---
Put Table 1 about here ---
3.3 Descriptive statistics of earnings
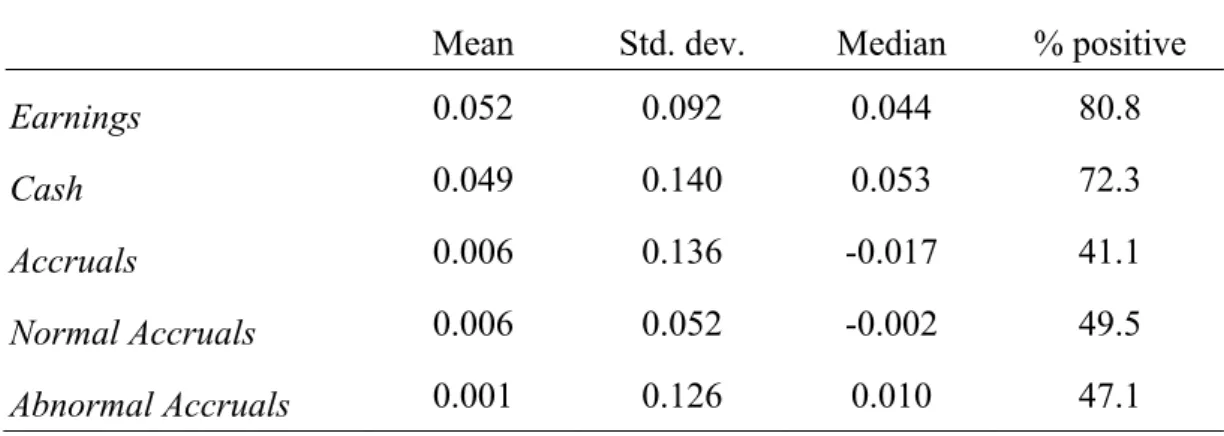
Panel A of Table 1 presents the descriptive statistics. The mean of earnings is
5.2% of lagged assets of the firms with median=4.4%. 80.8% of the sample has
positive earnings. Average cash flow out of lagged assets is 4.9% (median=5.3%).
72.3% of the sample has positive cash flow. The mean accruals, normal accruals,
and abnormal accruals are 0.006, 0.006, and 0.001, respectively. Average abnormal
accruals are practically zero by OLS estimation.
Panel B of Table 1 reports contemporaneous correlations among earnings and
ownership characteristics. It is natural that earnings are positively correlated with
cash flows and accruals. Consistent with previous studies (such as Dechow, 1994;
Dechow et al., 1996; and Subramanyam, 1996), cash flows and accruals are
negatively correlated. Subramanyam (1996) suggests this negative correlation could
arise from income smoothing.
Correlations between controlling shareholders’ holding and earnings components
including earnings, cash flows, accruals, normal accruals, and abnormal accruals are
components. Abnormal accruals are generally employed as a measure of earnings
management. Panel B of Table 1 indicates that earnings management is
insignificantly positively related to controlling shareholders’ ownership and
insignificantly negatively related to board size.
--- Put Table 2 about here ---
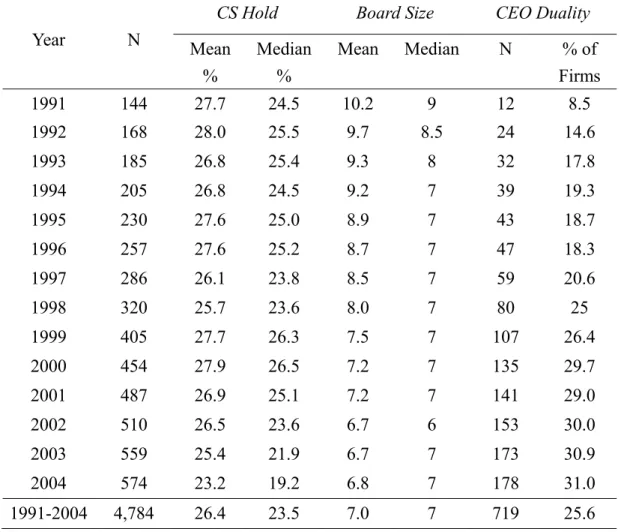
3.4 Descriptive statistics of ownership characteristics
Table 2 analyzes the ownership characteristics of our sample data. Controlling
shareholders own an average of 26.4% shareholding of the firms. Average board
size is 7 with a median of 7. There is a trend that more COBs are also posted as
CEOs. An average of 25.6% of the sample firms has duality structure.
Weak corporate governance structure could cause the abuse of accounting
discretion or earnings management. Warfield et al. (1995) argue that management’s
accounting choices are related to the ownership of the controlling shareholders.
When controlling shareholders own more shares, they have more power to abuse
accounting discretions.
To investigate if market valuation on accounting earnings changes with the
enhanced governance power due to the ownership characteristics, we segregate the
presumably associated with accounting discretions. We segregate our sample into
two subgroups. One group includes firms with controlling shareholders holding
25% or more; the other one includes firms in which controlling shareholders own less
equity. The cutoff point of 25% is somewhat arbitrary. Table 2 indicates that the
median of top shareholders’ ownership is about 25%. Furthermore, we reach
qualitatively similar results with various cutoff points of controlling shareholders’
holdings.
Beside the controlling shareholders’ ownership, the size of the board also has
great influence on earnings management. Board is designed to monitor the
management. Claessens et al. (2000) show that most of the firms in East Asian
countries are not well-diversified and controlled by families or groups. In Taiwan,
many of the firms are controlled by families or groups so directors are normally
family members or group members so that a board of small size could imply that the
board is actually formed by a small group of controlling shareholders who own
authority on accounting choices. Earnings management tends to be more severe for
firms of small boards. Firms with the boards consisting of 5 or less directors are
considered to have small boards. It is difficult to set an appropriate size of board.
There is a minimum requirement of 5 directors on the board for companies listed in
are considered as small.
In addition, Rechner and Dalton (1991) show that the independent leadership
structure in which two different persons are posted as COB and CEO monitors the top
management effectively. Firms with CEO duality are more likely to manage
earnings.
--- Put Table 3 about here ---
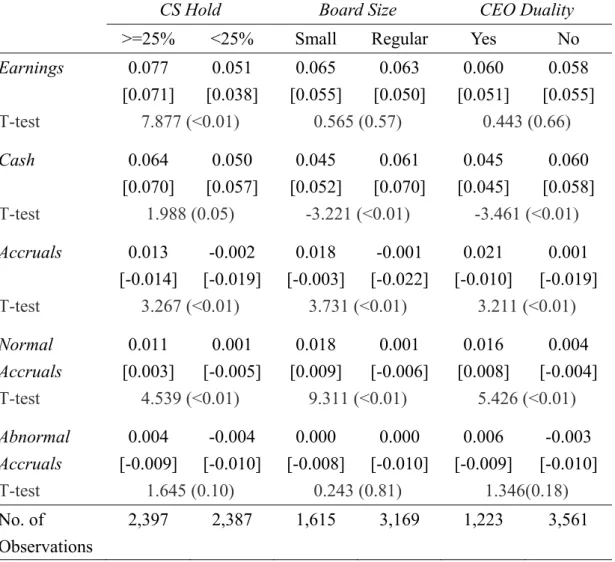
Table 3 provides descriptive statistics of subsamples of different ownership
characteristics. Table 3 indicates that the higher the ownership of the controlling
shareholders and the smaller the board size, the greater the accruals. Firms with
CEO duality have lower earnings or cash flows but have higher total accruals, normal
accruals, and abnormal accruals. Table 3 provides preliminary evidence that firms
experience higher level of earnings management when controlling shareholders have
more controlling power.
4. Empirical Methodology and Evidence
4.1 Valuation of accounting earnings
Earnings are often used as indicators of firm performance. Investors can use
current earnings to predict future earnings. Management’s use of discretionary
we examine how market participants rely on corporate governance structures to judge
the quality of accounting earnings.
Following Sloan (1996), we use the framework proposed by Mishkin (1983) to
test the persistence of earnings and the rational valuation of earnings. To be specific,
we estimate the following system:
Earningst+1 = 0+1Casht +2 Accrualst +t+1 (6)
Abnormal Returnt+1 = ( Earningst+1*0*1 Casht*2Accrualst) + t+1 (7)
Equation (6) is the Forecasting equation that estimates the forecasting coefficients (s)
measuring the effectiveness of earnings components on predicting one-year-ahead
earnings. Equation (7) is the Valuation equation that estimates the valuation
coefficients (*s) which measure how much the market values the earnings
components. Rational valuation requires that stock prices correctly anticipate the
persistence of earnings performance, i.e. *j equal to corresponding j (j=1, 2). The
Mishkin (1983) test provides a statistical comparison between the forecasting
coefficients and the valuation coefficients. Significant differences between the two
coefficients suggest that market mis-values earnings.
The test of rational valuation is implemented by estimating Forecasting equation
and Valuation equation jointly using a two-stage iterative generalized nonlinear least
constraints on the coefficients of Forecasting equation and Valuation equation. Next,
we impose rational valuation constraints (*j = j , j=1, 2) to test whether the valuation
coefficients are significantly different from their corresponding forecasting
coefficients obtained in the first step. If the valuation coefficients were significantly
larger (smaller) than the forecasting coefficients, the market over-values (under-values)
earnings. Under the assumption of rational valuation, Mishkin (1983) shows that the
following likelihood ratio statistic is asymptotically 2(q) distributed:
2*N*Ln(SSRc/SSRu), (8)
where,
q = the number of rational valuation constraints imposed;
N = the number of observations in the sample;
SSRc = the sum of squared residuals from the constrained regressions in the second
stage; and
SSRu = the sum of squared residuals from the unconstrained regressions in the first
stage.
--- Put Table 4 about here ---
Panel A of Table 4 reports the coefficient estimates for equations (6) and (7).
The valuation coefficients show that market under-values both cash flows and
coefficients are 0.481 and 0.502 for Cash and Accruals, respectively. Both
coefficients are significantly smaller than the corresponding forecasting coefficients
of 0.642 and 0.592. Panel A of Table 4 also shows that although the forecasting
coefficients indicate different persistence between Cash and Accruals (12), the
market treats them as the same ( * 2 * 1
).
Xie (2001) shows that mis-valuation of accruals is primarily attributable to the
mis-valuation of abnormal accruals rather than normal accruals. Consequently,
accruals are further decomposed into normal and abnormal accruals. Equations (9)
and (10) are used to estimate market valuation on cash flows, normal accruals, and
abnormal accruals.
Earningst+1 =0+1Casht +2 Normal Accrualst +3 Abnormal Accrualst +t+1 (9)
Abnormal Returnt+1 = ( Earningst+1*
0*1 Casht
*
2 Normal Accrualst -*3 Abnormal Accrualst ) + t+1 (10)
Panel B of Table 4 shows the estimates of equations (9) and (10) and indicates that
market consistently under-values cash flows, normal accruals, and abnormal accruals.
The valuation coefficients are all significantly smaller than the corresponding
forecasting coefficients ( * 1 1 , * 2 2 , * 3 3
). The persistence of cash flows,
normal accruals, and abnormal accruals are different (The null hypothesis,
* 3 * 2 * 1
normal are virtually the same (*
1, *2, and *3 differ insignificantly).
Beneish and Vargus (2002) demonstrate that the accrual mis-valuation is due to
the mis-valuation of positive accruals instead of negative accruals. Positive accruals
are the income-increasing accruals while negative accruals are income-decreasing
accruals. Thus, accruals are further decomposed into positive accruals and negative
accruals. Equations (11) and (12) are used to estimate market valuation on cash
flows, positive accruals, and negative accruals. Positive accruals (PosAccruals) are
Accruals if Accruals are positive and 0 otherwise. Negative accruals (NegAccruals)
are Accruals if Accruals are negative and 0 otherwise.
Earningst+1 = 0+1Casht +2 PosAccrualst +3 NegAccrualst +t+1 (11)
Abnormal Returnt+1 = ( Earningst+1*
0*1 Casht
*
2 PosAccrualst *3 NegAccrualst ) + t+1 (12)
The estimates from equations (11) and (12) are shown in Panel C of Table 4. The
forecasting coefficients of positive and negative accruals are 0.585 and 0.588,
respectively. However, the valuation coefficients are 0.468 and 0.688 respectively
(with an F value of 11.485, p-value <0.001 rejecting the hypothesis of * 3 * 2
).
Panel C shows that market under-values positive accruals but over-values negative
accruals. Under-valuation of positive accruals implies that investors cast doubt upon
negative accruals implies that market investors over-react to the negative earnings.
Negative accruals normally cause the slide of stock price. In Taiwan, negative
accruals cause the slide of stock price more than expected.
The results in Table 4 demonstrate that investors do not trust the quality of
accounting earnings. The reported accounting earnings and its components are
positively related to the stock returns. However, the observed relation between stock
returns and accounting earnings is smaller than expected. When positive accounting
accruals are reported, the stock price climbs but not high enough. On the other hand,
when negative accounting accruals are present, the stock price declines more than it
should do. These findings are contrary to those found in the developed markets
where earnings management is not severe. In developed countries of low earnings
management scores, the positive earnings accruals are over-valued (Sloan, 1996,
Beneish and Vargus, 2002; and Pincus et al., 2007).
4.2 Governance structure and the valuation of accounting earnings
The logical explanation for under-valuation of earnings accruals would be that
market participants are of lack confidence on the earnings information provided by
the management leading to market’s punishing earnings. Consequently, the
management can demonstrate that earnings are generated under proper governance to
engage in high level of earnings management (Leuz et al., 2003). Since corporate
governance can ensure timely and accurate accounting information, governance
mechanism should be able to improve market valuation on accounting earnings and its
components, especially for firms engaging in high level of earnings management.
Knowing that firms are well governed, market participants would be able to fairly
value earnings. If this way of reasoning is appropriate, we would expect investors
respond to positive accruals more vigorously when top managements are more
powerful of using accounting discretions.
To examine if corporate governance improves market’s valuation on accounting
accruals, we choose three ownership structure variables: 1) controlling shareholders’
ownership, 2) the size of the board of directors, and 3) CEO duality as governance
characteristics. We segregate our sample into different subgroups according to these
three ownership characteristics to investigate how investors value the components of
accounting earnings. To examine how these ownership characteristics influence
market valuation on earnings components, we employ the following Mishkin test.
Earningst+1 = 0+1 Casht +2 PosAccrualst+3 NegAccrualst +4 G1,2or3×Casht
+5 G1,2or3×PosAccrualst +6 G1,2or3×NegAccrualst +t+1 (13)
Abnormal Returnt+1 = ( Earningst+10*1 Casht*2 PosAccrualst
*
3 NegAccrualst*4 G1,2or3×Casht*5 G1,2or3×PosAccrualst
*
where, G1, G2, and G3 are dummy variables. G1 = 1 if the controlling shareholders
gain too much control (controlling shareholders own more than 25% of ownership); 0
otherwise. G2 = 1 if board size is too small (five or less directors on the board); 0
otherwise. G3 = 1 if CEO is not properly monitored (CEO duality); 0 otherwise. In
other words, G1, G2, and G3= 1 when firms experience weaker governance structure.
G1, G2, and G3= 0 when firms are under stronger governance structure. ---
Put Table 5 about here ---
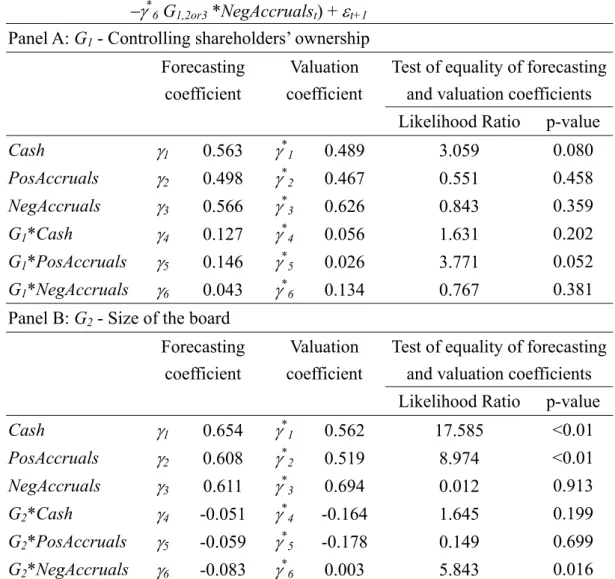
In Table 5, 1, 2, and 3 (*1, *2, and *3) represent the forecasting (valuation)
coefficients of Cash, PosAccruals, and NegAccruals for firms under stronger
governance, while 1+4, 2+5, and 3+6 (*1+*4, *2+*5, and *3+*6) stand for
coefficients of firms under stronger governance. The mis-valuation of earnings
components can be measured as *11, *22, and *33 for firms under stronger
governance. For firms under weaker governance, the mis-valuation of earnings
components can be measured as *1+*414, *2+*5 25, and *3+*6 36.
To test if market investors less under-value cash flows of firms under stronger
governance than those of firms under weaker governance, the null hypothesis would
be H0: *1+*414=*11, i.e. H0: *4 4. Consequently, *4 4 indicates that
cash flows of firms under stronger governance are less under-valued or more
stronger governance are more under-valued or less over-valued. The same way of
reasoning and null hypothesis also apply to PosAccruals with H0: *5 5, and
NegAccruals with H0: *6 6.
Panel A of Table 5 shows that *5 is significantly smaller than 5 ,which implies
that positive accruals of firms with controlling shareholders holding less than 25% are
less under-valued. Panel B of Table 5 shows that *6 6 significantly which means
that market less over-values negative accruals for firms of regular board size. Panel
C of Table 5 points out that *4 4 and *5 5 significantly. That is, cash flows and
positive accruals of firms without CEO duality are less under-valued.
Controlling shareholders have more control over the firms and are less monitored
when controlling shareholders own more shares, face with a smaller board, or are with
CEO duality. With earnings management, accounting earnings are less credible and
investors tend to under-value reported earnings. The empirical evidence indicates
that the mis-valuation of accounting earnings can be resolved with stronger
governance mechanism.
5. Conclusion
Corporate governance is extremely important for the development of financial
market, especially in the emerging markets. Under-valuation of equity is a
show that in an emerging market where the level of earnings management is high,
investors tend to under-value the accounting earnings. Corporate governance
protects the minority shareholders and assures the timeliness and accuracy of the
financial reporting. We further show that investors are less likely to under-value the
accounting earnings and accruals of firms under stronger governance. Our findings
further suggest the importance of corporate governance on the quality of the reported
accounting earnings and on the stock performance. Effective governance, therefore,
is a remedy to improve investors’ confidence over the firms’ financial reporting and is
References
Beneish, M., and Vargus, M. 2002, Insider trading, earnings quality, and accrual
mispricing. Accounting Review 77, 755-791.
Burgstahler, D. and Dichev, I. 1997, Earning management to avoid earnings decreases
and losses. Journal of Accounting and Economics 24(1), 99-126.
Chen, A., Kao, L., and Tang, H. 2007, How corporate governance mitigates the abuse
of accounting discretion: The perspective of firm Performance, Journal of
Management 24 (4), 419-434.
Claessens, S., Djankov S., and Lang L. 2000, The separation of ownership and control
in East Asia corporations. Journal of Financial Economics 58, 81-112
Dechow, P. 1994, Accounting earnings and cash flows as measures of performance:
The role of accounting accruals. Journal of Accounting and Economics 3-42.
Dechow, P., Sloan, R., and Sweeney, A. 1996, Causes and consequences of earnings
manipulation: An analysis of firms subject to enforcement actions by the SEC.
Contemporary Accounting Research, 13(1), 1-36.
DeFond, M. and Park, C. 1997, Smoothing income in anticipation of future earnings.
Journal of Accounting and Economics 23, 115-139.
Erickson, M. and Wang, S. 1999, Earnings management by acquiring firms in stock
Friedlan, M. 1994, Contemporary accounting choices of issuers of initial public
offerings. Contemporary Accounting Research 11(1), 1-31.
Healy, P. M. 1985, The effect of bonus schemes on accounting decisions. Journal of
Accounting and Economics 7, 85-107.
Jones, J. J. 1991, Earnings management during import relief investigations. Journal of
Accounting Research 29: 193-228.
Kao, L. and Chen, A. 2007, Directors’ share collateralization, earnings management
and firm performance, Taiwan Accounting Review 6 (2), 153-172.
Kasanen, E., Kinnunen, J., and Niskanen, J. 1996, Dividend-based earnings
management: Evidence from Finland. Journal of Accounting and Economics 22,
283-312.
Klein, A. 2002, Audit committee, board of director characteristics, and earnings
management. Journal of Accounting and Economics 33, 375-400.
La Porta, R., Lopez-de-Silanes, F., and Shleifer, A. 1999, Corporate ownership around
the world. Journal of Finance 54, 471-517.
Leuz, C., Nanda, D., and Wysocki, P. 2003, Earnings management and investor
protection: An international comparison. Journal of Financial Economics 69,
505-527.
Policy Ineffectiveness and Efficient-Markets Models. Chicago: University of
Chicago Press.
Perry, S. and Williams, T. 1994, Earnings management preceding management buyout
offers. Journal of Accounting and Economics 18(2), 157-179.
Pincus, P., Rajgopal, S. and Venkatachalam, M. 2007, The accrual anomaly:
International evidence. Accounting Review 82(1), 69-203.
Rechner, P. L. and Dalton, D. R. 1991, CEO duality and organizational performance:
A longitudinal analysis. Strategic Management Journal 12, 155-160.
Sloan, R. 1996. Do stock prices fully reflect information in accruals and cash flows
about future earnings? Accounting Review 7, 287-312.
Subramanyam, K. R. 1996, The pricing of discretionary accruals. Journal of
Accounting and Economics 22:, 249-281.
Teoh, S. H., Welch, I., and Wong, T. J. 1998, Earnings management and the long-run
market performance of initial public offerings. Journal of Finance 53(6), 1935,
Warfield, D., Wild, J., and Wild, K. 1995, Managerial ownership, Accounting choices,
and Informativeness of earnings. Journal of Accounting and Economics 20, 61-91.
Xie, H., 2001, The mispricing of abnormal accruals. Accounting Review 76(3),
Table 1: Descriptive statistics and correlations of earnings components
Descriptive statistics for a sample of 4,784 annual observations of firms listed in Taiwan Stock Exchange from 1991 to 2004. All firms without available beginning of the year governance information, year-end accounting information, or subsequent year stock return data are excluded. In the parentheses are the p-values.
Panel A: Descriptive statistics
Mean Std. dev. Median % positive
Earnings 0.052 0.092 0.044 80.8
Cash 0.049 0.140 0.053 72.3
Accruals 0.006 0.136 -0.017 41.1
Normal Accruals 0.006 0.052 -0.002 49.5
Abnormal Accruals 0.001 0.126 0.010 47.1
Panel B: Correlation correlations
Cash Accruals Normal
Accruals Abnormal Accruals CS Hold Board Size Earnings 0.381 (<0.001) 0.292 (0.001) 0.362 (<0.001) 0.148 (<0.001) 0.187 (<0.001) -0.065 (0.004) Cash -0.768 (<0.001) -0.129 (<0.001) -0.781 (<0.001) 0.076 (<0.001) 0.086 (0.001) Accruals 0.385 (<0.001) 0.932 (<0.001) 0.065 (0.002) -0.092 (<0.001) Normal Accruals -0.003 (0.860) 0.098 (<0.001) -0.198 (<0.001) Abnormal Accruals 0.052 (0.210) -0.043 (0.100) CS Hold -0.230 (<0.001)
Earnings=(net income before extraordinary items and discontinued operations)/(lagged assets).
Cash =(net cash flows from operations)/(lagged assets).
Accruals = (change in current assets – change in cash – change in current liability + change in short-term debt – depreciation and amortization)/ (lagged assets).
Normal Accruals = fitted Accruals from Modified Jones model.
Abnormal Accruals = Accruals – Normal accruals.
CS Hold = controlling shareholders’ ownership measured by La Porta et al. (1999).
Table 2: Descriptive statistics of ownership characteristics
Descriptive statistics for a sample of 4,784 annual observations of firms listed in Taiwan Stock Exchange from 1991 to 2004. All firms without available beginning of the year governance information, year-end accounting information, or subsequent year stock return data are excluded.
Year N
CS Hold Board Size CEO Duality
Mean % Median % Mean Median N % of Firms 1991 144 27.7 24.5 10.2 9 12 8.5 1992 168 28.0 25.5 9.7 8.5 24 14.6 1993 185 26.8 25.4 9.3 8 32 17.8 1994 205 26.8 24.5 9.2 7 39 19.3 1995 230 27.6 25.0 8.9 7 43 18.7 1996 257 27.6 25.2 8.7 7 47 18.3 1997 286 26.1 23.8 8.5 7 59 20.6 1998 320 25.7 23.6 8.0 7 80 25 1999 405 27.7 26.3 7.5 7 107 26.4 2000 454 27.9 26.5 7.2 7 135 29.7 2001 487 26.9 25.1 7.2 7 141 29.0 2002 510 26.5 23.6 6.7 6 153 30.0 2003 559 25.4 21.9 6.7 7 173 30.9 2004 574 23.2 19.2 6.8 7 178 31.0 1991-2004 4,784 26.4 23.5 7.0 7 719 25.6
Table 3: Earnings components based on ownership characteristics
Descriptive statistics for a sample of 4,784 annual observations of firms listed in Taiwan Stock Exchange from 1991 to 2004. Sample data is partitioned into two subgroups according to different ownership characteristics. The data of firms without available ownership information in the beginning year, year-end accounting information, or stock returns of the subsequent year are excluded. Numbers in the brackets are medians. In the parentheses are p-values.
CS Hold Board Size CEO Duality
>=25% <25% Small Regular Yes No
Earnings 0.077 [0.071] 0.051 [0.038] 0.065 [0.055] 0.063 [0.050] 0.060 [0.051] 0.058 [0.055] T-test 7.877 (<0.01) 0.565 (0.57) 0.443 (0.66) Cash 0.064 [0.070] 0.050 [0.057] 0.045 [0.052] 0.061 [0.070] 0.045 [0.045] 0.060 [0.058] T-test 1.988 (0.05) -3.221 (<0.01) -3.461 (<0.01) Accruals 0.013 [-0.014] -0.002 [-0.019] 0.018 [-0.003] -0.001 [-0.022] 0.021 [-0.010] 0.001 [-0.019] T-test 3.267 (<0.01) 3.731 (<0.01) 3.211 (<0.01) Normal Accruals 0.011 [0.003] 0.001 [-0.005] 0.018 [0.009] 0.001 [-0.006] 0.016 [0.008] 0.004 [-0.004] T-test 4.539 (<0.01) 9.311 (<0.01) 5.426 (<0.01) Abnormal Accruals 0.004 [-0.009] -0.004 [-0.010] 0.000 [-0.008] 0.000 [-0.010] 0.006 [-0.009] -0.003 [-0.010] T-test 1.645 (0.10) 0.243 (0.81) 1.346(0.18) No. of Observations 2,397 2,387 1,615 3,169 1,223 3,561
Table 4: Persistence and rational valuation of earnings components
Forecasting equation and valuation equation are jointly estimated using an iterative generalized nonlinear least square estimation (the Mishkin Test) based on a sample of 4,784 annual observations of firms listed in TSE from 1991 to 2004. All firms without available ownership information in the beginning year, year-end accounting information, or stock return data of the subsequent year are excluded.
Panel A: Market valuation of cash flow and accruals
Earningst+1 = 0+1Casht +2 Accrualst +t+1
Abnormal Returnt+1 = ( Earningst+10*1 Casht*2Accrualst) + t+1 Forecasting
coefficient
Valuation coefficient
Test of equality of the forecasting and valuation coefficients Likelihood ratio p-value
Cash 1 0.642 *
1 0.481 35.214 <0.001
Accruals 2 0.592 *
2 0.502 8.559 0.003
Test of equality of the earning components coefficients Test Statistic p-value
1=2 32.082 <0.001
*
1 =*2 0.613 0.434
1–* 1 =*2–2or 1–2 =*1– *2 6.060 0.014
Panel B: Cash flow, normal accruals, and abnormal accruals
Earningst+1 =0+1Casht +2 Normal Accrualst +3 Abnormal Accrualst +t+1
Abnormal Returnt+1 = ( Earningst+10*1 Casht
*
2 Normal Accrualst -*3 Abnormal Accrualst ) + t+1 Forecasting
coefficient
Valuation coefficient
Test of equality of the forecasting and valuation coefficients Likelihood ratio p-value
Cash 1 0.624 * 1 0.476 26.972 <0.001 Normal Accruals 2 0.662 * 2 0.505 8.175 0.004 Abnormal Accruals 3 0.565 * 3 0.501 3.555 0.059
Test of equality of the earning components coefficients Test Statistic p-value
2 =3 13.622 <0.001 * 2 =*3 0.000 1 1 =2 =3 22.864 <0.001 * 1 =*2 =*3 0.000 1 2– *2=3– *3 or 2–3 =*2– *3 0.918 0.338
Panel C: Cash Flow, positive accruals, and negative accruals
Earningst+1 = 0+1Casht +2 PosAccrualst +3 NegAccrualst +t+1
Abnormal Returnt+1 = ( Earningst+10*1 Casht
* 2 PosAccrualst-*3 NegAccrualst ) + t+1 Forecasting coefficient Valuation coefficient
Test of equality of the forecasting and valuation coefficients Likelihood ratio p-value
Cash 1 0.632 * 1 0.518 19.438 <0.001 PosAccruals 2 0.585 * 2 0.468 1402.76 <0.001 NegAccruals 3 0.588 * 3 0.688 1389.41 <0.001
Test of equality of the earning components coefficients Test Statistic p-value
2 =3 0.001 1 * 2 =*3 11.485 <0.001 1 =2 =3 11.694 <0.001 * 1 =*2 =*3 6.315 0.012 2– *2=3– *3 or 2–3 =*2– *3 11.097 <0.001
Table 5: Test of the persistence and the rational valuation under different ownership characteristics
Forecasting equation and valuation equation are jointly estimated using an iterative generalized nonlinear least square estimation (the Mishkin Test) based on a sample of 4,784 annual observations of firms listed in TSE from 1991 to 2004.
Earningst+1 = 0+1 Casht +2 PosAccrualst+3 NegAccrualst +4 G1,2or3 * Casht
+5 G1,2or3* PosAccrualst +6 G1,2or3 *NegAccrualst +t+1
Abnormal Returnt+1 = ( Earningst+10*1 Casht*2 PosAccrualst
*
3 NegAccrualst*4 G1,2or3 * Casht*5 G1,2or3* PosAccrualst
*
6 G1,2or3 *NegAccrualst) + t+1 Panel A: G1 - Controlling shareholders’ ownership
Forecasting coefficient
Valuation coefficient
Test of equality of forecasting and valuation coefficients
Likelihood Ratio p-value
Cash 1 0.563 *1 0.489 3.059 0.080 PosAccruals 2 0.498 *2 0.467 0.551 0.458 NegAccruals 3 0.566 *3 0.626 0.843 0.359 G1*Cash 4 0.127 *4 0.056 1.631 0.202 G1*PosAccruals 5 0.146 *5 0.026 3.771 0.052 G1*NegAccruals 6 0.043 *6 0.134 0.767 0.381
Panel B: G2 - Size of the board Forecasting
coefficient
Valuation coefficient
Test of equality of forecasting and valuation coefficients
Likelihood Ratio p-value
Cash 1 0.654 * 1 0.562 17.585 <0.01 PosAccruals 2 0.608 * 2 0.519 8.974 <0.01 NegAccruals 3 0.611 *3 0.694 0.012 0.913 G2*Cash 4 -0.051 *4 -0.164 1.645 0.199 G2*PosAccruals 5 -0.059 *5 -0.178 0.149 0.699 G2*NegAccruals 6 -0.083 *6 0.003 5.843 0.016
Panel C: G3 – CEO duality Forecasting
coefficient
Valuation coefficient
Test of equality of forecasting and valuation coefficients
Likelihood Ratio p-value
Cash 1 0.649 *1 0.562 6.960 <0.01 PosAccruals 2 0.607 *2 0.528 4.653 0.031 NegAccruals 3 0.613 *3 0.693 1.973 0.160 G3*Cash 4 -0.056 *4 -0.167 3.210 0.073 G3*PosAccruals 5 -0.061 *5 -0.180 3.213 0.073 G3*NegAccruals 6 -0.078 *6 0.007 0.511 0.475
G1, G2, and G3 are dummy variables.
G1 = 1 if the controlling shareholders own more than 25%; 0 otherwise.
G2 = 1 if there are five or less directors on the board; 0 otherwise.