國 立 交 通 大 學
財 務 金 融 研 究 所
碩 士 論 文
公司內部治理機制與主併者之報酬:
以新興市場為例
Internal Corporate Governance Mechanisms
and Acquirer Returns:
The Evidence from an Emerging Market
研 究 生:曾祥霈
指導教授:鍾惠民 博士
周幼珍 博士
公司內部治理機制與主併者之報酬:
以新興市場為例
Internal Corporate Governance Mechanisms
and Acquirer Returns:
The Evidence from an Emerging Market
研 究 生:曾祥霈
Student: Hsiang-Pei Tseng
指導教授:鍾惠民 博士 Advisor: Dr. Huimin Chung
周幼珍 博士 Dr. Yow-Jen Jou
國立交通大學
財務金融研究所
碩士論文
A Thesis Submitted to Graduate Institute of Finance
National Chiao Tung University
in partial Fulfillment of the Requirements
for the Degree of
Master of Science in
Finance
中華民國九十八年六月
June 2009
i
Internal Corporate Governance Mechanisms and Acquirer Returns: The Evidence from an Emerging Market
Student: Hsiang-Pei Tseng Advisor: Dr. Huimin Chung Dr. Yow-Jen Jou
Abstract
In this article, I use 118 acquisition events completed by firms listed in the Taiwan Stock Exchange (TSE) or the GreTai Securities Market (GTSM) from Jan 1, 2000 to Dec. 31, 2008 as my samples and I use the market model of event study to count the cumulative abnormal returns around the announcement date. Then multiple regression models are used to examine if internal corporate governance (CG) mechanisms have effects on acquisition CAR. Through the research I find that some internal CG mechanisms and bidder characteristics have significant effects on the acquisition CAR. Blockholders holding rate, firm size, and Tobin’s Q have positive effects on acquisition CAR. On the other hand, firms with lower foreign investors holding rate, leverage, and stock price runup have higher announcement returns.
ii 公司內部治理機制與主併者之報酬: 以新興市場為例 研 究 生:曾祥霈 指導教授:鍾惠民 博士 周幼珍 博士 摘要 本篇文章使用了從 2000 年 1 月 1 號開始,至 2008 年 12 月 31 日為止,共 118 個 由台灣上市或上櫃公司做為主併者的併購樣本。並使用事件研究法之市場模型計 算其宣告日前兩天至後天兩的累積超額報酬。之後再使用複迴歸模型檢驗公司內 部治理機制對於宣告併購事件時的累積超額報酬是否有顯著的解釋能力。透過研 究可以發現,某些公司內部治理機制以及主併者的特質對於累積超額報酬的確有 顯著的解釋能力。大股東持股比率、公司規模以及Tobin’s Q 對於累積超額報酬 有正向且顯著的影響能力。另一方面,公司的槓桿比率、外資持股比率以及宣告 前的股價超額報酬則與宣告時的累積超額報酬有著顯著負相關的關係。 關鍵詞:公司治理、併購、購併、累積超額報酬
iii 誌謝 本論文得以順利完成,首先我要感謝我的指導教授鍾惠民博士以及周幼珍博士, 他們耐心的教導給了我很大的幫助,另外,我也要感謝我的口試委員林美珍博士 與陳煒朋博士,他們在口試時給了我很多良好的建議,讓我的論文能夠更為完善。 我也要感謝交大財金所 96 級的同學,沒有你們,我就沒有這兩年多采多姿的研 究所生活。一同在鍾老師門下研究的紜齊、孝慈、怡婷以及玟均、感謝你們不時 的給我建議以及鼓勵、讓我更有信心能夠完成我的論文。我還要感謝昭華與彥霖, 教我這麼多 EXCEL 強大的功能,讓我省下了很多處理資料的時間。還有我的室友 嵐鈞,教導了我很多口試與簡報的技巧,讓我對於上台簡報不再這麼緊張。最後 我要感謝我的家人與我的女友,在背後默默地支持著我,沒有你們,也不會有今 日的我。 曾祥霈 謹誌於 新竹交通大學財金所 中華民國九十八年六月
iv Contents Abstract ... i Special Thanks………..iii Contents………....iv List of Tables……….v 1. Introduction ... 1 2. Sample Description ... 5 3. Empirical Results. ... 7 3.1. Variable Construction ... 7 3.1.1 Bidder board ... 11 3.1.2 Ownership ... 12 3.1.3 Bidder characteristics ... 14 3.1.4 Deal characteristics ... 17
3.2 Descriptive Summaries and Correlations... 19
3.3 Regression Results ... 21
4. Conclusions ... 26
Appendix……… ……… ………28
v
List of Tables
Table I Sample Distribution by Announcement Year………6
Table II Announcement Abnormal Returns……….10
Table III Summary Statistics………18
Table IV The Prediction of Explanatory Variables………..20
1
1. Introduction
In the U.S., Gompers, Ishii, and Metrick (2003) use the incidence of 24 governance rules to construct a “Governance Index” to proxy for the level of shareholder rights at about 1500 large firms during the 1990s. Then Masulis, Wang and Xie (2007) analyze the relationship between the GIM index and the acquisition CARs. They find that there is a significantly negative relation between these two items. In Taiwan, however, there is no such a thing like GIM index which can be a proxy for corporate governance. So in this dissertation, I use internal corporate mechanisms as my explanatory variables and analyze if there are relationships between internal corporate mechanisms and acquirers’ CARs. After reading this paper, you will realize what mechanisms have effects on the CARs in Taiwan stock market.
The ultimate goal of Corporate Governance for a company is to maximize the company’s stock price. Denis and McConnell (2003) define corporate governance as the set of mechanisms - both institutional and market-based - that induce the self-interested controllers of a company (those that make decisions regarding how the company will be operated) to make decisions that maximize the value of the company to its owners (the suppliers of capital). Shleifer and Vishny (1997) describe that corporate governance deals with the ways in which suppliers of finance to corporations assure themselves of getting a return on their investment.
2
Denis and McConnell (2003) state that the internal mechanisms of primary interest are the board of directors and the equity ownership structure of the firm. In Taiwan, the member of the board of directors is elected by the shareholders and it is the highest authority in the management of the corporation. The number of members of the board is usually specified by the company’s bylaws. The duties of board of directors include (1) governing the organization, (2) selecting, appointing, and reviewing the performance of the chief executive officer, and (3) approving annual budgets. Board composition is one issue that is often been studied. It includes board size and board structure. Board size means the number of directors that comprise the board and board structure means who comprise the board; independent members or not and if the CEO and chairman is the same person.
Ownership structure is the identities of firm’s equity holders and the size of their positions (Denis and McConnell (2003)). Ownership structure of a company will affect its performance by determining the degree of agency conflicts. A more concentrated ownership structure will minimize agency problems by aligning the interests of owners and managers. Hence, ownership structure is an important corporate governance mechanism.
There are mainly two ways for a company to amplify its scale. One way is through internal expansion which is using a company’s own capital to find investment
3
opportunities having positive net present value. The other is by Merger and acquisition (M&A) which is a fiercer and more rapid method than the former to expand a company. These investments also tend to intensify the inherent conflicts of interest between managers and shareholders in large public corporations (Berle and Means (1933) and Jensen and Meckling (1976)). Morck, Shleifer, and Vishny (1990) identify several types of acquisitions (including diversifying acquisitions and acquisitions of high growth targets) that can yield substantial benefits to managers, while at the same time hurting shareholders.
A merger is an activity to combine two companies into one larger company. These actions are usually voluntary and involve stock swap or cash payment to the target. Stock swap is often used because it allows the shareholders of the two companies to share the risk involved in the deal. An acquisition is an activity for a company to buy another company. This action can be friendly or hostile. In a friendly acquisition, the acquirer (buyer) negotiates the target (seller) before they act. However, in a hostile acquisition, the target may not know that some company is trying to buy it or even the target knows but it does not want to be bought. Acquisition commonly happens in the case that a bigger company purchases a smaller one. Nonetheless, it is still possible for a smaller company to buy a larger one. In an acquisition, an acquirer can purchase the target by stock, cash, or mixed.
4
Why do firms have incentives to engage in acquisition activities? There are several reasons:
Synergy: This means that the combined company can often decrease its fixed costs by removing overlapped departments or operation lines, lowering the costs of the company relative to the same revenue stream, thus increasing profits.
Market share: This assumes that the buyer will absorb a major competitor and thus increase its market power by capturing increased market share to set prices.
Cross-selling: For example, a bank buying a stock broker could then sell its banking products to the stock broker's customers, while the broker can sign up the bank's customers for brokerage accounts. Or, a manufacturer can acquire and sell complementary products.
Economy of scale: It is a reduction in long run unit costs which arise from an increase in production. It occurs when larger firms are able to lower their unit costs due to increased order size and associated bulk-buying discounts.
Taxation: A profitable company can purchase a firm which has negative net income and use the target's loss as their advantage by reducing their tax liability.
Geographical or other diversification: This is designed to smooth the earnings results of a company, which over the long term smoothes the stock price of a company, giving conservative investors more confidence in investing in the company. However,
5
this does not always deliver value to shareholders.
Vertical integration: Vertical integration occurs when upstream and downstream firms merge. By merging the vertically integrated firm can collect one deadweight loss by setting the upstream firm's output to the competitive level. This increases profits and consumer surplus. A merger that creates a vertically integrated firm can be profitable (Maddigan, Ruth, Zaima, and Janis (1985)).
In the next section, I am going to describe my data source and acquisition sample. Section 3 presents the empirical results on the influence of internal corporate
governance mechanisms on the profitability of acquisitions. Section 4 concludes this thesis.
2. Sample Description
I acquire the acquisition sample form the Securities Data Corporation’s (SDC) Taiwan Mergers and Acquisition database, and identify 118 acquisitions made by 83 companies in the period from January 1, 2000 to December 31, 2008 that meet the following criteria:
(1) The acquisition has completed.
(2) The acquirer owns 100% of the target’s shares after the transaction.
6
Economic Journal (TEJ) database and stock price data from the TWSE and GTSM 300 trading days prior to acquisition announcements.
Table I
Sample Distribution by Announcement Year
The sample consists of 118 completed mergers and acquisitions between 2000 and 2008 made by firms which are listed in TWSE and GTSM. Variable definitions are in the Appendix I.
Year Number of acquisitions
Percentage of sample
Mean Acquirer Mean acquirer Marketcap($mil) asset($mil) (Median) (Median) 2000 5 4.24% 183630 131688 (42475) (76525) 2001 7 5.93% 126696 93288 (39084) (34064) 2002 12 10.17% 37455 174250 (24228) (33373) 2003 16 13.56% 59178 165949 (44473) (64521) 2004 14 11.86% 76427 315334 (36389) (155018) 2005 24 20.34% 46253 301799 (23609) (47335) 2006 16 13.56% 71668 73388 (22453) (31904) 2007 10 8.47% 130609 112431 (73227) (90801) 2008 14 11.86% 154770 222959 (24964) (44194) Total 118 100.00% 80764 194146 (34165) (44186)
7
In Table I, I present summary statistics of the sample acquisition by announcement year. Starting from 2000, we can see that the number of acquisition in every year is increasing (except in 2004) until it reaches its highest level in 2005. Then it decreases from the highest level to about half of it in 2008. Table I also reports annual mean and median bidder market capitalization (measured 101 trading days before the announcement). Bidder market capitalization arrives to peak in the 2000 maybe because it is around the “bubble period”.
3. Empirical Results.
3.1. Variable Construction
In the next subsections, I discuss the measurement of categories of variables: Acquirer return as a dependent variable, board effect variables and ownership characteristic variables as explanatory variables, and bidder characteristics and deal characteristics as control variables.
I examine bidder announcement effect by market model returns which are around initial acquisition announcement. I obtain the announcement dates from SDC’s Taiwan Mergers & Acquisitions database. I compute five-day cumulative abnormal returns (CARs) during the window encompassed by the event days (-2, +2), where event day 0 is the acquisition announcement date. If the announcement date is not a
8
trading day, I consider the next trading day as the announcement date. TAIEX is used to count the market return and estimate the market model parameters over the period from 300 days to 101 days prior to the announcement date.
So called market model means that the return of the individual stock has a linear relationship to the market return. It can be shown as follow:
it i i mt it
R R
it
R : The return of stock i in the date t.
i
: The intercept of market model.
i
: The coefficient which measures the relation between market return and individual stock return
mt
R : Market return in the date t, here is the TAIEX return.
it
: Error term.
I then calculate Abnormal returns (ARs) by subtracting expected returns from real returns as follow:
ˆ
it it it
AR R R
In the equation above, Rˆit ˆi ˆiRˆmt.
Finally, I add up every AR in a specific period and obtain CAR,
2 2 ( 2, 2) i it t CAR AR
9
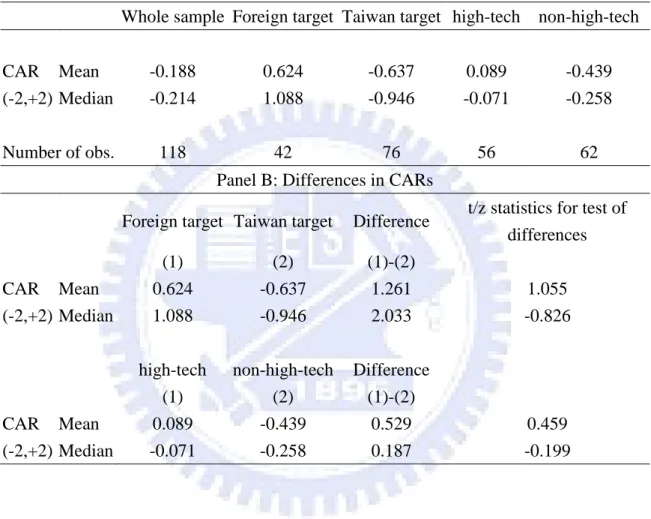
-0.188% which is not significantly different from zero. This result is consistent with Duggal (1995) who use 155 M&A samples from 1985 to 1989 which completed by firms listed in NYSE or ASE. He finds that acquirers have insignificant and negative announcement CARs.
However, for acquisitions that acquirers and targets are both classified as “high-tech” firms, the mean CAR is 0.089% which is higher than that (-0.188%) of whole sample. In contrast, for transaction that either acquirers or targets are not high-tech firms, the average CAR is -0.439%, lower than that (0.089%) of acquisition between two high-tech firms. Morck et al. (1990) consider that the acquisition between two related firms can generate higher acquisition CAR than between two unrelated firms so our result is close to theirs. On the other hand, when targets firms are located outside of Taiwan (foreign target), the average CAR of acquisitions is 0.624% which is higher than -0.637%, the mean CAR of transactions that have Taiwan Targets.
In the Panel B, I examine whether the difference between average CAR of transactions that have foreign targets and Taiwan targets is significant. The mean difference and median difference are 1.261% and 2.033% respectively but they are not significant. Kiymaz and Mukherjce (2000) use 253 acquisition cases made by listed companies in the U.S. in which there are 112 acquirers and 141 targets. They
10
find that acquisition CARs have no difference among acquirers with different targets. However, Doukas and Travlos(1988) use 301 acquisition cases from 1975 to 1983 as their research samples in which acquirers are listed in NYSE or AMEX. Their evidence show that firms undertaking international acquisitions can increase their stockholders wealth and if the acquirer never invests in the target’s nation, the acquirer can acquire significant profit from this international acquisition. Obviously,
Table II
Announcement Abnormal Returns
The sample consists of 118 completed mergers and acquisitions between 2000 and 2008 made by firms which are listed in TWSE and GTSM. Variable definitions are in the Appendix I.
Panel A: Announcement Abnormal Returns
Whole sample Foreign target Taiwan target high-tech non-high-tech CAR Mean -0.188 0.624 -0.637 0.089 -0.439 (-2,+2) Median -0.214 1.088 -0.946 -0.071 -0.258 Number of obs. 118 42 76 56 62
Panel B: Differences in CARs
Foreign target Taiwan target Difference t/z statistics for test of differences (1) (2) (1)-(2)
CAR Mean 0.624 -0.637 1.261 1.055 (-2,+2) Median 1.088 -0.946 2.033 -0.826
high-tech non-high-tech Difference (1) (2) (1)-(2)
CAR Mean 0.089 -0.439 0.529 0.459 (-2,+2) Median -0.071 -0.258 0.187 -0.199
11
our result is close to the result of Kiymaz and Mukherjce.
The mean difference and median difference between high-tech and non-high-tech transactions are 0.529% and 0.187% respectively and they both are insignificant.
I consider sorts of factors that are related to acquirer returns: bidder board effect, ownership effect, bidder characteristics and deal characteristics.
3.1.1 Bidder board
The Bidder’s board effect that I choose as explanatory variables are board size, board pledge rate, independent board, and CEO.
Board size is measured by the number of directors. Singh and Davidson (2003) show that board size has a negative effect on efficiency (efficient) of a company and when board size is larger, the agency problem will be severe. Yermack (1996) states that bigger board size will result in lower firm value.
Gao (2001) documents that board pledging rate has a negative effect on the firm performance and Yang (1998) also report that higher board pledging rate will lead to lower firm performance. Here I defined Board pledging rate as shares pledged by directors over the total shares they hold.
Weibach (1988) finds that when boards are dominated by independent directors, CEO turnover is more sensitive to firm performance. Brickley, Coles, and Terry (1994) find that the stock market reacts positively to the adoption of poison pills by
12
firms with independent boards and vice versa. Independent board variable is defined as the number of independent directors over the number of total directors,
CEO is a dummy variable. It is equal to 1 if the bidder’s CEO is also chairman of the board, and 0 otherwise. I obtain this data from TEJ database for the period from 2000 to 2008. Core, Holthausen, and Larcker (1999) report that if CEO and Chairman is the same person, it will lead to a higher CEO salary. Masulis, Wang and Xie (2007) find that separating the positions of CEO and chairman of the board experience higher abnormal announcement returns.
3.1.2 Ownership
Ownership effect that I choose as explanatory variables are excess control, board holding rate, blockholders holding rate, managers holding rate, foreign investors holding rate and family holding rate.
Excess control is the wedge between voting and cash flow rights of the ultimate owner. It provides large controlling shareholders with inducements to derive private benefits that benefit themselves at the expense of other shareholders (Shleifer and Vishny, 1997; Bebchuk, Kraakman, and Triantis, 2000). A growing empirical evidence suggests that excess control is negatively associated with firm value, consistent with the entrenchment effect (Claessens, Djankov, Fan, and Lang, 2002; Mitton, 2002; La Porta, Lopez-de-Silanes, and Shleifer, 2002; Lemmon and Lins,
13
2003; and Baek, Kang, and Park, 2004).
When Shares held by managers and blockholders are higher, it means that management right and ownership right have closer relationship. According to Jensen and Meckling (1976), if the relationship between management right and ownership right is closer, the agency problem will be less serious. That is to say, when managers are assessing an investment project with a close relationship between management right and ownership right they will consider how to increase stockholder’s wealth and put it as an important factor. Hence, compared with firms with lower board holding rate, ones with higher board holding rate will have higher CAR when announce acquisitions. The study by McConnell and Servaes (1990) suggest that manager and board holding rate have positive effects on the firm value. However, Morck et al. (1990) consider that insiders tend to allocate the resources of the firm in accordance with their own benefit which often has conflict with the benefit of stockholders. As insiders holding rate increases, insiders have more power to protect their benefit. In other words, acquirers with higher insiders holding rate will have lower CAR when acquisitions are announced. I define board holding rate as shares held by directors over the total shares outstanding, blockholders holding rate as shares held by blockholders (at least 10%) over the total shares outstanding and managers holding rate as shares held by managers over the total shares outstanding.
14
Pound (1988) proposes three hypotheses which are efficient monitoring hypothesis, conflict of interest hypothesis and strategic alignment hypothesis. The latter two hypotheses consider that increasing ratio of institutional investor’s share has a negative effect on the firm operation and then cause management make bad M&A decisions. Foreigner investors holding rate is defined as shares held by foreign investors over the total shares outstanding.
The last explanatory variable of ownership is family holding rate which is defined as shareholdings of family members, including individuals, or foundations and corporations controlled by family members, over the total shares outstanding. Demsetz & Lehn (1985) point that family firms have ownership and control right simultaneously which can mitigate interest conflicts between managers and shareholders so managers will make better investment decision for stockholders. Hence I involve this variable in the research and see if it has an effect on acquirers CARs.
3.1.3 Bidder characteristics
The bidder characteristics that I consider as important factors are firm size, Tobin’s Q, free cash flow (FCF), leverage and stock price runup.
Moeller, Schlingemann, and Stulz (2004) found (find) robust evidence that bidder size is negatively correlated with the acquirer’s announcement-period CAR.
15
They consider this size effect as evidence supporting the managerial hubris hypothesis proposed by Richard Roll (1986) because they find that larger acquirers generally pay higher premiums and make acquisitions that generate negative synergies. There is another explanation that large firm size is seen as a very effective takeover defense because it takes more resources to acquire a larger target. Masulis et al. (2007) indicate that managers of larger firms are more likely to make value-reducing acquisitions. In my empirical tests, firm size is defined as the book value of total asset in billion.
Lang, Stulz, and Walking (1989) document a positive relation between Tobin’s Q and tender offer acquisitions and between Tobin’s Q and public firm acquisitions, respectively. However, Moeller, Schlingemann, and Stulz (2004) find a negative relation in a comprehensive sample of acquisitions. Therefore, the effect of Tobin’s Q on the acquisition CAR is vague. I define Tobin’s Q as the ratio of bidder’s market value of total asset over its book value of total asset, where the market value of asset is computed as the market value of total equity plus the book value of total debt.
In this thesis, I define Free Cash Flow (FCF) as operating cash flow minus capital expenditures, scaled by book value of total asset. Jensen’s (1986) free cash flow hypothesis considers that managers seek to accumulate perquisites in their own self-interest and as a firm becomes larger, more opportunities exist for managers to
16
indulge their needs for pecuniary and non-pecuniary (power and prestige) benefits. Unless properly controlled, such behavior can lead to managers making inefficient expenditures by taking on less than optimal (i.e. below cost of capital) investments when they attempt to grow the firm. That is to say, good managers are those who dispose of excess cash flows by increasing dividends and share repurchase programs. Bad managers who are interested in increasing their perquisites will retain cash in order to grow the firm by engaging in (unprofitable) acquisition or other expansion behavior. However, higher free cash flow can be seen as a proxy for better recent performance that can be correlated with better management. Hence, free cash flow can have positive or negative effects on acquisition CAR.
Leverage is also an important governance mechanism because higher debt level helps reduces free cash flow in the future and put a limitation on managerial discretion. Renneboog (2000) documents that with higher leverage, creditors are more concern about firm performance and their supervision on the firm is stronger, which can force management to make better M&A decisions. However, Agrawal and Knoeber (1996) report that leverage has a negative relationship with firm performance. In this article, I define leverage as total debt over total asset.
Masulis et al. (2007) in their research find that bidder pre-announcement stock price runup has a significantly negative effect on bidder returns so I choose it as a
17
variable which is defined as the bidder’s buy-and-hold abnormal return over the 200-day window from event day -300 to event -101 with the TAIEX as the benchmark.
3.1.4 Deal characteristics
The deal characteristics which we choose (I choose) as the control variables are the nation of the target and whether the acquirer and the target are both high-tech firms
Masulis, Wang and Xie (2007) state that bidder returns are lower in deals involving two high-tech companies. Here I define high-tech as a dummy variable which equals one if both acquirer and target are high-tech firms and zero otherwise.
Another variable regarding deal characteristic is the nation of the target, a dummy variable which equals one if the target are domiciled in the country outside of Taiwan and zero otherwise. The rise of globalization has exponentially increased the market for cross border M&A. This rapid increase has taken many M&A firms by surprise because the majority of them never had to consider acquiring the capabilities or skills required to effectively handle this kind of transaction. Because of the complicated nature of cross border M&A, the vast majority of cross border actions have unsuccessful results. Cross border acquisition has more levels of complexity than regular one. The power of the average employee, company regulations, political
18
factors, customer expectations, and countries' culture are all crucial factors that could spoil the transaction.
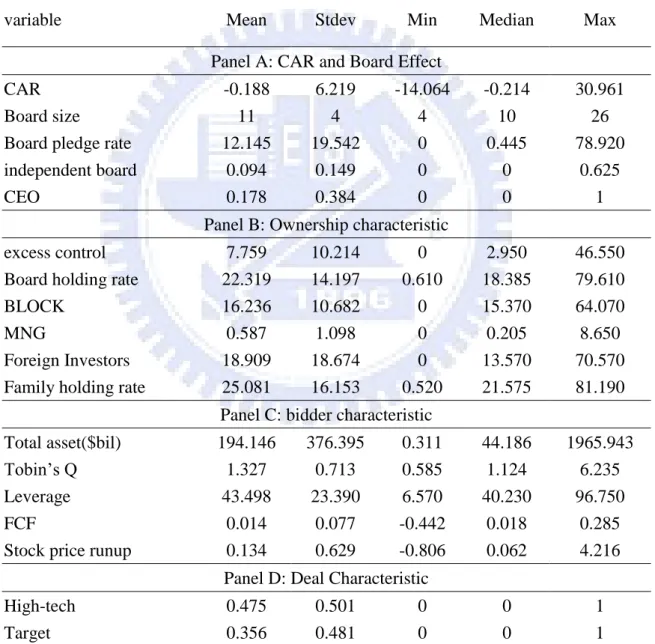
Table III Summary Statistics
The sample consists of 118 completed mergers and acquisitions between 2000 and 2008 made by firms which are listed in TWSE and GTSM. Variable definitions are in the Appendix I.
variable Mean Stdev Min Median Max Panel A: CAR and Board Effect
CAR -0.188 6.219 -14.064 -0.214 30.961 Board size 11 4 4 10 26 Board pledge rate 12.145 19.542 0 0.445 78.920 independent board 0.094 0.149 0 0 0.625
CEO 0.178 0.384 0 0 1
Panel B: Ownership characteristic
excess control 7.759 10.214 0 2.950 46.550 Board holding rate 22.319 14.197 0.610 18.385 79.610 BLOCK 16.236 10.682 0 15.370 64.070 MNG 0.587 1.098 0 0.205 8.650 Foreign Investors 18.909 18.674 0 13.570 70.570 Family holding rate 25.081 16.153 0.520 21.575 81.190
Panel C: bidder characteristic
Total asset($bil) 194.146 376.395 0.311 44.186 1965.943 Tobin’s Q 1.327 0.713 0.585 1.124 6.235 Leverage 43.498 23.390 6.570 40.230 96.750 FCF 0.014 0.077 -0.442 0.018 0.285 Stock price runup 0.134 0.629 -0.806 0.062 4.216
Panel D: Deal Characteristic
High-tech 0.475 0.501 0 0 1 Target 0.356 0.481 0 0 1
19
3.2 Descriptive Summaries and Correlations
According to Table III, we can see that mean acquisition CAR is -0.188% and the highest number and the lowest number is 30.961% and -14.064%. Mega Biotech & Electronics Co (Code: 4415) has the highest CAR and Wah Hong Industrial Corp
(Code: 8240) has the lowest one. Average board size is 11 and the maximum and minimum is 26 and 4. The mean board pledge rate is only 12.145% but the maximum amount to 78.92% which is by Acer (code: 2353).
Next is about ownership characteristics. The mean excess control is only 7.759%, however, the maximum reaches up to 46.55% which is created by Lite-On IT Corp (Code: 8008). As for insider holding rate, we can see that the board holding rate is higher than blockholders holding rate and managers holding rate. The range of the board holding rate is rather wide. The board holding rate of Chunghwa Telecom Co Ltd mounts up to 79.61% which is the highest number among all companies but that of ProMos Technologies Inc is only 0.61%. The average holding rate of board, blockholders, and managers are 22.319%, 16.236%, and 0.587%, respectively. Foreign investors holding rate is an important index for corporate governance. The highest foreign investors holding rate is 70.57% which is the number of Advanced Semiconductor (code: 2311). Family holding rate is between 0.52% and 81.19%.
20
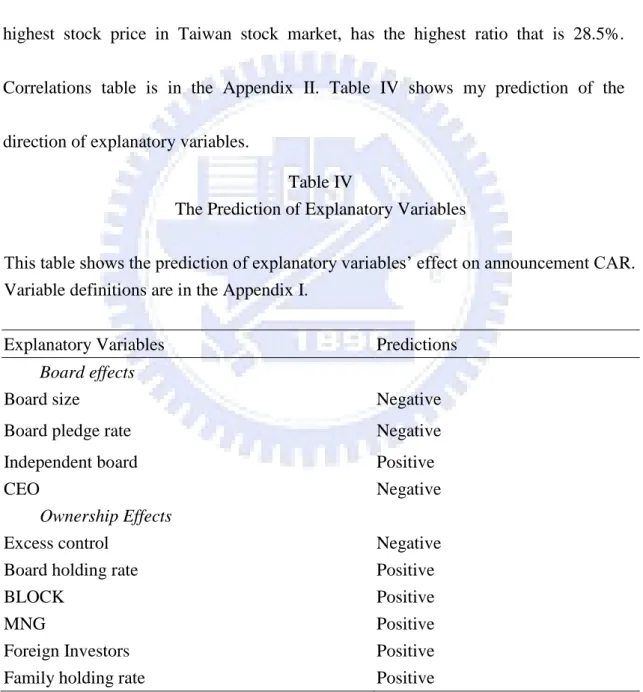
The total asset of Taiwan Cooperative Bank (code: 5854) is as high as 1966 billion and that of Mega Biotech & Electronics Co (code: 4415) is only 0.311 billion. The mean leverage is 43.5%, however, this number of Taiwan Cooperative Bank (code: 5854) is 96.75% which is almost twice the average number. The mean ratio of free cash flow to total asset is 1.4% and the HTC corp. (code: 2498), which owns the highest stock price in Taiwan stock market, has the highest ratio that is 28.5%. Correlations table is in the Appendix II. Table IV shows my prediction of the direction of explanatory variables.
Table IV
The Prediction of Explanatory Variables
This table shows the prediction of explanatory variables’ effect on announcement CAR. Variable definitions are in the Appendix I.
Explanatory Variables Predictions
Board effects
Board size Negative Board pledge rate Negative Independent board Positive
CEO Negative
Ownership Effects
Excess control Negative Board holding rate Positive
BLOCK Positive
MNG Positive
Foreign Investors Positive Family holding rate Positive
21
3.3 Regression Results
Firstly, I use board effect variables as explanatory variables and bidder characteristics and deal characteristics as control variables. The dependent variable is five-day CAR around each acquisition announcement. In Table V (1), we can see that no board effect variable has a significant effect on the acquisition CAR but some of bidder characteristics variables show significant effects on the acquisition CAR. Firm size has a positive relationship with CAR, it shows that the larger the firm size is, the higher the CAR is. Asquith, Bruner and Mullins (1983) use 214 acquisition events as the research sample and their result shows that firm size and the acquisition CAR have a positive relation. Hence my result is consistent with theirs. Tobin’s Q can be seen as a proxy for the firm operation performance and in my regression and it also has a significant positive effect on bidder returns. Lang, Stulz, and Walking (1989) and Servaes (1991) document a positive relation between Tobin’s Q and tender offer acquisitions and between Tobin’s Q and public firm acquisitions, respectively. Hence this result is within our expectation. Leverage and stock price runup both have significant negative effects on the acquisition CAR. Runup is highly significant and this is coherent with the result of Masulis, Wang, and Xei (2007). I expect the leverage has a positive effect on the announcement CAR because if firms with higher leverage the creditor will monitor the firms more severe. However, the result is not as
22
Table V
Regression Analysis of Bidder Returns1
The sample consists of 118 completed mergers and acquisitions between 2000 and 2008 made by firms which are listed in TWSE and GTSM. The dependent variable is the bidder’s 5-day cumulative abnormal return in percentage points. Variable definitions are in the Appendix I. In parentheses are t-statistics. ***, **, and * stand for statistical significance based on two-sided tests at the 1%, 5%, and 10% level, respectively.
(1) (2) (3)
Board effects
Board size 0.108 -0.015 (0.596) (-0.085) Board pledge rate -0.009 -0.018
(-0.304) (-0.592) Independent board -4.051 -4.525 (-1.064) (-1.175) CEO 1.686 2.211 (1.118) (1.455) Ownership Effects Excess control 0.061 0.090 (1.056) (1.488) Board holding rate 0.013 0.007
(0.222) (0.116) BLOCK 0.156** 0.144** (2.581) (2.334) MNG -0.613 -0.732 (-1.277) (-1.466) Foreign Investors -0.066** -0.069** (-2.092) (-2.156) Family holding rate -0.053 -0.044
(-0.985) (-0.801) Bidder Characteristics Asset(billion) 0.004* 0.007*** 0.007*** (1.855) (3.308) (3.160) Tobin’s Q 1.841** 1.855** 1.679* (2.181) (2.221) (1.944) Leverage -0.063* -0.108*** -0.100*** (-1.920) (-3.226) (-2.886) FCF -3.573 -7.775 -5.061 (-0.483) (-1.067) (-0.676) Stock price runup -4.642*** -4.801*** -4.919***
(-4.837) (-5.241) (-5.231) Deal Characteristics High-tech 0.277 -0.305 0.085 (0.253) (-0.291) (0.079) Target -0.511 -0.776 -0.578 (-0.428) (-0.663) (-0.490) Intercept -0.920 1.530 1.453 (-0.320) (0.666) (0.465) Number of obs. 118 118 118 Adjusted-R2 14.80% 22.00% 21.50%
23
my forecast and leverage negatively affects CAR. Maybe because better firms in Taiwan tend to have lower leverage than worse firms and better firms is apt to make value-adding M&A, there is a negative relationship between leverage and CAR. Next, I use Ownership effect variables as explanatory variables and bidder characteristics and deal characteristics as control variables. The dependent variable is also five-day CAR. In Table V (2) we can see that some of ownership effect variables have significant influences on the dependent variable. As blockholders holding rate is higher, the acquisition CAR is larger and this result is inherent with Radd and Wu (1994) who use 105 acquisition events from 1981 to 1986 as their sample and find the same result. Shleifer and Vishny (1986) also find that a firm with higher ownership concentration can have higher acquisition CAR. However, foreign investors holding rate has a negative effect on the CAR, which is consistent with
Pound’s (1988) strategic alignment hypothesis which consider that when there is cooperation between the institutional investor and the management of the firm, due to the relationship benefit, the institutional investor will not monitor the firm well and tend to indulge the management of the firm. Hence this firm’s management is apt to
1
I use the Breusch-Pagan test to test whether conditional heteroskedasticity is present. The test statistics for the Breusch-Pagan test in three regression models are 13.92, 18.11, and 20.24 respectively and the one-tailed critical value for a chi-square distribution with 11, 13, and 17 degree of freedom and alpha equal to 5% is 19.68, 22.36, and 27.59. Hence I do not reject the null hypothesis that the regression models have conditional heteroskedasticity and conclude that there are no conditional heteroskedasticity problems in three regression models.
24
make value-reducing acquisition decisions. Meanwhile, the significant bidder characteristics variables in first regression are significant as well in this regression and they are firm size, Tobin’s Q, leverage, and stock price runup.
In the last regression (Table V (3)), I use all variables in this article to explain the acquisition CAR. As before, every board effect has no significant effect on the bidder’s return and those significant variables in previous two regressions are still significant in this regression. It means that these variables have genuine influence on acquisition CAR. The bottom line is that blockholders holding rate, firm size, and Tobin’s Q have significant positive effects on the CAR and on the contrary, foreign investors, leverage, and stock price runup have a negative effect on the bidder’s return. On the other hand, board effect variables and deal characteristics variables have no significant influences on the CAR.
We can see that board size have no significant effect on the CAR and the coefficients in the regression model (1) and (3) are different in their direction. It means that no matter how big or small the board size is, it has no influence on the CAR. Board pledge rate is predicted to have a negative influence on the CAR. Although they are not significant in two regression models, their coefficients are both negative and show that they negatively affect the announcement CAR. Surprisingly, Independent board is a variable which has a negatively insignificant effect on the
25
dependent variable. Maybe because these independent directors do not monitor the companies well or they do not have enough professional knowledge in dealing with merger and acquisition. CEO also has a direction different from my expectation. In Taiwan it is common for a big company whose CEO is also the chairman of the board of director. Due to this phenomenon, CEO variable has positive influence on the announcement CAR.
In my prediction, excess control should have negative effect on the CAR; however, in my research it is positively but insignificant related with the CAR. Excess control is voting right minus cash flow right and higher excess control means higher voting right or lower cash flow right. A company with higher excess control tends to have higher cost of equity but it does not mean that this company will make bad acquisition decisions. This result needs more following research to justify. Board holding rate is predicted to have a positive effect on the CAR and the result is identical to my expectation; however the effect is not significant in both regression models. Managers holding rate is expected to have the same effect as board holding rate on the CAR but the result is not like our forecast. It has an insignificantly negative influence on the dependent variable. Generally, higher the manager’s holding rate, lower the agency cost and managers with higher holding rate tend to make better M&A decisions for themselves and other stockholders. Maybe it is because managers
26
with higher holding rate are more desirous of expanding the scale of company to acquire more benefit, they lack ripe deliberation and hence make value-reducing M&A decisions. Family holding rate shows a negative but insignificant effect on the CAR. Family holding rate has an insignificantly negative relation with the CAR. Although higher family holding rate can reduce the conflict of interest between stockholders and managers, it may give the management too much power to make good M&A decisions. The family have high holding rate so other stockholders and creditors can not possess enough power to monitor or affect their decision-making. Hence, higher family holding rate may result in lower announcement CAR.
4. Conclusions
The board of directors and the equity ownership structure of the firm are two important corporate governance mechanisms and in this article, I use Taiwan acquisition data from 2000 to 2008 which include 118 acquisition cases made by 83 firms listed in TWSE and GTSM. Although board of directors is one of an important CG mechanism, it has no significant effect on the acquisition CAR in all three regression models.
On the other hand, ownership structure has some influence on bidder’s return. We can find that blockholders and foreign investors holding rate both have significant
27
effects on the CAR and deal characteristics have no significant effect on the CAR. This paper is the first one to link internal CG mechanisms and acquirer returns in Taiwan and I find that some mechanisms do have influence on the acquirer returns.
Although some variables in this model have explanatory capability to the CAR, the number of acquisition cases is too few to do a perfect research. My sample contains only 118 acquisition event and thus the variables are sensitive to any tiny move. It is because there are fewer acquisition cases in Taiwan than in the US and there is no professional institution which is professional in collecting M&A’s data. It makes the research in M&As in Taiwan market hard.
For investors, at least they have some directions to decide if they should invest a company when the company announces an acquisition. Because the acquisition CAR in this sample is not significantly different from zero, investors should watch bidder’s corporate governance and its characteristics when they choose stocks.
28
Appendix I: Variable Definitions Variable Definitions
Panel A: CAR and Board Effect
CAR Five-day cumulative abnormal return (in percentage point) calculated using the market model. The market model
parameters are estimated using the return data for the period (-300,-101)
Board size Number of directors on bidder’s board.
Board pledge rate Shares pledged by directors over the total shares they hold.
Independent board Number of independent directors over the number of total directors
CEO Dummy variable: 1 if the bidder CEO is also chairman of the board, 0 otherwise.
Panel B: Ownership Effect Excess Control Voting right minus cash flow right
Board holding rate Shares held by directors over the total shares outstanding.
BLOCK Shares held by blockholders (at least 10%) over the total shares outstanding.
MNG Shares held by managers over the total shares outstanding.
Foreign Investors Shares held by foreign investors over the total shares outstanding. Family holding
rate
Shares held by family members, including individuals, or foundations and corporations controlled by family members, over the total shares outstanding.
Panel C: Bidder Characteristics Firm size Book value of total assets ($billions) Market
capitalization
Number of shares outstanding multiplied by the stock price at the 101st Trading day prior to announcement date
Tobin’s Q Market value of total equity plus book value of total debt over book value of total asset
Free cash flow Operating cash flow-capital expenditures scaled by book value of total asset
Leverage Total debt over total asset
Stock price runup Bidder’s buy-and-hold abnormal return during the period (-300,-100). The market index is the TAIEX.
Panel D: Deal Characteristics
High-tech Dummy variable: 1 if bidder and target are both from the high tech industries, 0 otherwise.
Target Dummy variable: 1 if the target is domiciled in the country outside of Taiwan, 0 otherwise
29
Appendix II: Pearson Correlation Matrix
The sample consist of 118 completed Taiwan mergers and acquisitions (listed in SDC) between 2000and 2008 made by firms listed in TWSE and GTSM. P-values are shown in parentheses. Variable definitions are in the Appendix I.
CAR Board size Board pledge rate Independe nt board CEO Excess control Board holding rate BLOCK MNG Foreign
Investors Family Asset
Tobin’s Q Leverage FCF Board size -.072 (.440) Board pledge rate -.048 .251 (.605) (.006) Independe nt board -.053 -.120 -.228 (.570) (.196) (.013) CEO .107 -.286 -.184 .200 (.250) (.002) (.046) (.030) Excess control .000 .013 -.004 .229 -.154 (.999) (.888) (.963) (.013) (.096) Board holding rate -.052 .146 -.067 -.001 -.137 .289 (.572) (.115) (.474) (.990) (.139) (.002) BLOCK .147 .050 .051 -.049 .031 -.071 -.139 (.112) (.587) (.582) (.596) (.742) (.445) (.134) MNG -.110 -.103 -.138 .204 .173 .150 .048 .029 (.236) (.267) (.138) (.027) (.061) (.105) (.606) (.752) Foreign Investors -.077 -.089 -.042 -.015 .128 -.312 -.275 .081 .060 (.407) (.340) (.655) (.871) (.169) (.001) (.003) (.385) (.522) Family -.056 .189 .042 .014 -.141 .308 .699 .225 .107 -.293 (.544) (.041) (.652) (.879) (.129) (.001) (.000) (.014) (.247) (.001) Asset(billi on) -.058 .509 .249 -.059 -.126 -.197 -.006 -.012 -.092 .177 .010 (.535) (.000) (.006) (.527) (.174) (.032) (.949) (.895) (.321) (.055) (.914) Tobin’s Q .111 -.204 -.244 .008 .100 -.013 -.124 .155 -.016 .240 -.216 -.139 (.231) (.027) (.008) (.928) (.280) (.888) (.180) (.095) (.865) (.009) (.019) (.134) Leverage -.161 .273 .296 -.050 -.121 -.088 -.130 .201 -.088 .042 .027 .656 -.156 (.082) (.003) (.001) (.587) (.191) (.344) (.160) (.029) (.343) (.653) (.769) (.000) (.092) FCF .006 .009 .016 .118 -.069 .092 -.055 .132 .138 .166 -.065 .010 .184 -.187 (.946) (.925) (.862) (.202) (.457) (.324) (.557) (.154) (.137) (.072) (.486) (.916) (.046) (.042) Stock price runup -.364 .278 -.047 -.062 -.035 .080 .133 -.026 -.048 -.033 .088 .299 .197 .149 .033 (.000) (.002) (.614) (.505) (.704) (.387) (.152) (.782) (.602) (.720) (.343) (.001) (.032) (.107) (.723)
30
Reference
1. Agrawal, A. and C.R. Knoeber 1996, Firm Performance and Mechanisms to Control Agency Problems between Managers and Shareholders, Journal of Financial and Quantitative Analysis 31, 377-397.
2. Asquith, P., Bruner and D. Mullins 1983, The Gains to Bidding Firms from Merger, Journal of Financial Economics 11, 121-140.
3. Baek, J., J. Kang, and K. Park, 2004, Corporate Governance and Firm Value: Evidence from the Korean Financial Crisis, Journal of Financial Economics 71, 265-313.
4. Bebchuk, L., Kraakman, R., and Triantis, G., 2000, Stock Pyramids, Cross-Ownership, and Dual Class Equity: The Creation and Agency Costs of Separating Control From Cash Flow Rights, in R. K. Morck, ed.: Concentrated Corporate Ownership, University of Chicago Press: Chicago, IL, 295-315.
5. Berle, Adolph A., and Gardiner C. Means, 1933, The Modern Corporation and Private Property, New York: Commerce Clearing House.
6. Brickley, James A., Jeffrey L. Coles, and Rory L. Terry, 1994, Outside directors and the adoption of poison pills, Journal of Financial Economics 35, 371–390. 7. Claessens, S., S. Djankov, J. Fan, and L. Lang, 2000, The Separation of
Ownership and Control in East Asian Corporation, Journal of Financial Economics 58, 81-112.
8. Core, John E., Robert W. Holthausen, and David F. Larcker, 1999, Corporate governance, chief executive officer compensation, and firm performance, Journal of Financial Economics 51, 371–406.
9. Diane K. Denis and John J. McConnell, 2003, International Corporate Governance, The Journal of Financial and Quantitative Analysis, 38, No. 1, 2–36 10. Doukas, J. and Nickolaos G. Travlos 1988, “The Effect of Corporate
Multinationalism on Shareholders’ Wealth: Evidence from International Acquisitions,” The Journal of Finance 38, 1161-1175.
11. Duggal, R 1995, “Agency Cost and Firm Value: Further Evidence From Bidding Firms” International Journal of Finance, 7(2), 1183-1194
12. Isabelle Dherment-Ferere and Luc Renneboog, 2000, Share Price Reactions to CEO Resignations and Large Shareholder Monitoring in Listed French Companies, Center for economic research Working Paper No. 2000-70.
13. Jensen, Michael C., 1986, Agency costs of free cash flow, corporate finance, and takeovers, American Economic Review 76, 323–329.
14. Jensen, Michael C., and William H. Meckling, 1976, Theory of the firm: Managerial behavior, agency costs, and ownership structure, Journal of Financial
31
Economics 3, 305–360.
15. King, D. R., Slotegraaf, R. and Kesner, I., 2008, Performance implications of firm resource interactions in the acquisition of R&D-intensive firms, Organization Science 19 (2), 327–340.
16. Kiymaz, H. and T. K. Mukherjce, 2000, The Impact of Country Diversification on Wealth Effects in Cross-Border Mergers, The Financial Review 35, 37-58. 17. La Porta, R., F. Lopez-de-Silanes, A. Shleifer, and R. W. Vishny, 2002. Investor
Protection and Corporate Valuation, Journal of Finance 57, 1147-1170.
18. Lang, Larry H.P., Rene M. Stulz and Ralph A. Walking, 1989, Managerial Performance, Tobin’s Q and The Gains from Successful Tender Offers, Journal of Financial Economics 24, 137-154
19. Lemmon, M., and K. V. Lins, 2003, Ownership Structure, Corporate Governance, and Firm Value: Evidence from the East Asian Financial Crisis, Journal of Finance 58, 1445-1468.
20. Maddigan, Ruth, Zaima and Janis, 1985, The Profitability of Vertical Integration", Managerial and Decision Economics 6 (3): 178–179.
21. McConnell, J. and H. Servaes, 1990, Additional evidence on equity ownership and corporate value, Journal of Financial Economics 27, 595-612.
22. Moeller, Sara B., Frederik P. Schlingemann, and Ren´eM. Stulz, 2004, Firm size and the gains from acquisitions, Journal of Financial Economics 73, 201–228. 23. Morck, Randall, Andrei Shleifer, and Robert W. Vishny, 1990, Do managerial
incentives drive bad acquisitions? Journal of Finance 45, 31–48.
24. Pound, J. 1988, Proxy contests and the efficiency of shareholder oversight. Journal of Financial Economics 20, 237-265.
25. Radd, F., and H.K. Wu, 1994, Acquiring Firm’s Stock Returns: Method of Payment, Change in Leverage, and Management Ownership, Journal of Economics and Finance, Spring, 13-29
26. Ronald W. Masulis, Cong Wang, and Fei Xei, 2007, Corporate Governance and Acquirer Returns, The Journal of finance 62, N0. 4, 1851-1889.
27. Shleifer, Andrei, and Robert W. Vishny, 1997, A survey of corporate governance, Journal of Finance 52, 737–783.
28. Singh, M. and W. N. Davidson, 2003, Agency cost, ownership structure and corporate governance mechanisms, Journal of Banking and Finance 27, 793-816. 29. Yermack, David L., 1996, Higher market valuation of companies with a small
board of directors, Journal of Financial Economics 40, 185–212.
30. 高蘭芬, 2001,「董監事股權質押之代理問題對會計資訊與公司績效之影響」, 國立成功大學會計學系博士論文。
31. 楊麗弘, 1998 ,「台灣上市公司股權結構與經營績效研究」,長庚大學管理學 研究所碩士論文。