尼加拉瓜的財務素養 - 政大學術集成
56
0
0
全文
(2) 尼加拉瓜的財務素養 Financial Literacy in Nicaragua. 研究生:米愛蓮. Student: Elaine Miranda. 指導教授:蔡政憲. Advisor: Jason Tsai. 國立政治大學. 學. ‧ 國. 立. 政 治 大. ‧. 商學院國際經營管理英語碩士學位學程 碩士論文. er. io. sit. y. Nat. A Thesis. n. a to International MBA Program Submitted iv l C n U NationalhChengchi University engchi. in partial fulfillment of the Requirements for the degree of Master in Business Administration. 中華民國一○二年四月 April 2013.
(3) AKNOWLEDGEMENT Almost two years have gone by since I started this MBA program. Time flies. Living and studying in Taiwan has been a once in life time opportunity that I’m very grateful for. I’ve met wonderful people who have become my friends, my professors, my colleagues, and from whom I have learned. People I wouldn’t have gotten to know under different circumstances. The completion of this thesis would not have been possible without the help, support, guidance and encouragement from the very beginning, till the very end, of my thesis advisor Jason Tsai. To all the people in Nicaragua who helped me fill out the survey: to you, I owe. 政 治 大. my thesis, your answers and thoughts on it made it what it is.. 立. Special thanks to my mom for her continuous support, for believing in me and holding my. ‧. ‧ 國. 學. hand in each step I’ve taken in life.. n. al. er. io. sit. y. Nat Elaine Miranda. April, 2013.. Ch. engchi. i. i n U. v.
(4) ABSTRACT Financial Literacy in Nicaragua By Elaine Miranda Financial literacy is the ability to understand how money works, it refers to the set of skills and knowledge that allows an individual to make informed and effective decisions with all of their financial resources. Raising financial literacy levels is a major concern around the world, because it affects how people save, spend, and invest, as well as their ability to create and. 政 治 大 However, Nicaragua is far立 behind. I started working under the assumption that financial grow income.. ‧ 國. 學. literacy levels in Nicaragua were very low, because of a series of factors. Among them, the macro and micro economic conditions –including poverty level and education-, the unawareness from the government of the importance of financial literacy in people’s lives, the. ‧. lack of financial advisors nationwide, etc.. Nat. sit. y. To prove my theory, I decided to do a 25 question, online survey in Nicaragua. During a one. io. er. week period, 343 people from all age ranges answered it and provided me with insights that allowed me to analyze their financial health, as well as their relationship with money. The. n. al. Ch. i n U. v. three main objectives I was looking to accomplish with the survey were: to determine the. engchi. current situation of financial literacy in Nicaragua, to evaluate the market’s needs regarding personal finance, and to assess the potential market for a personal finance in advisor. After reviewing the particular socio-economic conditions of the country, I guide you through the questionnaire Nicaraguans had to answer, and provide results and analysis based on them. The lack of financial culture in the country is evident from the beginning till the end of the questionnaire, but the results offer a starting point to increase financial literacy levels. Some of the main conclusions delivered by this analysis are that people tend to overestimate their financial knowledge and rate their performance and actions better than they actually are, and that most of them are eager to learn about personal finance and lead a healthier financial life.. ii.
(5) TABLE OF CONTENTS 1.. Introduction ........................................................................................................................ 1. 2.. Nicaragua ............................................................................................................................ 3 2.1.. General.................................................................................................................... 3. 2.2.. Population ............................................................................................................... 4 Age distribution .......................................................................................... 4. 2.2.2.. Demographic Bonus ................................................................................... 4. 2.2.3.. Education .................................................................................................... 5. ‧. Nicaragua and Personal Finance ............................................................................ 8. y. sit. io. al. er. Design of Questionnaire ................................................................................................... 10. v. Survey ................................................................................................................... 11. n. 3.1. 4.. Poverty ........................................................................................................ 7. Nat. 3.. ‧ 國. Economy ................................................................................................................. 6 2.3.1.. 2.4.. 立. 政 治 大. 學. 2.3.. 2.2.1.. Ch. engchi. i n U. Results and Analysis ......................................................................................................... 17 4.1.. Part 1: Demographic Data .................................................................................... 17. 4.2.. Part 2: Self-assessment ......................................................................................... 19. 4.3.. Part 3: Financial Performance .............................................................................. 25. 4.4.. Part 4: Financial Help ........................................................................................... 32. 4.5.. Cross-Analysis ...................................................................................................... 37 4.5.1.. Age 26-35 ................................................................................................. 39. 4.5.2.. Age 36-45 ................................................................................................. 40. iii.
(6) 4.5.3. 4.6.. Market Potential ............................................................................................................... 46 5.1.. Personal Finance Advice ...................................................................................... 46. 5.2.. Improving Financial Literacy ............................................................................... 47. References ........................................................................................................................ 49. 立. 政 治 大. 學 ‧. io. sit. y. Nat. n. al. er. 6.. Survey Conclusions .............................................................................................. 42. ‧ 國. 5.. Employed vs. Own Business and Freelancers .......................................... 41. Ch. engchi. iv. i n U. v.
(7) 1. Introduction Financial literacy means different things to different people. For some it is a wide-ranging concept, incorporating economics and how household decisions are affected by economic conditions and circumstances. For others, financial literacy means focusing quite narrowly on basic money management skills – budgets, savings, investments, and insurance1. For the understanding of this thesis, the concept will be used as follows: “financial literacy is the ability to understand finance. More specifically, it refers to the set of skills and knowledge that allows an individual to make informed and effective decisions through their understanding of finances.”2. 立. 政 治 大. Financial literacy is important for individual consumers of financial services, the financial. ‧ 國. 學. system and the wider economy. It influences how people save, borrow, invest and manage their financial affairs. It therefore affects their capacity to grow their wealth and income, and. ‧. has significant implications for people’s lifestyle choices.. y. Nat. This thesis raises some concerns regarding financial literacy in Nicaragua. The evidence. n. al. er. io. that most Nicaraguans have limited financial literacy.. sit. presented further on –which comes from a survey to Nicaraguans and its analysis-, suggests. i n U. v. However, there is no one in the country currently working on the improvement of financial. Ch. engchi. literacy levels. Governmental and private institutions are not yet conscious of the importance of this subject in people’s lives; hence no plans have been created to increase its awareness. Moreover, there are not even financial advisers to take on the tasks of helping Nicaraguans make good financial decisions in their lives. This is why I have foreseen the need of a financial advising service in my country. I plan to create awareness on the importance of personal finances in people lives, as well as how 1. Australian Securities and Investments Commission March 2011, “Financial Literacy and behavioral. change”, 2011, http://www.asic.gov.au/asic/pdflib.nsf/LookupByFileName/rep230-financial-literacy-andbehavioural-change.pdf/$file/rep230-financial-literacy-and-behavioural-change.pdf 2. A.S. Norman, “Importance of financial education in making informed decision on spending”, October,. 2010, http://www.academicjournals.org/jeif/pdf/pdf2010/Oct/Norman.pdf. 1.
(8) increasing financial literacy levels in Nicaragua will help my country move one step forward. This is why I write this thesis. In today’s societies there are more opportunities to spend than we care to recognize, so it is ever more important to teach people –especially the young ones- how to be socially responsible and to acquire financial competency. Everyone wants and needs to spend, but people don't always realize the consequences of their spending choices. By increasing financial literacy, they can develop the ability to make critical financial decisions: knowing how to manage money, to use credit effectively, save, invest, spend and make good financial choices, all requires sound financial understanding.. 治 政 大 that just comes naturally to all Unfortunately, knowledge in managing money isn’t something 立 of us. It is something that we need to learn, and even though on many aspects of our lives, our ‧ 國. 學. parents and schools are responsible for teaching us, personal finances is one of those things that many people don’t really understand, and if they themselves are not financial experts,. ‧. they can’t teach it either.. y. Nat. Schools can definitely play a major, constructive role in teaching the appropriate financial. sit. skills 3 . If children's financial education starts early, their money management skills will. er. io. improve over time, so that they can enjoy a higher standard of living in the long term.. al. n. v i n C his so often associated break the cycle of poverty, which e n g c h i U with those who have no access to Financial literacy leads to positive financial behavior and ultimately to empowerment. It can. financial services - the so-called unbanked.. Some have argued that financial literacy is relevant only if one has wealth, which would mean that in a poor country like Nicaragua, financial literacy is not needed. However, this is a very narrow view because individuals must make decisions not only about assets but also about debt. And debt is present, even pervasive, across all income strata.. 3. Toespraak van Prinses Mathilde, “Toespraak van Prinses Mathilde – ‘First Child & Youth Finance. Regional Meeting for Europe and Central Asia’”, June, 6, 2012, http://guides.library.dal.ca/content.php?pid=860&sid=11818#newxiee. 2.
(9) 2. Nicaragua 2.1.. General. Nicaragua is a country strategically located in the heart of the Americas: at the center of the Central American isthmus that forms a land bridge between North and South America 4, with a size of 130,600 sq. km –slightly smaller than New York state- it is ranked #98 worldwide, and it is the largest country in Central America. It is bordered on its eastern and western shores by the Atlantic and Pacific oceans, respectively; to the north lies Honduras, and to the south Costa Rica.. 治 政 大safest and fastest-growing countries Over the past 16 years, Nicaragua has become one of the in Latin America. It is a 立 stable, multi-party democracy, and it has ratified Free Trade ‧ 國. 學. Agreements with major markets such as the United States, the Dominican Republic (DRCAFTA), Taiwan and Mexico, among others5. After 40 years of dictatorship and another 9. ‧. years of embargo by the U.S.A., the country has had free democratic elections since 1989 and has made significant progress towards strengthening its democratic institutions.. y. Nat. sit. As evidence of continuous efforts in improving the business climate, Nicaragua has been. er. io. ranked favorably in a variety of independent evaluations. The 2013 Doing Business Report,. al. n. v i n Cranked investment climate in 183 nations, h e nNicaragua h i asUthe top location in Central America in c g starting a business, investor protection, closing a business, and resolving insolvency. published by The World Bank Group, a report that benchmarks various indicators of the. Additionally, the country improved in the following categories: registering property, paying taxes, and trading across borders6.. 4Nearshore,. Executive Alliance, “Latin America Site Intelligence Report: Nicaragua Report”,. http://www.nearshoreexecutives.com/wp-content/uploads/2012/11/LASIR.Nicaragua.FINAL_.110612.pdf 5. Nearshore, Executive Alliance, “Latin America Site Intelligence Report: Nicaragua Report”,. http://www.nearshoreexecutives.com/wp-content/uploads/2012/11/LASIR.Nicaragua.FINAL_.110612.pdf 6. The World Bank, “Doing Business 2013: Smarter Regulations for Small and Medium-Size Enterprises”,. October 23, 2012, http://www.doingbusiness.org/reports/global-reports/Doing%20Business%202013. 3.
(10) 2.2.. Population. Nicaragua has a population of 5,891,199, which mainly comprise 69% mestizo, 17% white 5% Amerindian -the unmixed descendants of the country's indigenous inhabitant-, and 9.0% black and other races. 58.32% of the population is urban and 41.68% rural7. Relative to its overall population, Nicaragua has never experienced any large-scale immigrant waves. The total number of immigrants to Nicaragua, both originating from other Latin American countries and all other countries, never surpassed 1% of its total population. The life expectancy was 72.7 years in 2011, a figure roughly equivalent to that of Vietnam. 政 治 大. and Palau8. The infant mortality rate stood at 18.3, roughly equivalent to that of the Marshall Islands and Paraguay9.. 立. ‧ 國. 學. 2.2.1. Age distribution. Regarding the Age Distribution, 33% of the population is between 0 and 14 years old; 62% is. ‧. 15-64 years old; and the remaining 5% corresponds to adults 65 and older. With these statistics, the population’s median age is around 23 years. There is a good distribution gender. y. Nat. io. sit. wise, given 49.44% of Nicaraguans are male, and 50.56% are women10.. er. 2.2.2. Demographic Bonus. al. n. v i n C h time for its futureUeconomic development. Specifically, Nicaragua is going through a crucial engchi. we are facing a window of opportunity, known as the demographic bonus; this means the beginning of the third stage of the demographic transition, where the population growth rate begins to decline and the working age population increases relative to the dependent population, especially the children.. 7. Ethnic groups and Demographic profile, CIA, World factbook. 8. Birth rate, CIA, World factbook. 9. Death rate, CIA, World factbook. 10. CELADE - Population Division of ECLAC. 2011 Revision, Nicaragua: “Long term population estimates. and projections 1950-2100”. 4.
(11) To take advantage of this bonus, employment opportunities are needed for the growing population of working age, as well as formal education and working experience to make these young people attractive and productive in the labor market. Research has shown that unemployment and inactivity among young people can have a deep and lasting negative effect on the future employability of young people and therefore, in the future income stream of the homes and their quality of life. 11 Education is one of the key elements that explain the probability of working, but it is also a variable related to the revenue stream that individuals expect to receive in the course of their. 治 政 大for their families. The more years should continue studying or start working to earn money 立 spent in school make it less likely for them to withdraw; but for someone who is already working lives. Coming from a poor home, young people are faced with the dilemma if they. ‧ 國. 學. working, the older they get, the less likely it will be for them to go back to school.12. 2.2.3. Education. ‧. Education is paid via taxes for all Nicaraguans. Elementary education is free and compulsory,. y. Nat. sit. but many children in rural areas are unable to attend due to lack of schools and other reasons.. er. io. Communities on the Caribbean coast have access to education in their native languages13.. al. n. v i n Ch statistics showing only 3.6% of the population e n g cabove h i 15Uyears old does not know how to write As of 2010 the government of Nicaragua has declared the country “free of illiterates”, with and read14.. Recent studies show that from the population over 10 years old 20% don’t have any kind of education; 44% have gone through Primary school –although not necessarily finished it-; 27%. 11. International Monetary Fund (IMF), IMF Country Report No. 12/256: Nicaragua.. 12. International Monetary Fund (IMF), IMF Country Report No. 12/256: Nicaragua.. 13“Nicaragua, 14. Latin America”, Awana International, http://awanainternational.org/resources/Nicaragua.pdf. Jeniffer Castillo Bermúdez, “Hay que revisar la cifra de analfabetas” La Prensa, September 29,2012,. http://www.laprensa.com.ni/2012/09/29/ambito/118118-hay-que-revisar-cifra. 5.
(12) have some High school education and only 10% actually completed; 2% of the population have technical education; and only 7% of Nicaraguans have attended University15.. 2.3.. Economy. Nicaragua, primarily an agricultural country, faces low per capita income, massive unemployment, and huge external debt. Distribution of income is one of the most unequal on the globe. While the country has made progress toward macroeconomic stability over the past few years, GDP annual growth of around 4% has been far too low to meet the country's needs16.. 政 治 大. Real GDP grew 5.2% in 2012 and it is estimated to grow 4.3% in 2013, and 3.7% in 201417.. 立. Inflation rate is very high in Nicaragua, oscillating between 8% and 9%; last year’s inflation. ‧ 國. 學. (i.e. 2012) was 6.6%, and it is calculated that in 2013 it will reach 7.30%, reflecting first and second-round effects of higher world oil prices, electricity tariffs, and minimum wages.18. ‧. The country’s exports for 2012 reached 4,581.2 million U.S. dollars, an increase of 14% from the previous year19.. sit. y. Nat. One of the key engines of economic growth has been production for export. Although. io. n. al. er. traditional products such as coffee, meat, and sugar continued to lead the list of Nicaraguan. i n U. v. exports, the fastest growth is now in nontraditional exports: textile and apparel, gold, seafood,. Ch. engchi. and new agricultural products such as peanuts, sesame, melons, and onions. Nicaragua's minimum wage is set for nine different economic sectors, ranging from $95 U.S. dollars a month in the agricultural sector to $215 U.S. dollars in the financial sector20. 15. CELADE - Population Division of ECLAC. 2011 Revision, Nicaragua: “Long term population estimates. and projections 1950-2100” 16. IndexMundi Real GDP Growth Rate Chart, http://www.indexmundi.com/g/g.aspx?c=nu&v=66. 17. “Informe Anual 2012”, Banco Central de Nicaragua, Febrero, 2013,. http://www.bcn.gob.ni/publicaciones/anual/memoria/2012/Cap3-Producto_interno_bruto.pdf 18. International Monetary Fund (IMF), IMF Country Report No. 12/256: Nicaragua.. 19. “Informe Anual 2012”, Banco Central de Nicaragua, Febrero, 2013,. http://www.bcn.gob.ni/publicaciones/anual/memoria/2012/Informe_anual_2012.pdf. 6.
(13) Only about 25% of the Nicaraguan labor force is part of the social security system and the economy is populated by many small, low-productivity firms. Those firms have little incentives (or means) to either grow or leave the informal sector, hence hindering economic growth.21 Informal labor arrangements also are more prevalent among women and younger workers. While these patterns are present in other Latin American countries, in Nicaragua informal employment accounts for more than 70% of urban employment—much higher than the 54% average in the Latin American region.22. 治 政 adjustments to the exchange rate with respect to the U.S.大 dollar. Thus, over the last decade the 立 Central Bank of Nicaragua established a "crawling-peg" exchange-rate system whereby small As in other Latin American countries, there is a relationship between inflation and. ‧ 國. 學. adjustments are planned in the national currency exchange rate against the U.S. dollar. For 2013, the "crawl" with respect to the U.S. dollar continues established at 5%. This assures a. io. sit. y. Nat. 2.3.1. Poverty. al. er. competitiveness.. ‧. high level of currency stability, while at the same time maintaining the country’s export. n. Despite a steady growth performance in the last decade and increased spending in social and. Ch. i n U. v. poverty-reducing policies, Nicaragua remains one of the poorest countries in the Western Hemisphere.. engchi. With a GDP in 2012 of $10,507.7 million U.S. dollars, Nicaragua is considered to have a lower middle income23. Years of political conflict, natural disasters and a civil war, together with unfavorable economic conditions have left Nicaragua the poorest country in Central. 20. Wendy Álvarez Hidalgo, “Nuevo Ajuste Salarial”, La Prensa, August 24,2012. http://www.laprensa.com.ni/2012/08/24/activos/113548-nuevo-ajuste-salarial 21. International Monetary Fund (IMF), IMF Country Report No. 12/256: Nicaragua.. 22. International Monetary Fund (IMF), IMF Country Report No. 12/256: Nicaragua.. 23. “Informe Anual 2012”, Banco Central de Nicaragua, Febrero, 2013,. http://www.bcn.gob.ni/publicaciones/anual/memoria/2012/Informe_anual_2012.pdf. 7.
(14) America and the second poorest nation in Latin America after Haiti. 24Around 32% of the population lives with less than $2.00 U.S. dollars a day, and 48% of the population in Nicaragua lives below the poverty line (with less than $1 dollar a day). 25Given the cost of the “typical family basket”, which is formed by 53 products, is $452 U.S. dollars, it means many Nicaraguans are not able to buy it26. It is a country with huge disparities, where the wealthiest 10% of the population accrues for 31.5% of the total income, and the income share held by the lowest 10% is only 2.5%. This means that, although the GDP per capita is $1,582.2 U.S. dollars, it cannot be assumed that this number constitutes an actual average27.. 治 政 大 3.9% of the population is According to the United Nations Development Program, 立 unemployed –though other programs think this number is underestimated-, and 46.5% are ‧ 國. 學. underemployed. Despite the fact that a big proportion of this economically poor Nicaraguans are women, 39% of the urban homes, and 28% of the rural home have a woman as head of. Nicaragua and Personal Finance. sit. y. Nat. 2.4.. ‧. household28.. al. er. io. What the information and statistics mentioned above means, is that Nicaragua is very far from. n. being a country characterized by a financial culture. Even though personal finance is quite a. Ch. i n U. v. new subject all around the world and there is a global movement to accomplish higher. engchi. financial literacy rates, Nicaragua is far behind.. 24. The world bank, Nicaragua,. http://web.worldbank.org/WBSITE/EXTERNAL/COUNTRIES/LACEXT/NICARAGUAEXTN/0,,print:Y ~isCURL:Y~contentMDK:22255024~pagePK:1497618~piPK:217854~theSitePK:258689,00.html 25. The World Bank, http://data.worldbank.org/country/nicaragua. 26. “Precios de la Canasta Básica”Instituto Nacional de Información de Desarrollo (NIDE), January, 2013,. http://www.inide.gob.ni/CanastaB/CanastaB.htm 27. The World Bank, http://data.worldbank.org/country/nicaragua. 28. “Pro Mujer in Nicaragua Hosts Inaugural Velasco & Patterson Society ‘Encuentro’”. ProMujer,. http://promujer.org/wp-content/uploads/2012/11/press_releases_articles_110_Pdf_Pro-Mujer-in-NicaraguaHosts-Inaugural-Velasco.pdf. 8.
(15) With the majority of the population having such low educational level and living standards, the problems Nicaraguans face in personal finance issues are not related to high debt levels due to misconceived mortgage, or losing a large part of their savings on the stock market, or deciding the best account to save for their retirement –like many developed countries-. Instead, the problems met by these people have to do with much simpler things, like: the lack of saving accounts for retirement or any other goal considering the low income they have, high debt due to purchasing consumable goods on high interest rates credits, the inability to pay for college education, misuse of credit cards, among others.. 立. 政 治 大. ‧. ‧ 國. 學. n. er. io. sit. y. Nat. al. Ch. engchi. 9. i n U. v.
(16) 3. Design of Questionnaire Because of the nonexistence of financial literacy data in the country, I decided to do a survey as a means to accomplishing two goals: . Determine the current situation of financial literacy in Nicaragua.. . Evaluate the market’s needs regarding personal finance.. . Assess the potential market for a personal finance advisor in Nicaragua.. Because personal finance is essential to every person’s life, there was not a particular segment. 治 政 answer the survey, because the more people that answered, 大the better notion I could get on the population’s knowledge and立 needs. of the population that I was targeting, the objective was to get as many people as possible to. ‧ 國. 學. However, given I already have a personal finance Blog –called “Plata con Plática”-, with a Facebook page and twitter account, I determined that those who read the blog, and followed. ‧. me through those accounts were a good starting point because they are people already aware. y. Nat. of the importance of personal finance, and whom are interested on improving their financial. n. al. er. io. answers from people with a possible lower financial literacy.. sit. literacy levels. I also asked them to re-send the survey to others they knew, in order to get. Ch. i n U. v. Given I am in Taiwan and my target population is in Nicaragua, the survey was done online,. engchi. through a period of one week, and it consisted of 25 questions, divided in 4 parts. The first part comprised five questions which were related to demographic data (age, gender, marital status, number of children and employment status) because it is important to know the type of person who is answering, so that later on it can be determined if and which type of factors affect people’s financial needs. The next set of questions was related to people’s appreciation of their own knowledge and performance on different personal finance topics, such as: budgeting, savings, debt, investments, insurance, retirement plans and entrepreneurship. These questions had a grading scale from 1 to 10, where 1 was the poorest number and 10 meant an excellent financial knowledge/behavior.. 10.
(17) The third part of the questionnaire was designed with specific questions that would asses people’s real knowledge and performance on the previous subjects, because I considered important to judge by myself their financial behavior, as one may think that knows and makes good decisions about a certain subject, but it may be that those decisions are far from being the best. Finally, the last set of 6 questions were intended to find out the population’s feelings towards looking for financial help and hiring a financial advisor, in order to examine the market potential and business plan feasibility.. 3.1.. 政 治 大. Survey. 立. ‧ 國. 學. Please help me fill out the following survey about personal finances. All the information will be confidential, and used for academic purpose only.. ‧ y. Nat. sit. Personal finance refers to the financial decisions an individual is recommended to make to. al. er. io. obtain, budget, save, and spend monetary resources over time, taking into account various. n. financial risks and future life events.. Ch. engchi. i n U. v. Part 1: Demographic Data 1. Age <20. 21-25. 26-35. 36-45. 46-55. 56-65. >65. 2. Gender Male. Female. 3. Marital Status Single. Married. Civil Partnership. Divorced. 11. Widower.
(18) 4. Number of children No children. 1-2. 3-5. 5 and above. 5. Employment status Employed Own Business Freelance House wife Student Retired. 立. Unemployed. 政 治 大. ‧ 國. 學. Part 2: Self-assessment. ‧. 6. How important is it for you, to learn how to manage your personal finances? (Rank from. io. sit. y. Nat. 1 to 10). n. al. er. 7. How would you rate yourself in the management of your personal finances Excellent (I have no problems at all) Very good. Ch. engchi. i n U. v. Good Regular Bad Very bad (I really don’t know what I’m doing). 8. Amongst the following personal finances subjects, how would you rate your knowledge/performance? (Rank each one from 1 to 10) Savings Investment Retirement Plans. 12.
(19) Budgeting (management of income and expenses) Debt (credit cards, student loans, mortgage, etc.) Entrepreneurship Insurance. Part 3: Financial Performance 9. Do you currently save a proportion of your income? No. a.. 政 治 大 If you are not saving, what is the main reason? 立 I don’t make enough money to save.. 學. ‧ 國. I’m waiting for a salary increase I forget to save. ‧. I have debt to pay Something always comes up. sit. y. Nat. io. b. If you are currently saving, what proportion of your income do you save?. al. er. Yes. n. Less than 4% 5% 10%. Ch. engchi. i n U. v. More than 10% It depends. c. What is the main reason you save for? For when I retire (retirement) To start a business In case something happens (Emergency fund) To buy a house To pay for studies (my own or my kids) Other _______________________________________. 13.
(20) 10. Do you currently own any investment? Yes. No. a. If you are not investing, what is the main reason? I have no money (savings) to invest I don’t know where to invest I’m afraid of investing and losing my money. 政 治 大. I’m waiting to have more money to start investing. 立. b. If you are investing, what are you investing on?. ‧ 國. 學. A business The stock Market. ‧. Real Estate Deposit Securities. y. Nat. al. n. c. How long have you been investing for? Less than 1 year. Ch. Between 1 and 5 years. engchi. Between 6 and 10 years Over 10 years. 11. Are you currently paying any kind of debt? Yes. No, I don’t have any debts. a. What type of debt are you paying? Credit Card Mortgage Car loan. 14. er. io. sit. Other ___________________________. i n U. v.
(21) Student loan Personal loan Store loan I owe a friend or family member. b. Is your debt under control? Yes, I knew exactly what I was asking for and how much and long I would pay I am able to pay every month, but it takes a big proportion of my income I don’t understand why I’m still paying. 政 治 大. I have no money to pay. 立. Part 4: Financial help. ‧ 國. 學. 12. Have you ever looked for help to improve your personal finances?. ‧. I’ve read books about personal finances I’ve taken courses on how to manage my money. y. Nat. er. io. al. sit. I’ve downloaded software to help me manage my money. n. 13. If you had the chance to learn about personal finances, would you take i? Yes. Maybe. No. Ch. I don’t know. engchi. i n U. v. 14. How would you like to learn about personal finances? Take a regular course (workshop) Take an online course Read a book Buy software Go to a private consult to discuss my problems and design an action plan specifically for me. 15. A financial advisor is an independent professional who designs a plan tailor made, in order to guide you in the management of your money and resources: savings, investments, debts, and the accomplishment of short and long term goals. All the information provided by the. 15.
(22) customer is strictly confidential, and the financial advisor does not belong to any banking or commercial institution. If the financial advisor service existed in Nicaragua, would you search for their help? Definitely yes Most likely Might / Might not Probably Not Definitely Not. 政 治 大. 16. What is the main reason why you wouldn’t visit a financial advisor? I don’t need one. 立. 學. ‧ 國. I don’t trust them. There is no one to offer that service I don’t think it would be helpful. ‧. I don’t have money to pay for that. y. Nat. $30 $35. er. al. n. $25. io. $20. sit. 17. How much would you be willing to pay for an hour of financial advisor service?. Ch. engchi. $40 $50. 16. i n U. v.
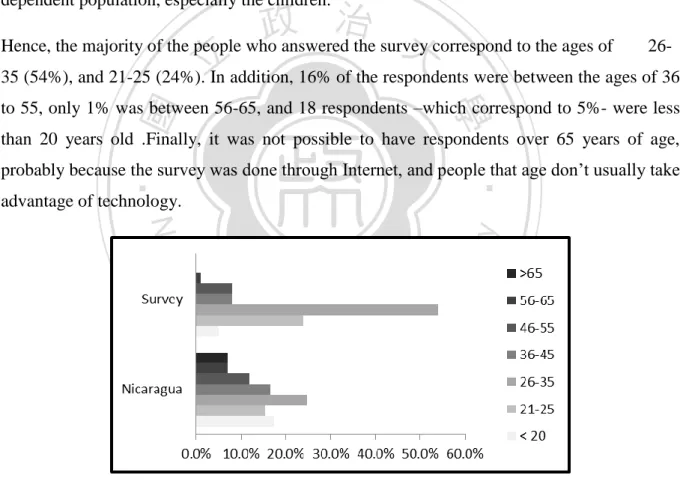
(23) 4. Results and Analysis 4.1.. Part 1: Demographic Data. With a total of 650 Facebook fans and 530 blog followers at the time of the survey, 343 people answered the questionnaire in a one week period. The age distribution of the respondents shows direct relation with the country’s age distribution. As it was mentioned before, Nicaragua is going through a “Demographic Bonus” period, in which the population growth rate begins to decline and the working age population increases relative to the dependent population, especially the children.. 治 政 大correspond to the ages of 26Hence, the majority of the people who answered the survey 35 (54%), and 21-25 (24%).立 In addition, 16% of the respondents were between the ages of 36 ‧ 國. 學. to 55, only 1% was between 56-65, and 18 respondents –which correspond to 5%- were less than 20 years old .Finally, it was not possible to have respondents over 65 years of age,. ‧. probably because the survey was done through Internet, and people that age don’t usually take advantage of technology.. n. er. io. sit. y. Nat. al. Ch. engchi. i n U. v. Figure 1: Age Distribution As for the gender distribution, the idea was to have 50% of women and 50% of men to answer the survey. However, as several studies in the United States and Europe have shown, women tend to be more worried about their personal finances than men, so they were probably more willing to answer it. Hence, 60% of respondents are women (a total of 207) and the remaining 40% (or 136) are men.. 17.
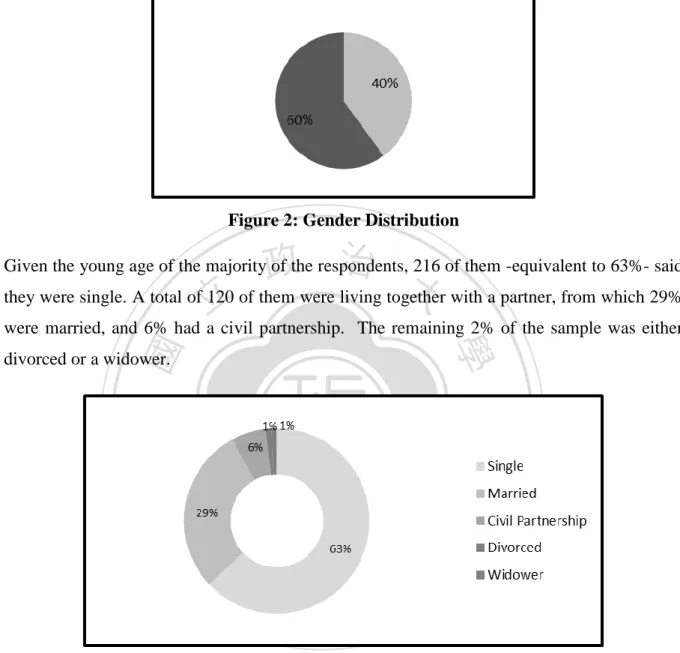
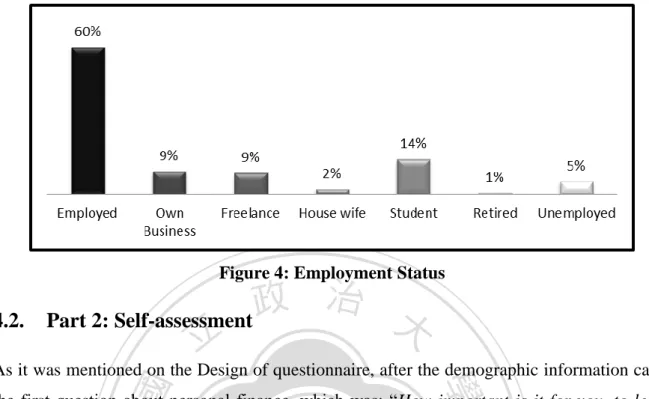
(24) Figure 2: Gender Distribution. 政 治 大 they were single. A total of 120 of them were living together with a partner, from which 29% 立. Given the young age of the majority of the respondents, 216 of them -equivalent to 63%- said. were married, and 6% had a civil partnership. The remaining 2% of the sample was either. ‧ 國. 學. divorced or a widower.. ‧. n. er. io. sit. y. Nat. al. Ch. engchi. i n U. v. Figure 3: Marital Status In direct relation with age and marital status, 68% of the respondents (233 people) didn’t have any children. The second largest group, with 27%, only had between 1 and 2 kids. Finally, 6% (19 respondents) had 3 to 5 children. When asked about their employment status, 205 –equivalent to 60%- were employed; 18% either owned their own business or worked as freelancers, and 14% (49 respondents) were still students. The residual respondents were: housewives (2%), retired (1%), or unemployed (5%).. 18.
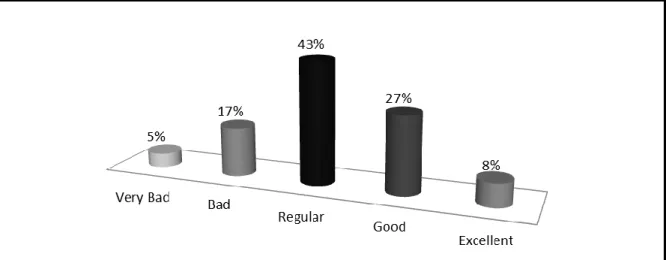
(25) Figure 4: Employment Status. 4.2.. 治 政 Part 2: Self-assessment 大 立 ‧ 國. 學. As it was mentioned on the Design of questionnaire, after the demographic information came the first question about personal finance, which was: “How important is it for you, to learn how to manage your personal finances?”, which the majority (78%) answered as very. ‧. important, giving the maximum qualification of 10, and 10% answered really important,. y. Nat. pointing out the second best qualification, which was 9. About 2% of respondents gave. io. sit. answers between 1 and 5, indicating that they gave little importance to their financial life, and. er. the remaining 10% placed personal finances between 7 and 8 in importance. This means that. al. n. v i n and 10) and it could be a sign of C a potential market for personal finance coaching. heng chi U. 78% of them consider that having a healthy financial life is a top priority (ratings between 9. Next, I asked them: “How would you rate yourself in the management of your personal finances” and they had to choose from a scale of 1 to 5 -1 being very bad and 5 being excellent. A majority of 43% (146 people) said that they managed their personal finances regular, 27% rated themselves with 4 (or good), 17% with a 2 (or bad), only 8% qualified themselves as excellent managers of their personal finances, and there was a small amount of 5% who said that their personal finances skills were very bad.. 19.
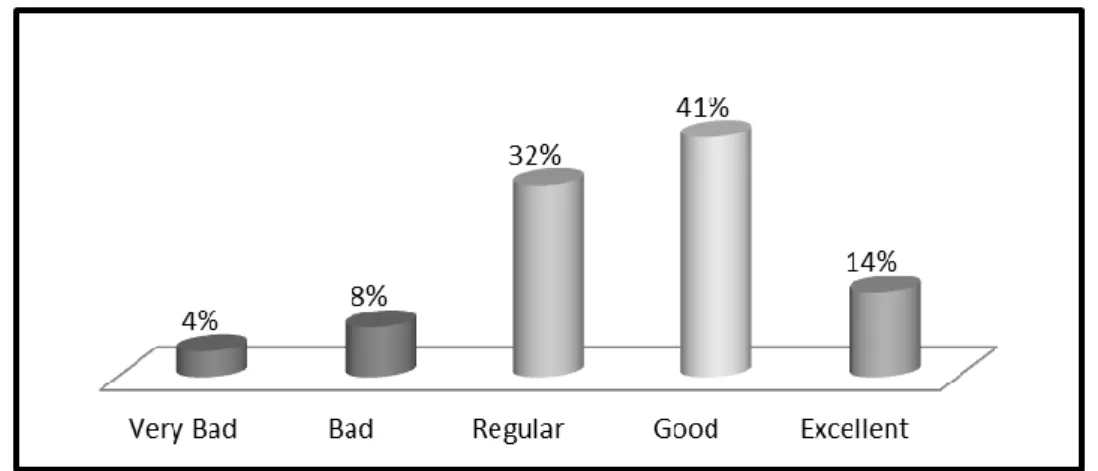
(26) 政 治 大 More specific questions were 立made in the personal finances management skills, so they were Figure 5: Self-assessment in the management of personal finance. ‧ 國. 學. asked: “Amongst the following personal finances subjects, how would you rate your knowledge/performance? Rank each from 1 to 10”.. ‧. The first subject to rate was budgeting, and keeping in mind that the last question showed most of the people rated themselves with a 3, when asked about their knowledge and. Nat. sit. y. performance in budgeting, a majority of 41% (or 139 people) positioned themselves in a 4. io. er. (good) and 32% of them in a 3 (regular). Moreover, 8% chose 2, 14% -equivalent to 49 people- graded themselves as excellent, and a small percentage of 4% considered themselves. n. al. Ch. i n U. v. as very bad at budgeting. The main reason why I wanted to ask them about their budgeting. engchi. skills is because having a healthy financial live involves a lot of planning, and a budget is the best way to maintain expenses below income. With the results showing that they think they are better at budgeting than in their general financial knowledge/performance, I started to predict that some inconsistencies would be found, mainly because people tend to overestimate their abilities and understanding.. 20.
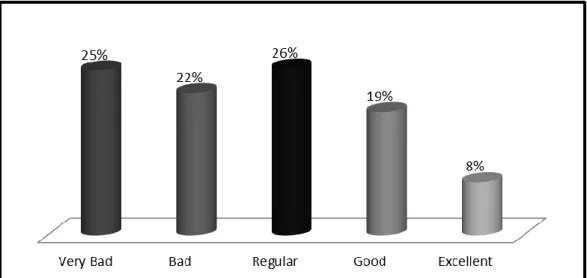
(27) Figure 6: Self-assessment in the knowledge and performance of budgeting. 政 治 大 savings. In this category, the point distribution is similar to the point distribution from the 立. The next subject of personal finances respondents were asked to grade themselves at, was. answers given in general rating question: the answer with the biggest percentage was regular. ‧ 國. 學. –or, a number of 3-, with 29% of respondents; 24% in number 4 –good-, 21% qualified themselves as bad in savings, a high 17% said they were very bad, and a small percentage of. ‧. 10% (33 people) rated themselves as excellent. This spreading show most of the people would. y. Nat. not go for the limits (1 or 5) in grading their savings performance, it means they consider. n. er. io. al. sit. themselves mostly as average savers.. Ch. engchi. i n U. v. Figure 7: Self-assessment in the knowledge and performance of saving Regarding Insurance, the graph shows a majority of respondents considering themselves between very bad (25%), bad (22%), and regular (26%). Only 27% answered they were either good (19%) or excellent (8%, the smallest amount). I think this is due to the fact that in. 21.
(28) Nicaragua, people don’t have the culture or knowledge to invest in insurance, as it is seen as an unnecessary expense. The only insurance bought by most people is car insurance, and mainly because it is compulsory. There is also a small part of the population that own a life or medical insurance, but whom didn’t acquire it on their own, it was instead provided by their employers.. 立. 政 治 大. ‧. ‧ 國. 學. Figure 8: Self-assessment in the knowledge and performance of insurance. y. Nat. sit. Their knowledge and performance in retirement plans was the next question, and it was the. er. io. one where respondents acknowledged being the most deficient. A score of 1 or very bad, was. al. n. v i n qualified themselves as regular, C andhan even smalleri amount e n g c h U said they were either good (9%) or excellent (6). This might be considered an opportunity for someone trying to start a. chosen by 38% of them, and a score of 2, or bad, was chosen by the next 31%. A small 16%. financial planning coaching business; however, further studies must be made, to find out the true reasons behind this. If the reasons are related to the lack of a good financial plan, it definitely might be a niche, but if it turns out that it has to do more with culture, and the fact that young people are expected to support their elders when in need, then it might be hard to change that.. 22.
(29) 政 治 大. Figure 9: Self-assessment in the knowledge and performance of retirement plans. 立. Given Nicaragua is a country where 70% of businesses are informal, it makes sense that,. ‧ 國. 學. when asked about their entrepreneurial skills, 31% (106 people) of respondents answered regular, and 20% answered good. This means that about half the population considers. ‧. themselves to be savvy in this subject. However, there is still 18% who rated themselves as very bad, and 23% as bad. Only 7% answered with excellent to this question. Despite the high. sit. y. Nat. amount of entrepreneurs, and smalls and informal businesses, this does not mean that they. io. er. know or have the skills for a good management. As it was introduced on the first chapter, most of the workers are not part of the Social Security System, and the main reason is because. n. al. i n U. v. these entrepreneurs don’t want to pay for that, and don’t consider it an important cost. Hence,. Ch. engchi. regardless of their self-assessment, I believe entrepreneurs and SME’s are a potential market for financial advisory in my country.. 23.
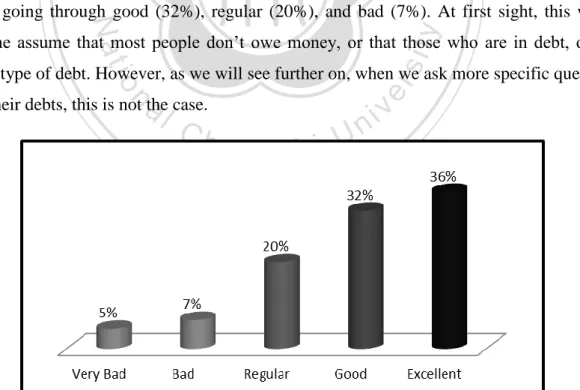
(30) 治 政 Figure 10: Self-assessment in the knowledge and performance of entrepreneurship 大 立. The next question in the survey was to rate their performance on debt. For me, this was one. ‧ 國. 學. of the most interesting graphs, as it has an opposite tendency to the one shown in retirement planning: high leaning for the excellent grade (with 36% of respondents) and a decreasing. ‧. amount towards the lowest grade –very bad- which was the answer chosen by only 5% of the. y. Nat. people, going through good (32%), regular (20%), and bad (7%). At first sight, this would. sit. make me assume that most people don’t owe money, or that those who are in debt, own a. n. al. er. io. healthy type of debt. However, as we will see further on, when we ask more specific questions about their debts, this is not the case.. Ch. engchi. i n U. v. Figure 11: Self-assessment in the knowledge and performance of debt. 24.
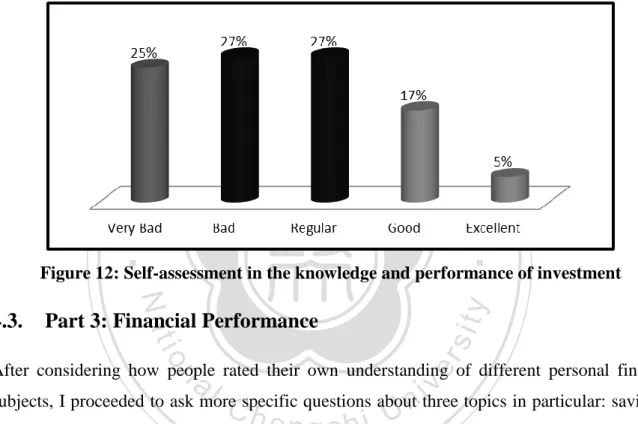
(31) The final aspect respondents had to rate was their performance and knowledge in investments. Similar to the answers for insurance, there is a clear inclination towards the very bad (25%), bad (27%), and regular (27%) levels. People who considered themselves either good or excellent were minimum, amounting for only 74 of the respondents, or 22%. These numbers tell me that either people are not investing, or they have invested but their returns were not as expected. For this reason, further questions will be asked in this topic.. 立. 政 治 大. ‧. ‧ 國. 學. Figure 12: Self-assessment in the knowledge and performance of investment. y. Nat. io. al. sit. Part 3: Financial Performance. er. 4.3.. n. After considering how people rated their own understanding of different personal finance. Ch. i n U. v. subjects, I proceeded to ask more specific questions about three topics in particular: savings,. engchi. debt and investment. The reason behind this is to assess if the grade they chose has a relation with their actual actions and performance. Regarding savings, the first thing I wanted to know is if they were actually saving a proportion of their income; and it turns out that 176 of them (51%) are in fact saving, and the remaining 167 (49%) are not.. 25.
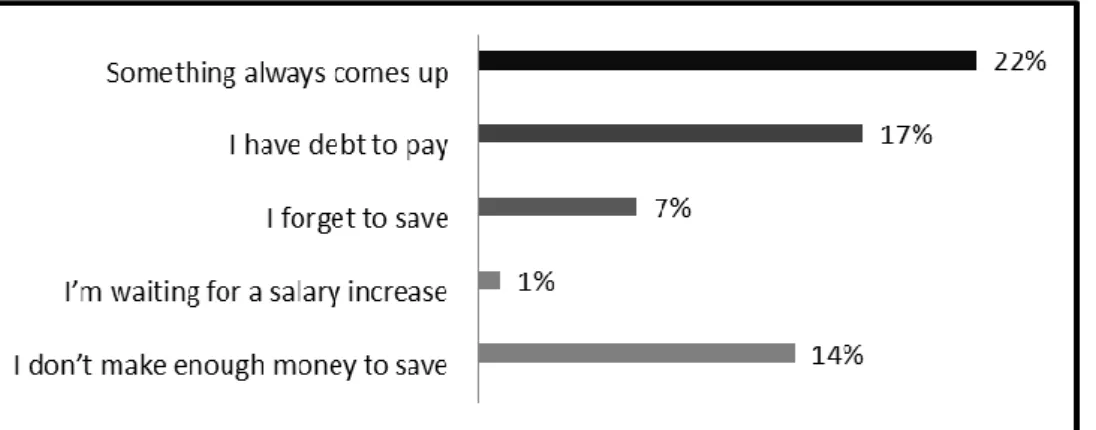
(32) 治 政 Figure 13: Percentage of respondents 大 who save 立. Next, to those who are not saving money, I asked them “If you are not saving, what is the. ‧ 國. 學. main reason?”, to which 22% answer that something always comes up, 17% said it was because they had debt to pay, 14% felt they didn’t make enough money to save, 7% said they. ‧. forgot to save, and a minority of 1% mentioned they were waiting for a salary increase to start. y. Nat. saving. With these answers, I come to the conclusion that although there is a percentage of the. sit. population who truly can’t save, either because they don’t earn enough, or they have debt to. er. io. pay, there is also a big proportion of them who don’t save because a lack of financial planning.. al. v i n always comes up” and “I forget C to h save”, I can conclude e n g c h i U it is within their possibilities to put n. With almost 30% of respondents who don’t save, providing reasons such as: “something money aside, but that they don’t have a plan (probably not a budget) to follow, so they end up spending that money.. Figure 14: Reasons why respondents don’t save. 26.
(33) On the other hand, to those who answered they were saving, two further questions were asked: the first one was: “If you are currently saving, what proportion of your income do you save?”, and a surprising majority of 21% answered that it varied from month to month, 17% were saving over 10%, 13% were saving about 10%, 5% were saving 5%, and the remaining 10% of the saving respondents, were saving less than 4% of their income. The fact that such a big proportion of respondents are not able to save a fix amount each month, confirms the lack of financial planning, from which non-savers are also victims.. 立. 政 治 大. sit. y. ‧. ‧ 國. 學. io. er. Nat. Figure 15: Proportion of income saved. al. The second question asked to savers, was “What is the main reason you save for?” This was. n. v i n a multiple choice question, because C hmost people save Ufor more than one objective at a time. e n gto chave h i an emergency fund, to be ready in case 172 of respondents (65% of savers) saved. something happened. The second most chosen reason was to start a business (33%) –most of which were 26 to 35 years old- and next to this, other reasons (32%) were chosen. Among these other reasons, respondents indicated they saved in order to buy a car, to travel and/or vacations, and to buy other things (they also mentioned personal reasons, and to give themselves some luxuries). Furthermore, 23% of savers were doing it to buy a house, which is consistent with the age of the respondents, as they are in the stage of their lives when they start getting married and looking for independence; and 20% were saving to pay for studies, most of them would save for their own studies (again related to age distribution), and a minority were saving for their kids’ education.. 27.
(34) 政 治 大 Considering 38% of the total respondents rated themselves as very bad or bad in this matter, 立 and 49% are not even saving, it can be inferred that people think they manage their personal Figure 16: Main reason for saving. ‧ 國. 學. finance –at least the savings subject- better than they actually do. It is also important to notice that a lack of financial planning can be witnessed both in those who save, as most of them. ‧. save a variable amount, and in those who don’t save because of the reasons provided. Also, given only 17% have retirement as a saving goal, it can be related to the 69% of respondents. y. Nat. io. sit. who graded themselves as very bad or bad in this subject.. n. al. er. After savings, the second set of specific questions was related to investment. When asked if. i n U. v. they currently owned some kind of investment, only 23% answered affirmatively and the. Ch. engchi. astonishing amount of 264 respondents was not investing at all.. Figure 17: Percentage of respondents who currently own an investment. 28.
(35) Focusing on this majority of respondents who are not investing at all, they were asked the main reason why they weren’t investing; to this, 30% said they were not investing because they didn’t have enough money to do so, and 21% were waiting to have more money to start investing. Looking back to savings, half of the population does in fact save, however, they do so more as a precaution (in case something happens), and don’t consider being proactive (I want to have more money). Among the other reasons for not investing, are: not knowing where to invest (21%) and being afraid of investing and losing money (8%). From these risk adverse people, 93% of them are between the ages of 21 and 35; however they don’t constitute a big proportion of the entire sample: only 7.5%.. 立. 政 治 大. ‧. ‧ 國. 學. n. er. io. sit. y. Nat. al. Ch. engchi. i n U. v. Figure 18: Reasons for not investing Out of the small minority of 79 people who said they were investing, 48 (54%) of them were doing so on a business. From this, 77% were between 21 and 35, and most were single women with no children. Real estate was the second place (21%) where they chose to invest, 13% did so on deposit securities, and 11% on the stock market. It is important to mention that this was a multiple choice question, and it showed that, having the opportunity to invest in different options, only 11 people (roughly 14%) did it; the rest were investing in only one place at a time. This could be either because they don’t have the means to invest in many places, or because they don’t know of the importance of diversifying, which would show their poor knowledge on investment, and could be further related to the almost 80% of respondents. 29.
(36) who rated themselves between very bad, bad and regular on their Investments knowledge and performance.. 立. 政 治 大. Figure 19: Where respondents invest. ‧ 國. 學. The last question on the survey about Investment was: “How long have you been investing for?” Most of them had been investing their money for a short term, as 32% answered less. ‧. than 1 year –equivalent to 7% of the total sample-, and 46% said between 1 and 5 years –. y. Nat. equivalent to 10% of the total sample. This is logical given the fact that most of these short. io. sit. term investors (84%) were less than 36 years old, so it’s very hard at that age to have been. n. al. er. investing for a longer period. Finally, 10% of investors had been investing from 6 to 10 years,. i n U. v. and 13% for over 10 years -90% of which were older than 36.. Ch. engchi. Figure 20: Number of years investing. 30.
(37) The final specific personal finance subject respondents were asked about was debt. To the question “Are you currently paying any kind of debt?” a startling 66% said they were, and 34% said they weren’t. Furthermore, 50% of those with debt owe money because of credit cards, 27% owe money to family or friends, and 21% have a personal loan; all these types of debt are most likely used for consumer goods, which is not considered a “good type of debt”. Going back to the question where respondents rated themselves in the knowledge and performance of debt, 68% chose good or excellent to rate themselves. Given the amount and type of debt these people have, it is clear that, despite their personal assessment, their actual knowledge in this subject is very poor.. 政 治 大 car loan, and 8% had to pay 立back to a store. Because this was a multiple choice question, it. Continuing with the types of debt, 22% had a mortgage to pay, 21% owed money because of a. ‧. ‧ 國. 學. was shocking to see that 44% of those with debt had more than one type of debt to pay.. n. er. io. sit. y. Nat. al. Ch. engchi. i n U. v. Figure 21: Debts to pay and types The final question asked in the debt subject, was: “Is your debt under control?” To this, 63% of debtors answered that they knew exactly what they were getting into, 30% said that although they were paying, it was a big proportion of their income; 3% answered they didn’t really understand why they were still paying, and the remaining 4% said they had no money to pay. I admit that I expected more people to say that their debt was not under control because most of it is credit card debt; nevertheless, it was surprising to see that most of them acknowledge knowing what they were getting into, and still did it.. 31.
(38) 政 治 大 Part 4: Financial立 Help. Figure 22: Debt under control. 4.4.. ‧ 國. 學. As previously mentioned, the last part of the survey was more related to the respondents’ interest in looking for financial help.. ‧. In this sense, the first question asked was: “Have you ever looked for help to improve your. y. Nat. personal finances?” to which 62% answered no. Because this was a multiple choice questions. sit. –as one can look for help in different places at the same time-, those who had looked for help. er. io. before (38%) did so in a variety of places and ways (70%). Specifically, 24% of total. al. n. v i n software, and only 6% had takenCa h course. In addition, e n g c h i Ua vast 45% wrote other answers such as asking other people for advice (such as parents, family, friends and partners), watching TV,. respondents had read a personal finance book before, 7% had downloaded some kind of. and doing Internet reading –some even mentioned “Plata con Plática”-.. 32.
(39) 政 治 大 To the question “If you had the chance to learn about personal finances, would you take i?” 立 the majority of them said yes (78%), and 20% said maybe. There was also 1% who answered Figure 23: Looked for financial help before. ‧ 國. 學. no, and 1% who was not sure what they would do. Having so many people affirmatively answering this question is directly related to the fact that 78% had also said personal finance. ‧. was very important in their lives, rating it with a 10 out of 10. This also gives a positive. n. al. er. io. sit. y. Nat. outlook to the possibility of starting a personal finance coaching business in Nicaragua.. Ch. engchi. i n U. v. Figure 24: Possibility of learning about personal finance The following question was aimed at discovering the customers’ preferences regarding the best way for learning about personal finances; this was also a multiple choice question and it was phrased this way: “How would you like to learn about personal finances?” A majority of 44% answered they would like to learn through an online course, which was quite shocking,. 33.
(40) because it is not usual in Nicaragua for people to take these types of courses, we are still focused on the traditional –classroom- courses. After this, 38% answered they would take a regular course or workshop, and the same amount said they would go to a private consult to discuss their problems and design an action plan specifically for them. There were also some people who answered they would read a book (27%), and a minority of 6% would buy a software. Some of the other choices provided were: YouTube videos, Internet reading, doing a Master’s degree and some said they had no time for this. It is important to notice that from the 38% who said they would rather go to a private consult, 45% picked it as an only option, which provides further reasons to believe the business plan would be successful.. 立. 政 治 大. ‧. ‧ 國. 學. n. er. io. sit. y. Nat. al. Ch. engchi. i n U. v. Figure 25: How they would like to learn about personal finance The next question on the survey was: “A financial advisor is an independent professional who designs a plan tailor made, in order to guide you in the management of your money and resources: savings, investments, debts, and the accomplishment of short and long term goals. All the information provided by the customer is strictly confidential, and the financial advisor does not belong to any banking or commercial institution. If the financial advisor service existed in Nicaragua, would you search for their help?” To this, 111 (32%) said they definitely would –half of which were 25-36 years old-, and 34% responded they most likely would -67% of which were also 25-36 years old- . However, there was an important 22% (74 people) who was not sure and said maybe; 10% who answered. 34.
(41) probably not; and a remaining 2% who would definitely not do it –these 8 people rated themselves between 4 and 5 out of 10, in their general personal finances knowledge-. Considering only those who said they would definitely or most likely look for a financial advisor’s help, 64% are female, and only 36% are male. This is consistent with many studies done in the United States and Europe that show women as being more concerned about their personal finances than men; however men appear to be savvier on this subject.. 立. 政 治 大. ‧. ‧ 國. 學. n. al. er. io. sit. y. Nat. Figure 26: Willingness to visit a financial advisor. Ch. engchi. i n U. v. Figure 27 & 28: Gender and age distribution (definitely and most likely) Despite the answer provided in the past question, all respondents were asked to answer the next question: “What is the main reason why you wouldn’t visit a financial advisor?” which was a multiple choice question. Results exhibited that 40% of them said it was a service they could not afford and 35% said there was no one in the country to offer this service. Some also. 35.
(42) mentioned they did not trust a financial advisor (15%), 13% thought they did not need one and 5% just didn’t think it would be helpful. Among the other reasons provided were: considering themselves good in personal finance, shame on sharing information, laziness, lack of time, and thinking it would be better to just buy a book.. 立. 政 治 大. ‧. ‧ 國. 學. Figure 29: Reasons for not visiting a financial advisor. y. Nat. sit. It must be taken into consideration that from the 40% who provided money as the main reason,. al. er. io. 78% chose it as the only option, and the majority of them are women (72%), single (62%) and. n. ages 26-35 (60%). Regarding those who chose the unavailability of the service in Nicaragua. Ch. i n U. v. as the sole reason why they would not go to a financial advisor, 56% had previously answered. engchi. they would definitely go and 35% had said they would most likely go. This is a good feedback because it means there are about 25% of the total survey respondents, would very likely go if the service actually existed. Also, from the total population of 343 respondents, 10% answered they did not need a financial advisor as the main reason why they wouldn’t go to one, equally distributed between men and women, and with a slightly higher percentage of single than married people. Interestingly enough, out of this 10% (equivalent to 34 people) 38% were not saving, 68% were not investing, 76% had debts to pay, and 26% were not saving, not investing and had debts to pay; this leads me to believe that these people haven’t even realized the need they. 36.
(43) have for financial advice and therefore a different way must be found to make the service appealing to them. The final question asked was: “How much would you be willing to pay for an hour of financial advisor service?” The majority of respondents chose the most economic option, which was from $20USD to $24USD (55% of which are 26 to 35 years old). However, it must be noted that because it was a required question, people who previously answered that they would not go to a financial advisor for help, probably chose this option too; in fact, 14% had chosen earlier they would probably not go or definitely not go to a financial advisor. Moreover, 15% said they would be willing to pay from $25 to $29USD; 11% said between. 政 治 大 willing to pay $40 to $50USD 立for an hour of financial advisor service.. $30 and $34USD; only 1% chose the $35-$39USD range; and the final 4% said they would be. ‧ 國. 學. Analyzing those who would pay the minimum amount ($20 USD to $24 USD) and taking out the number who would probably not go, 52% are not saving, 80% are not investing, 69% have. ‧. debt to pay and 35% of them comply with the 3 previous segments. This shows the gravity of the situation on many cases and how much they could benefit from a higher financial literacy.. n. er. io. sit. y. Nat. al. Ch. engchi. i n U. v. Figure 30: Willingness to pay for one hour of financial advising service. 4.5.. Cross-Analysis. After presenting the general findings, I thought it would be interesting to do some crossanalysis on certain questions. Amongst the results, I found that out of the total population, one third is in a real bad financial position since they are neither saving, nor investing and on top,. 37.
(44) they owe money. On the other side, only 7% of respondents are considered to be living a healthy financial life, since they are saving, investing and don’t have any type of debts.. 立. 治 政 大 Figure 31: Financial health. Furthermore, even though in real numbers women seem to be saving more than men, this is. ‧ 國. 學. related to the fact that more women than men answered the survey. A closer look revealed that in fact, only 49% of the total women population are saving, contrasting with 54% of men.. ‧. In this same sense, from the little amount of people who are investing, women are majority. y. Nat. with a total of 56%, however when compared to the gender distribution, I found out that only. er. io. sit. 21% of women are investing compared to 26% of men.. Table 1: Percentage of men and women who save. n. al. Ch. Female Male. i n U. v. Saving. Investment. 54%. 26%. e n49% g c h i 21%. A very interesting finding came when analyzing debt. In this subject, there is an equal gender distribution: 66% of both men and women owe money. Regarding credit card debt, from the total of 113 of people who need to pay the bank for this type of credit, 56% are women and 44% are men; but further calculations expose that in fact more men than women tend to have credit card debt, since only 46% of women with debt need to pay a credit card, compared to 56% of men.. 38.
(45) I also found that people tend to rate their performance and knowledge better than it actually is. Out of the 49 (14%) people who rated themselves either good or excellent on retirement planning, only 16 (33%) were actually saving for that stage of their life. In this same sense, out of the 115 (34%) people who rated themselves either good or excellent on savings, 99 (86% of them) were actually saving a proportion of their income. When referring to debt, 235 (69%) of the respondents considered themselves very good or excellent at handling debts, but only 105 (31% in total) were actually free of debt. Finally, out of the 74 (22%) people who rated themselves good or excellent at investing, only 60% of them own an investment.. 立. 政 治 大. ‧. ‧ 國. 學 er. io. sit. y. Nat. al. n. v i n C h self-appreciation Figure 32: Difference between e n g c h i U and actual performance 4.5.1. Age 26-35 Another focused analysis was made on the 26 to 35 year old group, since they are majority in the survey, and possibly a big niche market for personal finance coaching. Out of the 185 people who belong to this group, 20% are investing in a business –it should also be noted that from the entire population investing in a business, a majority of 80% belong to this age groupand another 28% are actually saving to start a business. Only 48% are saving part of their income, but only 8% are saving for retirement; furthermore 72% (134) are in debt, being credit card the #1 type of debt they have, with 42% having to pay at least one. It was also interesting to see that even though this is the stage of life when people usually start thinking. 39.
(46) about and buying their homes, only 12% had a mortgage to pay, but a significant 16% had a car loan. Moreover, in this same group, 63% (equivalent to 117 young adults) said they have never looked for help managing their personal finances, but 63% from that group (74 people) answered they would probably seek a financial advisor.. 4.5.2. Age 36-45 The number of people who belong to this age range is lower than the previous one; however, they constitute an important part of the survey to be analyzed because their income and needs. 政 治 大. will probably allow them to look for the help of a financial advisor. Out of the 29 people from. 立. this group, 41% -compared to only 16% from the previous age range- own a business, and. ‧ 國. 學. only 10% are saving to start one. This means that people will generally start their own business before the age of 35, after that very few will take the risk to do it.. ‧. Nevertheless this age range is characterized by starting to worry and plan for their retirement –given they are closer to it- since 24% are saving for that stage of their life, compared to only. y. Nat. io. sit. 8% from the ones aged 26-35 who probably think they still have a lot of time to save for that.. er. This group also has more debt: 83% of them vs. 72% compared to the previous one. From this. al. n. v i n C U more settled in their lives, as they data confirms that this age group ishcategorized e n g c hbyi being debt, they owe less on credit cards, but more on mortgage (38%) and car loan (31%). All this. probably own a house, a car and are starting to plan for their retirement.. 40.
(47) 政 治 大 Figure 33: 立Comparison between ages: 26-35 vs. 36-45. ‧ 國. 學. 4.5.3. Employed vs. Own Business and Freelancers. A final cross analysis was made between those people who worked on their own, either as. ‧. freelancers or in their own businesses, and those who were employed at a company. The. io. n. al. er. have a healthier financial life than those employed by others.. sit. y. Nat. findings were very interesting as they showed that, in general, people who work on their own. Ch. engchi. i n U. v. Figure 34: Comparison between freelancers and employed regarding financial health As the graphic above shows, people that work on their own tend to save more (61%), than those employed (49%); they are also planning more for their retirement and are saving for it (13% vs 9% employed); even a higher number admitted to being prepared for an emergency. 41.
(48) (44%) than those who work at companies (29%); and of course, they are more involved in investments (55%) compared to the people employed (29%). In addition, employees tend to have more debt (79%) than those who own their own business, especially credit cards, which is a kind of debt that 41% of those working for others have, compared to only 34% of self-employed. However, when it comes to mortgage, it seems that more freelancers and business owners are already paying for their home, with 21% of them having a mortgage to pay, compared to only 17% of the employed population. Moreover, a final comparison between these 2 segments was made in regards to their. 治 政 大owners chose “I have no money to disposition to go. However, less freelancers and business 立 pay” (35%) as the main reason for not visiting a financial advisor, compared to 45% of those willingness to attend a financial advisor’s consult: there was no real difference in their. ‧ 國. 學. employed. Additionally, they are keen to paying more for an hour of financial advice than those employed.. ‧. n. er. io. sit. y. Nat. al. Ch. engchi. i n U. v. Figure 35: Comparison between freelancers and employees, regarding ability to pay for a financial advisor 4.6.. Survey Conclusions. After analyzing the survey answered by 343 Nicaraguan people from all age ranges in a one week period, I now have more data on the people’s financial knowledge, performance and needs.. 42.
(49) One of the evident key findings is that people tend to overestimate their financial knowledge and they also have a tendency to rate their performance and actions better than they actually are. One third of the respondents are not saving, nor investing and in debt, compared to only 7% who, on the contrary, are saving, investing and not in debt. As many studies implemented in the United States and Europe haven shown, women seem to worry more about their financial performance than men. This can be observed in the fact that more female than male answered the survey, and also in the fact that they rated their overall knowledge and performance lower than men, whom seem to be more confident about the decisions they make.. 治 政 The personal finance aspects that respondents seem大 to be more self-assured about are 立 budgeting, savings and debt. However, as mentioned before, their actual performance is not in ‧ 國. 學. accordance with their self-ratings. For example, almost 70% said they were either very good or excellent in handling debt, but it turns out that 66% have debts to pay, and 50% of those. ‧. have credit card debts –which is not a good type of debt -.. y. Nat. Similarly, despite more than two thirds of respondents considered themselves as being good at. sit. savings, only half of them actually save a part of their income. What is more important is the. er. io. lack of financial planning because from those who save, 30% are not able to save a fix sum. al. n. v i n C hreasons provided were lack of financial planning, as the e n g c h i U that they forgot to save and that each month. Moreover, from the half that does not save, 30% don’t do it because of the same. something always came up. The main reason why people save is to have some funds in case. of an emergency; if true financial planning existed, an emergency fund for several months would have been created, allowing them to start saving for other goals. This deficiency in financial planning can also be observed in the fact that most of the population is not worried about their retirement and they are not preparing for it. Only 17% of the respondents were saving for this stage of their life and the majority of them were the older people. Young adults apparently think their retirement is decades away, and therefore don’t see the importance in starting to save now. This could mean an opportunity to improve, but further analysis must be made to determine if part of the reason why they are not saving is because culture dictates that their descendants will look after them.. 43.
(50) There are other personal finance subjects were respondents seem to accept their lack of knowledge and poor performance in, such as investments, insurance and retirement plans; the problem is that apparently they still don’t understand the relevance of these topics. Having only 23% of the population investing their money means that there is still a big number who loses purchasing power year after year. Moreover, those who do invest, do so mostly in small businesses, with only 11% investing in the Stock Market. This constitutes a window of opportunity, because the likeliest reason why they are not investing here is that they don’t know of its existence or how it works.. 治 政 大 as three quarters of them chose performance, their self-rating was not good to start with, 立 between very bad and regular. This can be explained by the fact that in Nicaragua people Regarding insurance, although there were no specific questions to find out respondents’ actual. ‧ 國. 學. don’t have the culture or knowledge to invest in insurance, and it is seen as an unnecessary expense. The only insurance bought by most people is car insurance –because it is mandatory.. ‧. There is also a small part of the population that owns a life or medical insurance, but whom didn’t acquire on their own, instead it was provided by their employers.. y. Nat. sit. Given the second objective of the survey was to discover the potential market for a personal. er. io. finance coach in Nicaragua, some questions were asked to find out people’s responsiveness to. al. n. v i n C the for financial help before, and from h eremaining i U most of them considered people n g c hpopulation,. looking for and receiving financial help. An astonishing 62% of respondents had never looked. around them (parents, family, friends, partner) to be good sources of financial help. This helps explain why there is such a low performance on the different aspects of personal finance (savings, debt, insurance, investment, etc.). However, what was truly important to know is if they would be willing to learn and improve their financial performance in the future, to which 78% answered positively. In addition, 38% said they would like to learn through a financial advisor –going to a private consult- and the same amount would like to take a regular course or workshop. What was surprising was having 44% answer they would rather take an online course, since in Nicaragua it is not common to offer this learning method.. 44.
(51) In this sense, one of the most important things I needed to know was their willingness to ask a financial advisor for help, where 32% said they definitely would go and 34% said they most likely would. As experts in marketing suggest, only these 2 groups of answer need to be taken into consideration because those who provided answers such as maybe, most likely not, or definitely not, constitute very little chances of a positive response. This same expertise suggests that from those who answered definitely yes, only 80% must be considered. And from those who answered most likely, only 75% must be considered. This means that in reality about 50% of total respondents would actually look for a financial advisor’s help, and they are mostly young women aged 26 to 35.. 治 政 Finally, through the survey I was able to find out that 大 most people would be willing to pay 立 around $20.00 to $25.00 USD for an hour of financial advice. Even though this might be a ‧ 國. 學. low price for other coaches and financial advisors in the world, Nicaragua’s particular macroeconomic conditions must be taken into consideration, and I feel it would be a fair price. ‧. to charge because a price over $25.00 USD would mean that most of the population would not be able to afford the service and they would continue to live an unhealthy financial live.. n. er. io. sit. y. Nat. al. Ch. engchi. 45. i n U. v.
數據
+7

相關文件
civilian life and opportunities ©2011 Yen-Ping Shan All rights reserved
As as single precision floating point number, they represent 23.850000381, but as a double word integer, they represent 1,103,023,309.. The CPU does not know which is the
Accordingly, the article is to probe into how Taixu and the others formed the new interpretation to reason the analogy between Vaiduryanirbhasa and a pure land in this world, also
After students have had ample practice with developing characters, describing a setting and writing realistic dialogue, they will need to go back to the Short Story Writing Task
Then they work in groups of four to design a questionnaire on diets and eating habits based on the information they have collected from the internet and in Part A, and with
Good joke tellers can add whatever they want to the joke as they tell it, but they clearly know the details of the beginning , mi ddle and ending of the joke.. It is also
To make friends, people need to spend time together so they can discover their common interests and have a.. comfortable rapport with
Survivor bias is that when we choose a sample from a current population to draw inferences about a past population, we leave out members of the past population who are not in
