Tai-Chia Chiu1 Yang-Wei Lin1 Chih-Ching Huang1 Andreas Chrambach2 Huan-Tsung Chang1 1Department of Chemistry,
National Taiwan University, Taipei, Taiwan, R.O.C.
2National Institute of Child Health and Human Development, National Institutes of Health, Bethesda, MD, USA
A simple, rapid, and sensitive method for analysis of
SYPRO Red labeled sodium dodecyl sulfate-protein
complexes by capillary electrophoresis with
laser-induced fluorescence
We describe a segmental filling method for the analysis of SYPRO Red labeled sodium dodecyl sulfate (SDS)-proteins (SRSPs) by capillary electrophoresis-laser induced flu-orescence (CE-LIF) with electroosmotic counterflow of poly(ethylene oxide) (PEO). It is shown that SDS and salt play a crucial role in determining the fluorescence intensity of the SRSP. Although the fluorimetric measurements reveal that the SRSPs fluoresce strongly in Tris-borate (TB) buffer containing 0.1% SDS and high concentrations of NaCl (100 mM), these conditions are not appropriate to CE in view of Joule heating.
To overcome that impediment, we applied a plug of 0.1% SDS (1/5 to 1/3 of the injec-tion volume) prior to injecinjec-tion of samples (0.64mL) prepared in TB buffer containing 50 mMNaCl and SYPRO Red. When using a background electrolyte of 0.6% PEO in TB buffer containing NaCl, electroosmotic counterflow of the analytes allows one to concentrate large sample volumes (up to 1/3 of effective capillary length) in 21 min, with detection of 0.35 and 0.10 nMfor bovine serum albumin and casein, respectively.
With a linear dynamic range from 10 nMto 5mM, this method provides the capability of
determining the concentration of casein in cow’s milk as 0.456 0.03 mM(n = 5).
Keywords: Capillary electrophoresis / Laser-induced fluorescence / Poly(ethylene oxide) /
SYPRO Red / Sodium dodecyl sulfate-proteins DOI 10.1002/elps.200305428
1 Introduction
Proteomics seeking to characterize the entire comple-ment of proteins expressed in a cell or cell fraction under defined conditions, requires techniques with sensitivity, great efficiency, and high throughput [1–3]. Mass spec-trometry in conjunction with 2-D PAGE or with liquid chro-matography is commonly applied for that purpose [4, 5]. Supplementing those methods, capillary electrophoresis (CE) combined with laser-induced fluorescence (LIF), with high resolving power, sensitivity, rapidity, and potential for automation, has been shown capable of analyses of low amounts of proteins in the presence of abundant ones and of hydrophilic proteins in the presence of hydro-phobic ones [6–13]. Using UV lasers such as the argon ion laser at 275 nm, limits of detection (LODs) for proteins
at the nM level are readily achieved by CE, allowing for single-cell analysis [14, 15]. Alternatively, the analysis of proteins labeled with fluorophores or derivatized with a strongly fluorescent complexing agent can employ rela-tively low-cost and stable lasers such as argon ion and He-Ne lasers [16–19].
Since Cohen and Karger [20] reported the use of cross-linked polyacrylamide for the separation of proteins by CE, numerous polymer matrices including gels and poly-mer solutions have been tested with varying degrees of success [8, 21–24]. With a capability of dynamic coating of the capillary wall and a high sieving ability, poly(ethyl-ene oxide) (PEO) has been particularly useful for protein analysis [25–28]. Recently, we have applied PEO solu-tions for the analysis of large-volume protein samples (up to 0.36 effective capillary length) using an Nd-yttrium-aluminum-garnet (Nd-YAG) laser at 266 nm [10, 26]. Dur-ing concentration and separation, PEO enters the capil-lary filled with Tris-borate (TB) buffer by EOF. Negatively charged proteins migrate electrophoretically into the PEO solution from the sample zone in a direction opposite from that of EOF and thus decelerate and concentrate under the effects of molecular sieving and increased viscosity of the polymer solution.
Correspondence: Dr. Huan-Tsung Chang, Department of
Chem-istry, National Taiwan University, Taipei, Taiwan, R.O.C.
E-mail: [email protected] Fax: +11-886-2-23621963
Abbreviations: CAS,b-casein; CF, concentration factor; CON,
conalbumin; HGB, hemoglobin; MC 540, merocyanine 540;
OVA, ovalbumin; PEO, poly(ethylene oxide); SRSB, SYPRO Red
labeled SDS-BSA; SRSP, SYPRO Red labeled SDS-proteins; TB, Tris-borate
Based on our previous approaches [29, 30], we devel-oped a technique for the analysis of large-volume pro-teins by CE-LIF using a He-Ne laser at 543.6 nm. Unlike using a UV laser, this method is cost-effective and versa-tile. Fast derivatization reactions of proteins with SYPRO Red or merocyanine 540 (MC 540) render these dyes suit-able for the analysis of proteins in biological samples without tedious precolumn fluorescent labeling. The results show that SDS, salt, and ionic strength play an important role in determining detection sensitivity and resolution, in view of their effects on mobility, fluorescence, and adsorp-tion onto the capillary wall.
2 Materials and methods
2.1 EquipmentThe basic design of the CE separation system was that previously described [30]. Briefly, a high-voltage (con-stant voltage, 30 000 V, 1 mA) power supply (Gamma High Voltage Research, Ormond Beach, FL, USA; model No. PR30–1P) was used to generate the electric field. The entire detection system was enclosed in a black box with a high-voltage interlock. The high-voltage end of the separation system was placed in a laboratory-made plexiglass box for safety. A 1.5 mW He-Ne laser with 543.6 nm output from Uniphase (Mantence, CA, USA) was used for excitation. The light was collected with a 106 objective (numerical aperture = 0.25). One RG 610 cutoff filter (Edmund Industrial Optics, Arrington, NJ, USA) was used to block scattered light before the emitted light reached the photomultiplier tube (Hamamatsu R928, Shizuoka-Ken, Japan). The amplified currents were trans-ferred directly through a 10 kO resistor to an A/D con-verter at 10 Hz (CSW 1.7; DataApex, Prague, Czech Re-public) and stored in a personal computer. Bare fused-silica capillaries (Polymicro Technologies, Phoenix, AZ, USA) with 75mm ID and 365 mm OD were used for protein separation without internal coating.
2.2 Chemicals
All chemicals for preparing buffer solutions and polymers were obtained from Sigma (St. Louis, MO, USA), except PEOs (Mr 4 000 000 and 8 000 000) which were from
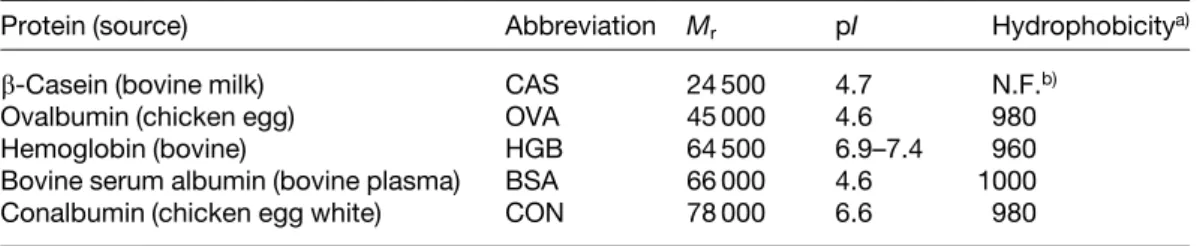
Aldrich (Milwaukee, WI, USA). MC 540 was obtained from Acros Organics (Geel, Belgium) and SYPRO Red from Molecular Probes (Eugene, OR, USA). TB buffers were prepared from tris(hydroxymethyl)aminomethane (Tris) by adjustment with boric acid to pH 8.0, 9.0, and 10.0. Unless otherwise noted, the molarity of Tris repre-sents that for the TB buffer. PEO solutions were prepared in TB buffers, pH 9.0 [30]. Bovine serum albumin (BSA), b-casein (CAS), conalbumin (CON), hemoglobin (HGB), and ovalbumin (OVA) were dissolved in water and diluted to suitable concentrations with TB buffer, pH 9.0, prior to CE analysis. Some of their physical and chemical proper-ties are listed in Table 1 [31]. Cow’s milk was purchased from a grocery store.
2.3 On-line concentration and separation
Capillaries were washed with 0.5MNaOH overnight. Prior
to each run, they were subjected to electrophoresis in 0.5MNaOH at 1.0 kV for 10 min to remove residual PEO
solution and refresh the capillary wall. The sample was injected by hydrodynamic injection from a 30 cm height for a time ranging from 10 to 180 s or by electrokinetic injection at 15 kV for a time ranging from 5 to 120 s. If an SDS plug was applied (for details see below), it was injected prior to the sample. The anodic end of the capil-lary was then immersed in PEO solution. In application to SRSPs, the proteins were allowed to react with the fluo-rescent dye in 38 mMTB buffer, pH 10.0, containing 50 mM
NaCl, and 0.1% SDS prior to their CE separation at 15 kV in a PEO solution, pH 9.0, containing 5.0 mM NaCl. In
the case of labeling the proteins with MC 540, a 1.7% PEO (4 MDa) solution was prepared in 50 mMTB buffer,
pH 8.0, containing 4.0mMMC 540. Protein solutions were prepared in 50 mM TB buffer, pH 9.0. During CE, PEO
Table 1. Chemical and physical properties of proteins
Protein (source) Abbreviation Mr pI Hydrophobicitya)
b-Casein (bovine milk) CAS 24 500 4.7 N.F.b)
Ovalbumin (chicken egg) OVA 45 000 4.6 980
Hemoglobin (bovine) HGB 64 500 6.9–7.4 960
Bovine serum albumin (bovine plasma) BSA 66 000 4.6 1000
Conalbumin (chicken egg white) CON 78 000 6.6 980
a) [31] b) Not found
CE
and
solutions entered the capillary by EOF. Reaction between proteins, SDS, and MC 540 in applications where they are contained in the PEO solution took place during their electrophoretic migration through the counterflowing PEO solution. The crossing between electrophoretically migrating and EOF-driven particles results in on-line con-centration concomitant with separation.
2.4 CE analysis of cow’s milk
To reduce the adsorption of milk constituents onto the capillary wall, 0.5 mL of milk was mixed with 99.5 mL of 38 mM TB buffer, pH 10.0, containing 0.1% SDS and
50 mM NaCl. SYPRO Red stock solution (50006) was
added to the mixture to a concentration of 106. Hydro-dynamic injection was carried out from a 30 cm height for 20 s, followed by CE separation at 15 kV.
3 Results and discussion
3.1 Effect of buffer concentration and ionic strength on fluorescence intensity of SYPRO Red labeled SDS-proteins
Over the last few years, a series of SYPRO dyes have been developed and tested for staining proteins sepa-rated by SDS-PAGE [32, 33]. These dyes interact with the SDS-protein complexes rather than protein itself; thus, SDS can be assumed to play a crucial role in de-termining the sensitivity of their fluorimetric detection. It has also been found that the ionic strength of the back-ground electrolyte is an important parameter with respect to sensitivity of fluorimetric detection and to resolution [34]. The present study of the fluorimetric detection sensi-tivity and of the resolution of fluorescently labeled SDS-proteins by CE-LIF provides a more detailed analysis of those dependencies since it was conducted by a tech-nique of segmental filling of the capillary which allows one to separately investigate the effects of SDS and buf-fer ionic strength on fluorescence intensity in three difbuf-fer- differ-ent phases, viz. (i) capillary contdiffer-ents, (ii) PEO solution, and (iii) sample.
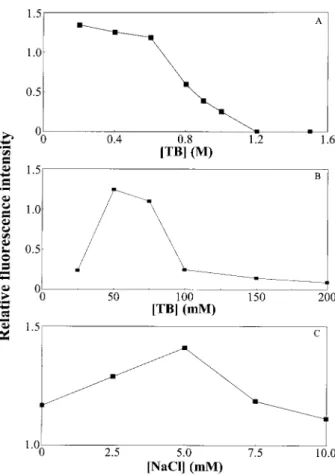
(i) Figure 1A shows that the fluorescence intensity of the SYPRO Red labeled SDS-BSA (SRSB) decreased with increasing concentration of TB buffer, pH 10.0, in the cap-illary through which CE proceeds with electroosmotic counterflow generated by a solution containing 0.6% PEO, 50 mM TB, pH 9.0, 5 mMNaCl. It should be noted
that the fluorescence intensities of SRSB are only slightly different (,1.0%) at pH values between 7.0 and 10.0, while adsorption of PEO on the capillary wall is stronger at pH values less than 9.0 [29]. Although we have shown
Figure 1. Effects of TB and NaCl concentrations on the fluorescence intensity of SRSB. The labeled SDS-BSA (1mM) sample was prepared in 38 mMTB, pH 10.0, containing 26 SYPRO Red and 0.1% SDS and applied electrokinetically as described in Section 2.3. Separa-tions were conducted at 250 V/cm. Capillary, 60 cm in total length, 50 cm in effective length. (A) TB buffer, pH 10.0, at various concentrations filled into the capil-lary; PEO, 0.6% (8 MDa), prepared in 50 mMTB, pH 9.0, containing 5.0 mM NaCl, is introduced into the capillary by EOF. (B) 0.6% PEO (8 MDa) prepared in TB buffer, pH 9.0, at various concentrations, containing 5.0 mM NaCl; the capillary contains 400 mMTB buffer, pH 10.0. (C) NaCl concentration in the solution containing 0.6% PEO (8 MDa) prepared in 50 mMTB buffer, pH 9.0, is var-ied. The capillary contains 400 mMTB buffer, pH 10.0.
that CE can be conducted reproducibly at concentrations of TB buffer over 1.0M[10], which are needed in order to minimize PEO adsorption onto the inner capillary wall and thus to achieve fast and reproducible protein separations, the resulting decrease in fluorescence is obviously prob-lematic. The decrease in fluorescence appears to be mainly due to quenching caused by Tris, a notion sup-ported by fluorimetric measurements on Tris solutions of various concentrations (data not shown). In addition, Joule heating may contribute to the decrease of fluores-cence intensity at high TB concentrations.
(ii) Figure 1B shows that the fluorescence intensity of the SRSB complex varies in biphasic fashion with the TB concentration in the PEO solution, pH 9.0, with a sharp decrease in fluorescence beyond 75 mMwhen the
capil-lary contains TB, pH 10.0, at a constant concentration of 400 mM. Figure 1C depicts the impact of NaCl
concentra-tion in the PEO soluconcentra-tion on the fluorescence intensity of SRSB in CE when the capillary is filled with 400 mMTB buffer, pH 10.0, revealing that a small amount of NaCl up to 5 mM in the PEO solution effectively augments the fluorescence intensity of SRSB while higher NaCl concen-trations inhibit it [35]. The presence of a small amount of salt is also of benefit for minimizing protein adsorption onto the capillary wall [36].
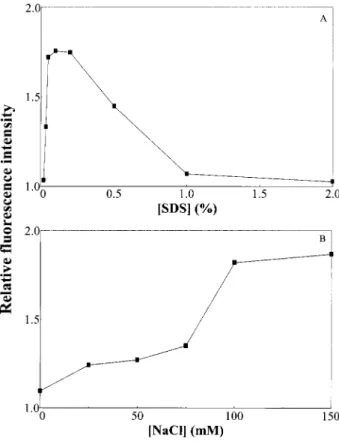
(iii) Although SRSB fluoresces strongly at a steady-state concentration of 0.5% SDS, we have found that large amounts of SDS in the sample cause the deterioration of fluorescence and resolution presumably due to Joule heating. Figure 2A shows that the fluorescence intensity of SRSB complexes is maximized when the protein
sam-Figure 2. Effects of (A) SDS and (B) NaCl concentrations in the sample on the fluorescence intensity of SRSB. The SRSB (1mM) sample was prepared in 38 mMTB, pH 10.0, containing 26 SYPRO Red and varying concentrations of SDS and NaCl, and was applied electrokinetically. The capillary was filled with 400 mMTB buffer, pH 10.0. A solution of 0.6% PEO (8 MDa) prepared in 50 mMTB buffer at pH 9.0 containing 5 mMNaCl entered the capil-lary by EOF. Other conditions were as described in Fig. 1.
ple is prepared in TB buffer containing approximately 0.1% SDS. Figure 2B shows that the fluorescence of the SRSB increased with increasing NaCl concentration in the sample phase, suggesting that the Coulombic inter-action between SDS-proteins and SYPRO Red should not be a major contributor to formation of the complex. Together with the effect of SDS concentration on fluores-cence of the complex these results support the notion that the interaction between fluorescent dye and protein is through the hydrophobic tail of SDS, i.e., hydrophobic regions or patches formed by association of those tails. Thus, maximal sensitivity of CE for the analysis of SRSB under the discontinuous conditions described in the pre-sent report is reached in a capillary filled with 400 mMTB,
pH 10.0, with EOF of a PEO plug prepared in 50 mMTB,
pH 9.0, containing 5 mMNaCl, and a protein sample
pre-pared in 38 mMTB, pH 10.0, containing 0.1% SDS, 50 mM
NaCl, and 26 SYPRO Red.
3.2 Effect of an SDS plug on the CE of fluorescently labeled SDS-proteins
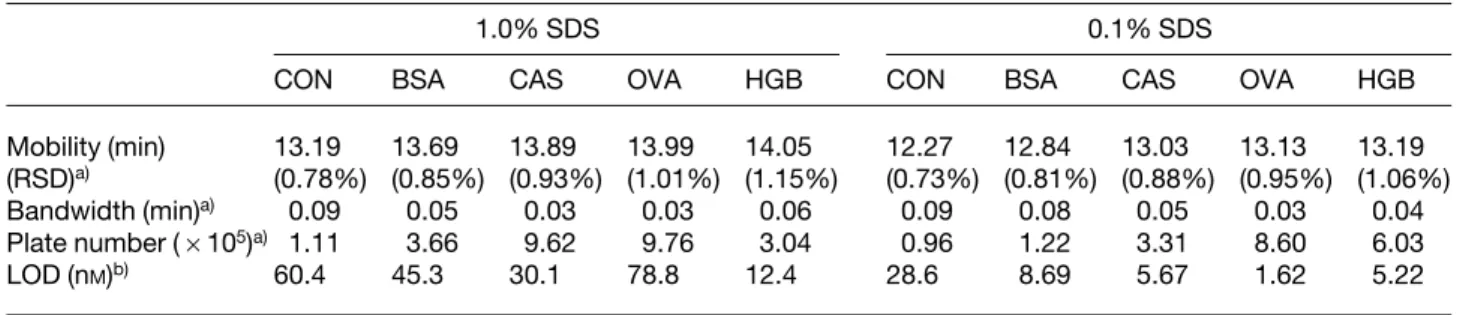
Although the sensitivity was optimized using the condi-tion listed above, separacondi-tion of proteins under those con-ditions is unsuccessful, mainly due to changes in the electrophoretic mobility of the proteins in the presence of SDS. The separation might be possible using 8% linear polyacrylamide gel [18], however, it requires on-column polymerization, shortening the life time of the capillary and giving rise to irreproducibility. To overcome this im-pediment, we applied an SDS plug prior to sample injec-tion, which has been shown previously to be an effective way for improving the separation efficiency of proteins [28]. Figure 3 shows the effect on resolution of SRSPs using plugs of 1.0% SDS for 10 s (Fig. 3A) and 0.1% SDS for 60 s (Fig. 3B). It should be noted that the critical micel-lar concentration (CMC) for SDS in aqueous solution is about 0.23% [37]. At 1.0% SDS, the peaks appearing in the electropherogram around 10 min appear to be free dye detected due to an increase in the dye fluorescence after binding to SDS micelles. Owing to the formation of protein complexes with micellar SDS, the migration times were slightly prolonged in the presence of 1.0% SDS. Although the peaks were not completely resolved at baseline, the SDS plugs produce a significant increase in resolution and reproducibility. For example, the resolution value between OVA and HGB was 0.01 in the absence of an SDS plug, 0.71 on application of a 1.0% SDS plug, and 0.91 after application of a 0.1% SDS plug, respectively. The relative standard deviation (RSD) values for the migra-tion time of HGB are less than 1.2% and about 2.5% in the presence and absence of the SDS plugs, respectively. Table 2 further shows the LODs at the signal-to-noise
Table 2. Effect of the SDS plug on the mobility, bandwidth, plate number and LOD values for proteins
1.0% SDS 0.1% SDS
CON BSA CAS OVA HGB CON BSA CAS OVA HGB
Mobility (min) 13.19 13.69 13.89 13.99 14.05 12.27 12.84 13.03 13.13 13.19 (RSD)a) (0.78%) (0.85%) (0.93%) (1.01%) (1.15%) (0.73%) (0.81%) (0.88%) (0.95%) (1.06%)
Bandwidth (min)a) 0.09 0.05 0.03 0.03 0.06 0.09 0.08 0.05 0.03 0.04
Plate number (6105)a) 1.11 3.66 9.62 9.76 3.04 0.96 1.22 3.31 8.60 6.03
LOD (nM)b) 60.4 45.3 30.1 78.8 12.4 28.6 8.69 5.67 1.62 5.22
a) Data were taken from Fig. 3. b) Conditions were as in Fig. 3.
Figure 3. Separations by CE of five SRSPs in 1.5MTB, pH 10.0, with counterflow by EOF at 375 V/cm of a 1.7% PEO (4 MDa) solution prepared in 400 mM TB, pH 9.0, containing 5.0 mMNaCl. SRSPs were prepared in 38 mM TB, pH 10.0, containing 0.1% SDS, 50 mM NaCl, and 106 SYPRO Red. An SDS plug was applied prior to sample injection from a 30 cm height for 20 s. The composition of the plug was (A) 1.0% SDS applied for 10 s and (B) 0.1% SDS for 60 s. Peak identities and sample concentrations (nM): (A) 1, CON (700); 2, BSA (800); 3, CAS (500); 4, OVA (300); 5, HGB (700). (B) 1, CON (600); 2, BSA (300); 3, CAS (200); 4, OVA (100); 5, HGB (400).
ratio (S/N) = 3 are at the nMlevel when a 0.1% SDS plug was applied [28]. Compared to the 0.1% SDS plug, a 1.0% SDS plug provided higher LOD values, apparently because of a relatively unstable baseline. When com-pared to Harvey’s result [18], this method is less sensi-tive, presumably because of a higher background and shift in the baseline, but is slightly faster due to a high EOF.
3.3 Concentration of protein under the CE peaks
Recently, two on-line concentration techniques based on pH and viscosity discontinuities as well as on a sieving mechanism for the CE analysis of SDS-proteins have been reported, yielding sensitivity improvements greater than 1500-fold [10, 26]. In short, that concentration effect was achieved by injection of an SDS plug (in the cathodic side of the sample zone) prior to the sample into a TB solution at pH 10.0 with concurrent electroosmotic coun-terflow of a PEO solution at pH 9.0. After injection of the sample (pH 10.0), the proteins reacted with SDS con-tained in the plug (pH 10.0), with a concomitant increase in mobility, before entering into the PEO solution at pH 9.0, where they concentrated due to deceleration at the lower pH, due to the accumulation at a restrictive polymeric sur-face with sieving properties and high viscosity, and due to the opposition of EOF to mobility. In fact, the accumula-tion at a concentrated zone of the proteins accelerated through SDS-binding at the interface to a PEO solution can be viewed to be analogous to the formation of con-centrated sample zones at the surfaces of gels, zones which also narrow in proportion to mobility (field strength). Table 3 shows the peak concentration achieved, with the concentration factors (CFs) ranging from 25 to 58. The LOD values for the SRSPs are reduced to 0.84 nM–28 pM
when CE is carried out in the 40 cm capillary filled with 1.5MTB buffer, pH 10.0. The definition of CF is the ratio of the LOD obtained for the injection at 30 cm for 10 s to that for 180 s. When a 60 cm capillary filled with 400 mM
TB buffer, pH 10.0, was applied to the CE of SRSPs, the LODs were reduced to pM, with the CF values increased
to 78-fold (LODs obtained at 15 kV for 5 s compared to those for 120 s). The LOD of 26 pMfor BSA shows that
this method is slightly more sensitive than Harvey’s [18]. However, the loss in resolution is problematic, showing the importance of an SDS plug. It is important to note that the fluorescence intensities for the protein complexes
Table 3. Comparison of migration time, LODs, and CF under different separation conditions
Aa) Bb) Migration time (RSD) LOD (nM) CF Migration time (RSD) LOD (nM) CF CON 20.27 (2.41%) 0.84 34 10.41 (2.13%) 0.036 48 BSA 20.42 (2.97%) 0.35 25 10.43 (2.18%) 0.026 78 CAS 20.51 (3.04%) 0.10 55 10.44 (2.20%) 0.033 59 OVA 20.55 (2.89%) 0.028 58 10.47 (2.22%) 0.027 72 HGB 20.58 (3.20%) 0.14 38 10.50 (2.25%) 0.029 45
a) 0.1% SDS plug was applied at 30 cm height for 60 s prior to sample injection; sample injection was con-ducted at 30 cm height for 180 s; the capillary was 40 cm (30 cm in effective length); other conditions were the same as in Fig. 3B.
b) The capillary was filled with 400 mMTB, pH 10.0; 0.6% PEO (8 MDa) was prepared in 50 mMTB buffer contain-ing 5 mM NaCl, pH 9.0; sample injection was con-ducted at 15 kV for 120 s; and the capillary was 60 cm (50 cm in effective length); other conditions were the same as in Fig. 3B.
increased with increasing injection volume over the range of 10–180 s at 30 cm height or of 5–120 s at 15 kV, with all R2values greater than 0.98. The relatively longer
separa-tion time when using PEO prepared in 400 mMTB
com-pared to in 50 mMTB is due to a reduced EOF.
To illustrate the advantage of using SYPRO Red for fluorescent labeling of SDS-proteins in CE analysis, we compared the CE patterns with those using MC 540. MC 540 belongs to the family of benzoxazol merocyanine dyes with heterocyclic aromatic groups linked by a poly-methine chain and has been commonly used for the anal-ysis of membrane proteins [38, 39]. Separations of MC 540 labeled proteins cannot be conducted at high con-centrations of TB buffer of high pH (. 8.0) since MC 540 is unstable under those conditions and fluoresces weakly. Figure 4 shows that the CE analysis of MC 540 labeled SDS-proteins is slow, the baseline is relatively unstable, and the peak profiles are relatively broad when compared to those using SYPRO Red. However, the dye is relatively less costly. When applying a plug of 0.15% SDS at 30 cm height for 90 s prior to injecting the protein sample at the same height for 180 s, the LOD values for SDS-CON, SDS-CAS, and SDS-HGB are only at the nM level. For
SDS-BSA, MC 540 provides sensitivity similar to that of
Figure 4. Separation of four MC 540 labeled SDS-proteins in the presence of EOF at 250 V/cm using 50 mM TB, pH 8.0, 1.7% PEO (4 MDa) containing 4.0mMMC 540. Capillary, 60 cm in total length, 50 cm in effective length, filled with 400 mM TB buffer, pH 10.0. A plug of 0.15% SDS was injected at 30 cm height for 90 s prior to hydro-dynamic injection of a protein sample at the same height for 180 s. The concentrations of the proteins were 10 nM. Peak identities: 1, CON; 2, BSA; 3, OVA; 4, HGB.
SYPRO Red, presumably due to the fact that BSA is the most hydrophobic protein of the series under analysis as shown in Table 1.
3.4 Analysis of cow’s milk
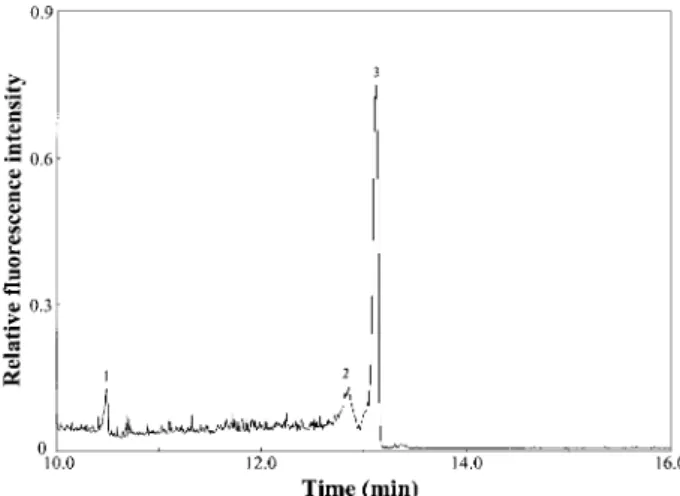
The electropherogram depicted in Fig. 5 shows that the analysis of a milk sample diluted with TB buffer was completed in 14 min. The last two peaks correspond to
Figure 5. CE-LIF separation of cow’s milk proteins deri-vatized with SDS and fluorescently labeled by SYPRO Red, with electroosmotic counterflow by PEO solution. Peak identities: (1) unknown; (2) BSA; (3) CAS. Other con-ditions were as those described in Fig. 3B.
BSA and CAS. The linear range for CAS is 10 nM– 5mM,
with R2= 0.99. According to the linear regression analysis,
we estimate a concentration of casein in cow’s milk of 0.456 0.03 mM(n = 5). That result shows the potential of
the method for monitoring the quality of milk, in addition to its advantages of low cost, operational simplicity, and robustness of the analysis.
4 Concluding remarks
We have demonstrated a simple concentration and sep-aration method for the analysis of SDS-proteins by CE-LIF using a low-cost He-Ne laser. SYPRO Red reacts rapidly with proteins and its fluorescence intensity in-creases upon binding to an SDS-protein, an advantage when compared to fluorescent labeling with MC 540. The results shown in this study demonstrate that SDS and salt play an important role in determining detection sensitivity and resolution. The segmental filling technique allows the separation of proteins using low-viscosity poly-mer solution and noncovalent dyes, leading to simplicity, speed, and low costs. By applying a plug of SDS prior to sample injection, improved peak concentration has been achieved, presumably due to acceleration of protein migration prior to entering a counterflowing PEO solution of relatively high viscosity and sieving properties. The increased peak concentration translates into LODs of 0.35 and 0.10 nM for BSA and CAS, respectively. This work was supported by the National Science Council of Taiwan, the Republic of China, under contract No. NSC 91-2113-M-002-052.
Received November 29, 2002
5 References
[1] Williams, K. L., Electrophoresis 1999, 20, 678–688. [2] Patton, W. E., Electrophoresis 2000, 21, 1123–1144. [3] Gevaert, K., Vandekerckhove, J., Electrophoresis 2000, 21,
1145–1154.
[4] Feng, B., McQueney, M. S., Mezzasalma, T. M., Slemmon, J. R., Anal. Chem. 2001, 73, 5691–5697.
[5] Piubelli, C., Galvani, M., Hamdan, M., Domenici, E., Righetti, P. G., Electrophoresis 2002, 23, 298–310.
[6] Pantazaki, A., Taverna, M., Vidal-Madjar, C., Anal. Chim. Acta 1999, 383, 137–156.
[7] Hunt, G., Nashabeh, W., Anal. Chem. 1999, 71, 2390–2397. [8] Hu, S., Zhang, Z., Cook, L. M., Carpenter, E. J., Dovichi, N. J.,
J. Chromatogr. A 2000, 894, 291–296.
[9] Chan, K. C., Muschik, G. M., Issaq, H. J., Electrophoresis 2002, 23, 2062–2066.
[10] Tseng, W.-L., Chang, H.-T., Anal. Chem. 2000, 72, 4805– 4811.
[11] Jin, L. J., Giordano, B. C., Landers, J. P., Anal. Chem. 2001, 73, 4994–4999.
[12] Hu, S., Dovichi, N. J., Anal. Chem. 2002, 74, 2833–2850. [13] Shen, Y., Smith, R. D., Electrophoresis 2002, 23, 3106–3124. [14] Yeung, E. S., J. Chromatogr. A 1999, 830, 243–262. [15] Chen, S., Lillard, S. J., Anal. Chem. 2001, 73, 111–118. [16] Lee, I. H., Pinto, D., Arriaga, E. A., Zhang, Z., Dovichi, N. J.,
Anal. Chem. 1998, 70, 4546–4548.
[17] Zhang, Z., Krylov, S., Arriaga, E. A., Polakowski, R., Dovichi, N. J., Anal. Chem. 2000, 72, 318–322.
[18] Harvey, M. D., Bandilla, D., Banks, P. R., Electrophoresis 1998, 19, 2169–2174.
[19] Tseng, W.-L., Chiu, T.-C., Weng, J.-M., Chang, H.-T., J. Liq. Chromatogr. Rel. Technol. 2001, 24, 2971–2982.
[20] Cohen, A. S., Karger, B. L., J. Chromatogr. 1987, 397, 409– 417.
[21] Simò-Alfonso, E., Conti, M., Gelfi, C., Righetti, P. G., J. Chro-matogr. A 1995, 689, 85–96.
[22] Yefimov, S., Sjomeling, C., Yergey, A., Chrambach, A., Elec-trophoresis 2001, 22, 999–1003.
[23] Righetti, P. G., Gelfi, C., Verzola, B., Castelletti, L., Electro-phoresis 2001, 22, 603–611.
[24] Horvath, J., Dolník, V., Electrophoresis 2001, 21, 644–655. [25] Bean, S. R., Lookhart, G. L., J. Agric. Food Chem. 1999, 47,
4246–4255.
[26] Tseng, W.-L., Chang, H.-T., J. Chromatogr. A 2001, 924, 93– 101.
[27] He, Y., Yeung, E. S., J. Proteome Res. 2002, 1, 273–277. [28] Tseng, W.-L., Lin, Y.-W., Chang, H.-T., Anal. Chem. 2002, 74,
4828–4834.
[29] Tseng, W.-L., Hsieh, M.-M., Wang, S.-J., Huang, C.-C., Lin, Y.-C., Chang, P.-L., Chang, H.-T., J. Chromatogr. A 2001, 927, 179–190.
[30] Huang, C.-C., Hsieh, M.-M., Chiu, T.-C., Lin, Y.-C., Chang, H.-T., Electrophoresis 2001, 22, 4328–4332.
[31] Fasman, G. D. (Ed.), Handbook of Biochemistry and Molec-ular Biology, CRC Press, Boca Raton, FL 1977, pp. 210–243. [32] Steinberg, T. H., Jones, L. J., Haugland, R. P., Singer, V. L.,
Anal. Biochem. 1996, 239, 223–237.
[33] Steinberg, T. H., Haugland, R. P., Singer, V. L., Anal. Bio-chem. 1996, 239, 238–245.
[34] Huang, C.-C., Chiu, T.-C., Chang, H.-T., J. Chromatogr. A 2002, 966, 195–203.
[35] Allen, G., Biochem. J. 1974, 137, 575–578.
[36] Green, J. S., Jorgenson, J. W., J. Chromatogr. 1989, 478, 63–70.
[37] Otzen, D. E., Oliverberg, M., J. Mol. Biol. 2002, 315, 1231– 1240.
[38] Cˇ underlíková, B., Sˇikurová, L., Chem. Phys. 2001, 263, 415– 422.
[39] Mateasˇik, A., Sˇikurová, L., Chrovát Jr., D., Bioelectrochem-istry 2002, 55, 173–175.