國 立 交 通 大 學
應用化學研究所
碩 士 論 文
新穎低表面能材料 Polybenzoxazine 高分子之應用及其運用
於能表面自清潔的超疏水材料之研究
A Novel Low Surface Free Energy Material Polybenzoxazine
Characterization and Applications for Superhydrophobic
and Smart Surface Material
研 究 生:李昌謜
指導教授:張豐志 教授
新穎低表面能材料 Polybenzoxazine 高分子之應用及其運用
於能表面自清潔的超疏水材料之研究
A Novel Low Surface Free Energy Material Polybenzoxazine
Characterization and Applications for Superhydrophobic and Smart
Surface Material
研 究 生:李昌謜 Student:Chang-Yung Li
指導教授:張豐志 Advisor:Dr. Feng-Chih Chang
國 立 交 通 大 學
應 用 化 學 研 究 所
碩 士 論 文
A Thesis
Submitted to Institute of Applied Chemistry
College of Science
National Chiao Tung University
In partial Fulfillment of the Requirements
For the Degree of Master of Science
In Applied Chemistry
July 2009
Hsinchu, Taiwan, Republic of China
ACKNOWLEDGMENTS
The author wishes to express his deepest appreciation to his adviser,Dr. Feng-Chih Chang , and Dr. Chih-Feng Wang for their kindly guidance and patience throughout this research during the past two years. In addition, the thanks are also due to my classmates for their assistance to finish this research. Finally, I am thankful to my family for their support and understanding.
新穎低表面能材料 Polybenzoxazine 高分子之應用及其運用
於能表面自清潔的超疏水材料之研究
學生:李昌謜 指導教授:張豐志 教授
國立交通大學應用化學研究所
摘 要
在文獻中,我們得知降低高分子表面能的方法大多以加入含氟的
化合物或其官能基。而利用高分子的分子間作用力與分子內作用力來
改變表面能,此為一嶄新的方向,但相關探討仍屬少見。由於本實驗
室發現高分子
polybenzoxazine 具有非常低表面能之特性,此特性在高
分子中的化學性質與物理性質皆佔有相當重要的影響。
由於
polybenzoxazine 具有較鐵氟龍更低的表面能,是一個新穎的
疏水低表面能材料,除此之外,Polybenzoxazine 較一般常見的含氟低
表面能材料價格便宜且具有易於製程的優點。故本實驗為探討高分子
polybenzoxazine 表面能特性之應用,將以改變新的方法製備出以
polybenzoxazine 為主的超疏水表面。
本實驗則以
polybenzoxazine 為研究主體,研究內容分別為:
1. Polybenzoxazine 本身之低表面能特性研究
本研究室成功利用分子間與分子內作用力(氫鍵)來解釋高分子表
面能的變化。此一部分我們則就材料的表面能做學理的研究。
2. Polybenzoxazine 應用於能自清潔的超疏水表面(superhydrophobic
and smart surface)之製備與原理探討
超疏水的定義為:水在物體表面的接觸角 (contact angle) 必須大
於等於
150 度,且滾動角小於 10 度。物體表面具自清潔之功能是奈
米科技時代廣為討論的課題,進行表面處理使其具備超疏水特性是科
學家追求的目標。我們則利用噴砂的方法和加入光觸媒奈米粉體
(TiO
2)
,使鋁材表面同時具有微米與奈米等級的粗糙結構,並達到像
蓮花表面一樣的超疏水特性。我們亦運用最常拿來解釋超疏水現像的
兩個學說,來對超疏水特性作學理上的探討。
3.氫鍵和高分子間的分佈對材料表面能量之影響
我們用簡單的熱處理方法可以得到一系列擁有極低的表面能的共
聚物
poly(vinylphenol-co-methylmethacrylate)。 利用減少高分子間羟基
所產生分子間氫鍵作用力原理產生较低表面能的高分子共聚物。
經由
红外線分析指出在經過熱處理後,
PVPh 段的羟基其所產生的分子間氫
鍵轉換成自由羥基和羥基和羰基之間的分子內氫鍵,因而使得高分子
的 分 子 間 氫 鍵 變 小 。
另 外 , 我 們 也 發 現 共 聚 物
poly(vinylphenol-co-methylmethacrylate)氫鍵的強度不僅與高分子的分
怖有關且與在旋轉塗佈過程中溶液迅速蒸發速度有關。
A Novel Low Surface Free Energy Material
Polybenzoxazine Characterization and Applications for
Superhydrophobic and Smart Surface Material
Postgraduate Student: Chang-Yuang Li Adviser: Dr. Feng-Chih Chang
Department of Applied Chemistry
National Chiao Tung Universuty
Abstract
In literature, we learned that most researchers add fluorinated functional groups to a given polymer to reduce its surface energy. The change of the surface energy of the polymer is due to the intermolecular and intramolecular force between polymers. Nevertheless, only few studies are related to this research area. Recently, we found that polybenzoxazine has extreme low surface energy which has significant influence on the chemical and physical properties of a polymer. Therefore, studying polybenzoxazine will give us better understanding of the low surface energy property
.
Polybenzoxazine, due to its lower surface energy than Teflon, is a good alternative for superhydrophobic materials. Moreover, the cost and synthetic procedure of polybenzoxazine are less expensive and simpler than those of other fluorinated materials. In this research, I will study the low surface energy property and the application of polybenzoxazine. In addition, I will also develop new approach for
preparing polybenzoxazine for superhydrophobic materials.
:
The objectives of my research are as follows:
1
The study of low surface energy property of polybenzoxazine:Our lab has already explained the change of polymer surface energy by intermolecular and intramolucular hydrogen bonding. This objective will extend the explanation of this property
.
2
The study and new preparation method of polybenzoxazine for smart and superhydrophobic surface:The definition of “Superhydrophobic Surface” is the water contact angle and the rolling angle must be larger than 150° and smaller than 10°respectively. The self-cleaning of the surface of objects is a hot subject in nanotechnology. We will apply sandblasting to create topographical microstructure on the surface of aluminum material. The surface-modified aluminum material is then coated by TiO2 nanoparticles
and polybenzoxazine. The resulting composite will have superhydrophobic property like lotus flower surface. Two theories will be used to explain the superhydorphobic property of this novel composite.
3 Effect of Hydrogen Bonding and Sequence Distribution on Low-Surface-Energy Material of Poly (vinylphenol–co-methyl methacrylate)
A series of poly(vinylphenol-co-methylmethacrylate) (PVPh-co-PMMA) block and random copolymers possessing extremely low surface energy can be obtained after a simple thermal treatment procedure. PVPh-co-PMMA copolymers result in a lower surface energy because of the decrease of intermolecular hydrogen bonding between hydroxyl groups. Infrared analyses indicate that the intermolecular hydrogen bonding of PVPh segment decreases by converting the hydroxyl group into a free hydroxyl and
increasing intramolecular hydrogen bonding and intermolecular hydrogen bonding between hydroxyls and carbonyls after thermal treatment. In addition, we also found that the hydrogen-bonding strength of poly(vinylphenol-co-methylmethacrylate) copolymers not only depended on sequence distribution but also the solvent casting process because of the rapid solvent evaporation during the spin casting process.
Outline of Contents
Pages
Acknowledgments i
Abstract (in Chinese) ii
Abstract (in English) iv
Outline of Contents vi
List of Tables viii
List of Figures ix
Chapter 1 Introduction to Polybenzoxazines
1.1 Overview on Benzoxazines and Polybenzoxazines 1
1.2 Effect of Hydrogen Bonding on Low-Surface-Energy Material 6 References 8
Chapter 2 The Study of Theory
2.1 Surface Free Energy 11
2.1.1 Interfacial Thermodynamics 11
2.1.2 Contact Angle Equilibrium: Young Equation 13
2.1.3 Determination of Surface Free Energy 16
2.1.4 Surface Free Energy of Polymer 23
2.2 Superhydrophobic Surfaces 28
2.2.1 The Principle of Wetting 31
2.2.2 Natural Examples 34 2.2.3 Synthetic Substrates 39 2.2.4 Models 44 2.3 Photocatalytic Coatings 50 References 54 Chapter 3 Experimental 3.1 Part A 60 3.1.1 Materials 60
3.2 Part B 62
3.2.1 Materials 62
3.2.2 Photocatalytic Coatings on Superhydrophobic Surfaces 63 3.3 Part C
Preparation of PVPh/PMMA Random and Block Copolymers and Blends.
64
3.4 Experimental Equipments 65
3.4.1 Spin Coater 65
3.4.2 Sandblasting Machine 66
3.4.3 Contact Angle Measurement 66
3.4.4 Scanning Electron Microscopy (SEM) 67
3.4.5 Surface Roughness Determinations 67
3.4.6Nuclear Magnetic Resonance (NMR) 68
3.4.7Fourier Transform Infrared Spectroscopy (FTIR) 68
3.4.8Thermogravimetry Analysis (TGA) 68
3.4.9Atomic Force Microscopy (AFM) 68
References 69
Chapter 4 Results and Discussion
4.1 Composite Rough Surfaces 70
4.2 The Explanation of Superhydrophobic State by Wenzel,
s Model and Cassie-Baxter Model
72
4.3 Photocatalytic Coatings on Superhydrophobic Surfaces 75
4.4.2 The effect of hydrogen bonding and sequence distribution in PVPh/PMMA system 76 4. 4.3 Conclusions 81 References 82 Chapter 5 Conclusions 102 Introduction to Author 104
List of Tables
Table Page
1-1. Comparative polybenzoxazine properties of various high performance polymers
5
2-1. Numerical constant for molecular weight dependence of surface free energy.
24
2-2. Macleod’s exponent for some polymers 25
3-1. Formulations and thermal properties of PVPh-co-PMMA copolymers and corresponding Blends
65
4-1. Formulations and thermal properties of PVPh-co-PMMA copolymers and corresponding Blends
83
4-2. Root-mean-square surface roughness, advancing contact angle for water and diiodomethane, surface Free energy, and XPS Analysis of PVPh/PMMA Copolymers
84
4-3. Results of Curve-Fitting the Data for PVPh-co-PMMA and PVPh/PMMA
Blends with different process at Room temperature
List of Figures
Figure Page
2-1. Work of adhesion. 12
2-2. Work of cohesion. 12
2-3. Contact angle equilibrium on a smooth, homogeneous, planar, and rigid surface.
13
2-4. Advancing contact angle 14
2-5. Receding contact angle 15
2-6. Zisman plot foe poly(tetrafluoroethylene) (PTFE) using various testing liquids.
23
2-7. Linear additively of surface tension of random copolymers of ethylene oxide and propylene oxide, and surface-active behavior of blends of poly(ethylene oxide) (PEG 300) and poly(propylene oxide) (PPG 425).
27
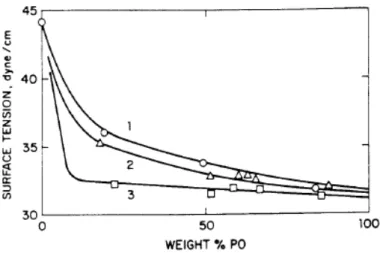
2-8. Surface tension versus composition for ABA block copolymers of ethylene oxide (A block) and propylene oxide (B block). Degree of polymerization are (1) DP = 16, (2) DP = 30, (3) DP = 56.
27
2-9. Surface tension of blends of compatible homopolymers. (1) poly(ethylene oxide) (PEG 300) + poly(propylene oxide) (PPG 425), (2) PPG 2025 + polyepichlorohydrin (PECH 1500), (3) PPG 400 + PECH 2000.
28
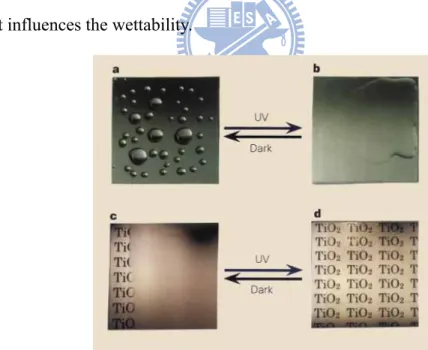
2-10. a, A hydrophobic surface before ultraviolet irradiation. b, A highly hydrophilic surface on ultraviolet irradiation. c, Exposure of a hydrophobic TiO2-coated glass to water vapour. The formation of
fog (small water droplets) hindered the view of the text on paper placed behind the glass. d, Creation by ultraviolet irradiation of an antifogging surface. The high hydrophilicity prevents the formation of water droplets, making the text clearly visible.
29
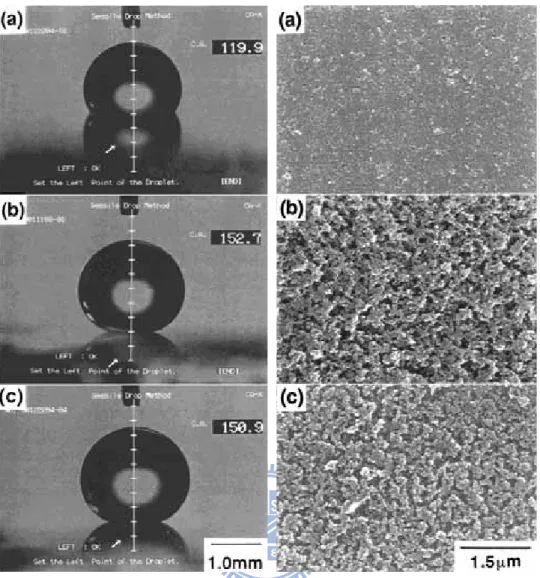
2-11. Shapes of water droplets and SEM micrographs of prepared films. a) Film prepared from a suspension containing only (AlOOH). b) Film prepared from a suspension containing (AlOOH) and (Al(C5H7O2)3). c) Film prepared from a suspension containing
silica and (Al(C5H7O2)3).
2-12. Liquid droplet on a solid. The liquid contacts the solid over a zone of size , and joins it at an angle l θ .
32
2-13. Displacing the contact line by a quantity dx (keeping the drop volume unchanged) modifies the surface area of each interface (solid/liquid, solid/vapor, liquid/vapor).
32
2-14. An almost ballshaped water droplet on a non-wettable plant leaf. 35 2-15. SEM picture of a super-hydrophobic plant (Colocasia esculenta).
The surface is structured at two levels: bumps at a scale of 20 µm and hairs at a scale of 1µm. These structures together with the wax which coats the leaf provide super-hydrophobicity.
35
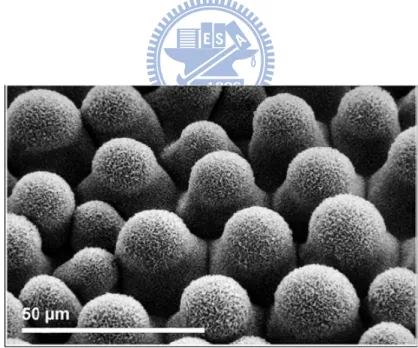
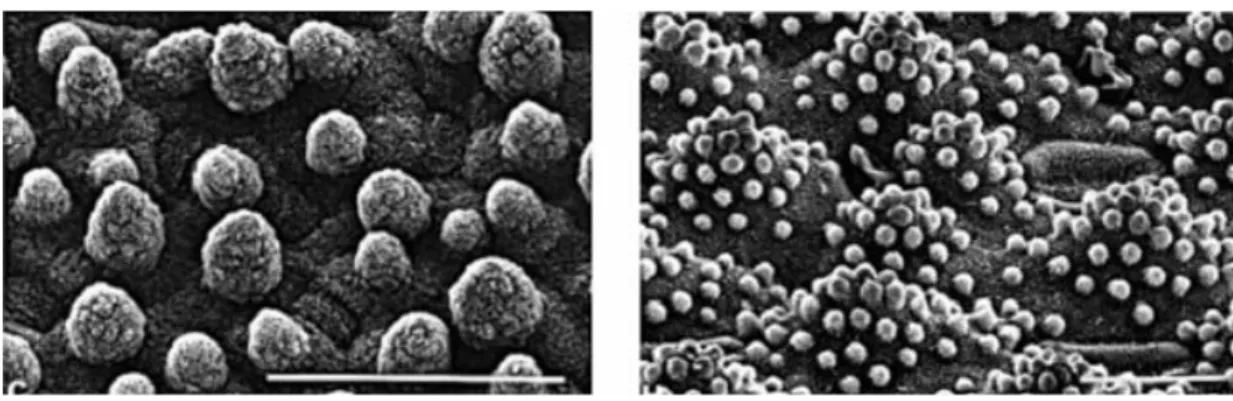
2-16. Nelumbo nucifera, left, scale bar =50 µm and Hygoryza aristata, right, scale bar= 20 µm, showing texture at different scales.
36
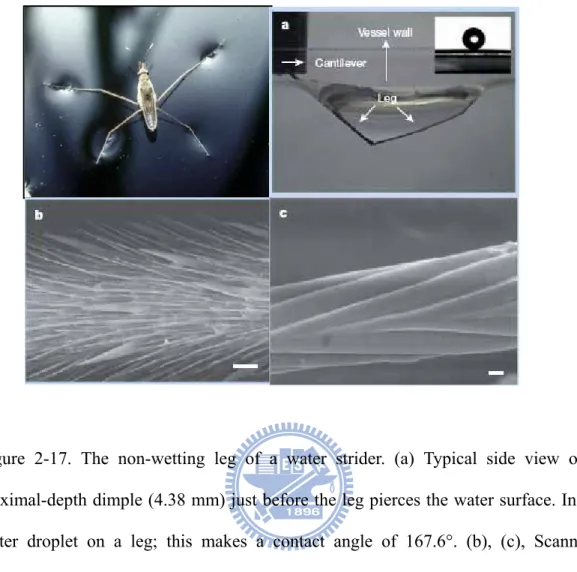
2-17. The non-wetting leg of a water strider. (a) Typical side view of a maximal-depth dimple (4.38 mm) just before the leg pierces the water surface. Inset, water droplet on a leg; this makes a contact angle of 167.6°. (b), (c), Scanning electron microscope images of a leg showing numerous oriented spindly microsetae (b) and the fine nanoscale grooved structures on a seta (c). Scale bars: b, 20 µm; c, 200 nm.
37
2-18. FE-SEM micrograph of the wing surface of Cicada orni with regularly aligned nanoposts.
37
2-19. The water-capturing surface of the fused overwings (elytra) of the desert beetle Stenocara sp. (a) Adult female, dorsal view; peaks and troughs are evident on the surface of the elytra. (b) A ‘bump’ on the elytra, stained with Red O for 15 min and then with 60% isopropanol for 10 min, a procedure that tests for waxes. Depressed areas of the otherwise black elytra are stained positively (waxy, coloured), whereas the peaks of the bumps remain unstained (wax-free; black). (c) Scanning electron micrograph of the textured surface of the depressed areas. Scale bars, (a) 10 mm; (b) 0.2 mm; (c) 10 µm.
38
(a) top view, (b) cross section. Water droplet on AKD surfaces: (c) fractal AKD surface; (d) flat AKD surface.
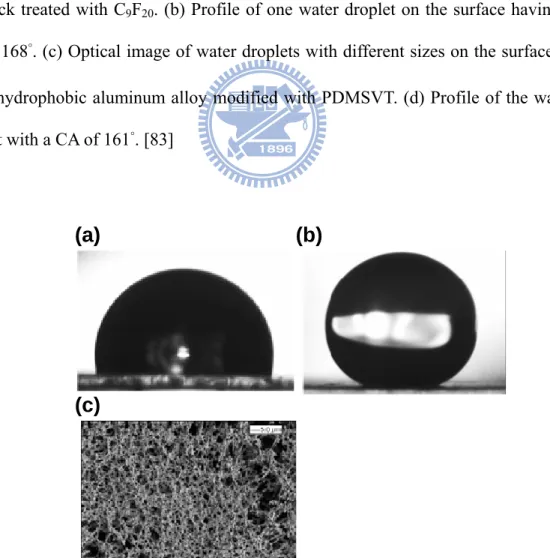
2-21. (a) Optical image of water droplets with different sizes on the surface of Al block treated with C9F20. (b) Profile of one water
droplet on the surface having a CA of 168°. (c) Optical image of water droplets with different sizes on the surface of super-hydrophobic aluminum alloy modified with PDMSVT. (d) Profile of the water droplet with a CA of 161°.
41
2-22. The profile of a water drop on (a) a smooth i-PP surface (CA = 104°), (b) a superhydrophobic i-PP coating on a glass slide (CA = 160°). (c) SEM picture of a superhydrophobic i-PP film.
41
2-23. (a) Illustration of the solvent effect on the morphologies of PP-PMMA copolymer surface. (b) The profile of a water drop on superhydrophobic polymer surface. (c) SEM images of superhydrophobic polymer. (d) Enlarged view of (c).
42
2-24. Left, a drop of water resting on a PTFE-coated carbon nanotube forest. Right, an electron micrograph of the same ultraphobic surface.
42
2-25. a) SEM image for the regular array of silicon microconvexes with PNIPAAm modification (left), compared with that of flat substrate (right). b) Magnified image of the microconvex array in the right of (a). c) Nanostructures on a single microconvex without PNIPAAm modification. d) Nanostructures on a single microconvex with PNIPAAm modification.
43
2-26. SEM images of (a) surface of the PAN nanofibers; (b) cross-sectional view of the as-synthesized PAN nanofibers. Shapes of water droplets on (c) the PAN nanofibers with a rough surface; (d) the native PAN film with smooth surface.
43
2-27. The Wenzel state: the liquid follows the solid surface. 45 2-28. The Cassie state, the liquid only contacts the top of the asperities,
leaving air below.
46
2-29. Millimetric water drops (of the same volume) deposited on a superhydrophobic substrate consisting of dilute pillars (f1 = 0.01).
(a) The right drop has been pressed, which induced a Wenzel state, characterized by a smaller angle (the roughness is very low, and equal to 1.1). The light passes below the left drop, indicating a Cassie state. (b) Ten minutes later, the drop volumes have decreased, owing to evaporation, and angles became receding ones. The difference of hysteresis between both states is clearly visible: the Wenzel drop even became hydrophilic
2-30. The two models of superhydrophobicity. For a moderate hydrophobicity(90<θ <θc, where θ is the contact angle on a flat surface, and θc is fixed by the texture design, as defined in the
text), the apparent contact angleθ * should be given by the Wenzel model (equation 2.32). If θ is larger than θ c, air remains trapped below the drop, which sits on a composite surface made of solid and air; f1 is the fraction of solid in contact
with the liquid (Cassie regime, equation 2.33). However it has often been reported that the Cassie regime can also be observed for θ <θ c, in spite of a higher energy.This metastable situation is represented by a dotted line.
49
2-31. Upon irradiation of TiO2 by ultra band gap light, the semi- conductor undergoes photo-excitation. The electron and the hole that result can follow one of several pathways: (a) electron–hole recombination on the surface; (b) electron–hole recombination in the bulk reaction of the semiconductor; (c) electron acceptor A is reduced by photogenerated electrons; and (d) electron donor D is oxidised by photogenerated holes.
52
3-1. Flow diagram of the processing of superhydrophobic films by sandblasting.
61
3-2. Flow diagram of the processing of superhydrophobic films with photocatalytic coatings
63
4-1. (a) Shape of a water drop (5 µL ) on the film of BA-a (left). The water contact angleθis 108 °. (b) Shape of a water drop (5 µL) on the surface of Al with nanoparticles (right). The water contact
angle θ is 160±3°
4-2. SEM images of BA-a + nanoparticle films on aluminum substrate (a) flate aluminum substrate without composite (b) sandblasting topographical microstructure on the surface of aluminum, and (c) sandblasting topographical microstructure of aluminum . Films were prepared from solutions having a 100/100 (BA-a/TiO2) ratio
having 5% BA-a concentration.
87
4-3. Nonlinear change of cosθ with mass percent of nanoparticles. The sharp change in contact angles occurs at different mass percentages, depending on the TiO2/BA-a ratio concentration of
the spin-coated solutions.
88
4-4. SEM image of the BA-a + nanoparticle film on rough aluminum surface, obtained from a solution having (a) a 5% BA-a concentration. (b) 100/20 (BA-a/TiO2) ratio with a 5% BA-a
concentration. (c) 100/40 (BA-a/TiO2) ratio with a 5% BA-a
concentration. (d) 100/60 (BA-a/TiO2) ratio with a 5% BA-a
concentration. (e) 100/80 (BA-a/TiO2) ratio with a 5% BA-a
concentration. (f) 100/100 (BA-a/TiO2) ratio with a 5% BA-a
concentration.
89
4-5. SEM pictures of (a) an area of 60μm ╳ 80μm for bare rough aluminum, (b) the rough substrate containing 100/100 (BA-a/TiO2) ratio having a 5% BA-a concentration and (c)
magnified view of (b)
90
4-6. advancing and receding of water drops placed on rough aluminum composite as functions of the roughness of the substrate.
91
4-7. CAH, △θ=θa —θr, as a function of microscale roughness of the substrate.
92
4-8. Time profiles of the photocatalytic degradation of dirt attached on the surface of BA-a composite obtained by monitoring the contact angle.
93
4-9. The mechanism of the self-cleaning and the recovery of super-hydrophobic properties on the TiO2/BA-a composite
surface.
4.10. The FTIR spectra of pure PVPh homopolymer (Mw = 9697) (a) solvent casting (b) spin coating (c) 180°C 24h thermal treatment
95
4.11. The FTIR spectra of samples having similar PVPh contents preparing by different coating process (a)、(b) solvent casting and (c)、(b) spin coating .
96
4.12. FTIR spectra of (a) 、 (b) PVPh/PMMA blends, (c) 、 (d) PVPh-b-PMMA copolymers and (e) 、 (f) PVPh-r-PMMA copolymers at room temperature
97
4.13. FTIR spectra of (a) 、 (b) PVPh/PMMA blends, (c) 、 (d) PVPh-b-PMMA copolymers and (e) 、 (f) PVPh-r-PMMA copolymers after the 180 °C thermal treatment procedure.
98
4.14. FTIR spectra of (a) PVPh/PMMA blends, (b) PVPh-b-PMMA copolymers and (c) PVPh-r-PMMA copolymers in 2800cm-1~3800cm-1
99
4.15. FTIR spectra of (a) PVPh/PMMA blends, (b) PVPh-b-PMMA copolymers and (c) PVPh-r-PMMA copolymers 1660cm-1~1800cm-1.
100
4.16. Surface energy of PVPh/PMMA random copolymers (▲), block copolymers (●) and their blends (■) (a) before (b) after the thermal treatment process.
Chapter 1
Introduction
1.1 Overview on Benzoxazines and Polybenzoxazines
A interesting addition-cure phenolic system is based on oxazine-modified phenolic resin that encounters a ring-opening polymerization to give polybenzoxazine, which is mainly a poly(amino-phenol). The benzoxazine monomers are formed from amines and phenol in the presence of formaldehyde, which were first synthesized by Holly and Cope [1]. These structures were not recognized as phenolic resin precursors until Schreiber [2] reported in 1973 that a hard and brittle phenolic material was formed from benzoxazine precursors, but no further details about structures and properties were included. In 1986, Riess et al. reported the synthesis and reactions of monofunctional benzoxazine compound. [3] The compounds that they obtained were oligomer phenolic structures because the thermo-dissociation of the monomer was always competing with the chain propagation. The bifunctional benzoxazine precursor synthesized by Ning and Ishida [4] overcame the low degree of crosslinking of above compounds. Furthermore, these samples possess high mechanical integrity and an be easily prepared from inexpensive raw materials.[5-7]
In phenolic chemistry, both the ortho- and para- position on the benzene ring are reactive toward electrophilic substitution reactions due to the directing effect of the hydroxyl group. Benzoxazines also show multiple reactivities of the benzene ring due to directing effect of both the alkoxyl and alkyl groups connected to the benzene ring as shown in Scheme 1-1. Benzoxazines can be polymerized without by using strong acid or basic catalyst, and produce no byproducts through the heterocyclic ring opening reaction. The free ortho- position on a benzene ring in the benzoxazine
system has high reactivity toward thermal and phenol-initiated ring-opening polymerizations and forms a phenolic Mannich base (-CH2-NR-CH2-) polymer
structure. In addition, the free para- position also shows reactivity toward a similar type of polymerization [3,8].
The ring-opening polymerization can also be catalyzed by acidic catalysts that permit a wide curing temperature. In the presence of acidic catalysts [9], the curing temperature can be reduced from 160-220 °C to about 130-170 °C and increase the application range. In recent years, thermosetting polybenzoxazines have attracted an intense amount of interest from both academia and industry because of their fascinating characteristics, such as high performance, low cost, and ease of processing.[10-13] OH CH3 H3C OH OH + 2 CH2O + H2N R1 + 4 CH2O + H2N R2 H3C CH3 N O N O O N R1 R2 R2 2 reflux reflux OH N R1 n CH3 H3C OH OH N N R2 R2 (A) (B) n m
Scheme 1-1. The synthese and thermal curing of (A) monofunctional benzoxazines and (B) difunctional benzoxazines
In addition to these advantageous features, which they share with traditional phenolic resins, the polybenzoxazines also possess unique properties, such as low degrees of water absorption [14,15] (despite the large number of hydroxyl groups present in their backbone structure), high moduli, [16] excellent resistance to chemicals [17] and UV light, [18] near-zero volumetric shrinkage/expansion upon polymerization, [19] and high glass transition temperatures, even at a relatively low cross-linking density. [20] The polybenzoxazines overcome several defects of traditional novolac and resole-type phenolic resins, while retaining their advantages. Polybenzoxazine resins are supposed to replace traditional phenolics, polyesters, vinyl esters, epoxies, cyanate esters and polyimides in many respects. [21] In addition, our lab discovered, to our surprise, that polybenzoxazines also can possess surface free energies even lower than that of pure poly(tetrafluoroethylene) (Teflon).The lowest surface free energies that we observed for the BA-a polybenzoxazine and BA-m polybenzoxazine systems were 19.2 and 16.4 mJ/m2, respectively. Both of these values are lower than that of pure Teflon (21 mJ/m2). [22] And the molecular structure of polybenzoxazine offers excellent design flexibility that allows properties of the cured material to be controlled for specific requirements of a wide variety of individual requirements. The resin allows development of new applications by utilizing some of their unique features such as [19, 20-23]:
◆ Near zero volumetric change upon polymerization ◆ No release of volatiles during curing
◆ Low melting viscosity (for benzoxazine) ◆ High glass transition temperature (Tg)
◆ High thermal stability (Td)
◆ Low water absorption ◆ Good mechanical properties ◆ Excellent electrical properties
Table 1-1 compares the properties of polybenzoxazine with those of the state-of the-art matrices. The relative benefits of polybenzoxazines are obvious.
Table 1-1 Comparative polybenzoxazine properties of various high performance polymers
Property Epoxy Phenolics Toughened BMI Bisox–phen (40:60) Cyanate ester P–T resin Polybenzoxazine
Density (g/cc) 1.2–1.25 1.24–1.32 1.2–1.3 1.3 1.1–1.35 1.25 1.19
Max use temperature (℃) 180 200 ~200 250 150–200 300–350 130–280
Tensile strength (MPa) 90–120 24–45 50–90 91 70–130 42 100–125
Tensile modulus (GPa) 3.1–3.8 03/05 3.5–4.5 4.6–5.1 3.1–3.4 4.1 3.8–4.5
Elongation (%) 3–4.3 0.3 3 1.8 02/04 2 2.3–2.9 Dielectric constant (1 MHz) 3.8–4.5 04/10 3.4–3.7 – 2.7–3.0 3.1 3–3.5 Cure temperature (℃) RT–180 150–190 220–300 175–225 180–250 177–316 160–220 Cure shrinkage (%) >3 0.002 0.007 <1 ~3 ~3 ~0 TGA onset (8C) 260–340 300–360 360–400 370–390 400–420 410–450 380–400 Tg (℃) 150–220 170 230–380 160–295 250–270 300–400 170–340 GIC (J/m2) 54–100 – 160–250 157–223 – – 168 KIC (MPa m1/2) 0.6 – 0.85 – – – 0
1.2 Effect of Hydrogen Bonding on Low-Surface-Energy Material
The performance of polymeric materials is often dictated by surface properties, such as wettability, friction, and adhesion. In particular, hydrophobicity and oleophobicity have attracted tremendous interest due to their wide range of applications [24-27]. Both poly(dimethylsiloxane) (PDMS) and poly(tetrafluoroethylene)
(PTFE) are two well-known examples possessing low surface energies. [28-31] PTFE
may be regarded as the benchmark lower surface energy material, displaying water repellency [32] in combination with other desirable properties. [33] The small size of the
fluorine atom with high electronegativity, low polarizability, and strong fluorine-fluorine repulsion [34] results in weak intermolecular forces of fluorinated
polymer chains and thus relatively lower surface energies. However, PTFE and many fluorinated polymers have some application limitations such as high cost and poor processibility. Many efforts have been attempted to search for low-surface-free-energy polymeric materials with low cost, easy processibility, and good film-forming characteristics. [35-37]
Hydrogen bonding plays an important role in determining the surface properties of polymers. In general, the amorphous comblike polymers possessing a flexible linear backbone on the side chain with low intermolecular interaction exhibit a low surface energy. [38] We have found that the intermolecular hydrogen bonding between
the hydroxyl groups increases their surface energies in the polybenzoxazine system[35].
Jiang et al[39] found that at temperatures above its lower critical solution temperature
(LCST), the compact, collapsed conformation of poly(N-isopropylacrylamide) (PNIPAAm), induced by intramolecular hydrogen bonding between the C=O and N-H groups of the main chains results in a low surface free energy and a high contact angle
for water. When the temperature is below the LCST, however, intermolecular hydrogen bonding between the PNIPAAm main chains and water molecules predominates leading to a higher surface free energy and a lower water contact angle. Similarly, Chung et al. [40] reported that the presence of amide groups in a
fluorinated-main-chain liquid-crystalline polymer system induces strong intermolecular hydrogen bonding resulting in higher surface free energies and higher degrees of hydrophilicity. The nature of the pendent chain has a most profound effect in determining the surface energy of the material; therefore, a low-surface-free-energy material can be obtained by decreasing the intermolecular interaction from the comblike polymer with a flexible linear backbone. [41] In our
previous study[42], we discovered that PVPh, a fluorine- and silicone-free polymer,
can possess an extremely low surface energy (15.7 mJ/m2) after a simple thermal treatment procedure which is even lower than that of PTFE (22.0 mJ/m2) calculated on the basis of the two-liquid geometric method. Besides, the sequence distribution of the vinyl phenol group in PVPh-co-PS copolymers plays an important role in dictating the final surface energy after thermal treatment. In this paper, we found that the PVPh-co-PMMA copolymers presents quiet different surface properties from PVPh-co-PS coplymers after thermal treatment. Furthermore, we discovered that the fraction of hydrogen bonding between vinylphenol groups and carbonyl groups not only depended on the sequence distribution of the vinylphenol group in PVPh-co-PMMA copolymers but also the casting process. The effects of molecule weight on surface free energy were also investigated carefully.
References
[1] F. W. Holly, A. C. Cope, J. Am. Chem. Soc. 1944, 66, 1875. [2] Scheriber, H. Ger, Offen. 2225504, 1973; Offen. 2323936, 1973.
[3] Riess, G.; Schwob, J. M.; Guth, G.; Roche, M.; Lande, B. in “Advances in Polymer Science” (Eds B. M. Culbertson and J. E. Mcgrath), Plenum, New York,
1986.
[4] Ning, X.; Ishida, H. J. Polym. Sci., Polym. Phys. Ed. 1994, 32, 921. [5] Ishida, H. J. Appl. Polym. Sci. 1995, 58, 1751.
[6] Burke, W. J.; Murdoch, K. C.; Ec, G. J. Am. Chem. Soc. 1954, 76, 1677. [7] Burke, W. J.; Glennie, E. L. M.; Weatherbee, C. J. Org. Chem.1964, 24, 909. [8] Shen, S. B.; Ishida, H. J. Appl. Polym. Sci .1996, 61, 1595.
[9] Dunkers, J.; Ishida, H. J. Polym. Sci. Part A: Polym. Chem. 1999, 37, 1913. [10] X. Ning,; H. Ishida, J. Polym. Sci., Part A: Polym. Chem. 1994, 32, 1121. [11] T. Takeichi, I. Komiya, Y. Takayama, Kyoka-Purasutikkus (in Japanese) 1997,
43, 109.
[12] Y. X. Wang, H. Ishida, Polymer 1999, 40, 4563. [13] J. A. Macko, H. Ishida, Polymer 2001, 42, 227.
[14] N. Furukawa, Benzoxazine-based thermosetting polymers and their manufacture,
compositions, and heat- and fire-resistant dielectric cured products with low water absorption. Jpn. Kokai Tokkyo Koho, 2004, p18.
[15] Y. X. Wang, H. Ishida, Polym. mater. sci. eng. 1999, 80, 211.
[16] H. Ishida, D. J. Allen, J. Polym. Sci., Part B: Polym. Phys. 1996, 34, 1019. [17] H. D. Kim, H. Ishida, J. Appl. Polym. Sci. 2001, 79, 1207.
[18] J. Macko, H. Ishida, J. Polym. Sci., Part B: Polym. Phys. 2000, 38, 2687. [19] H. Ishida, H. Y. Low, Macromolecules 1997, 30, 1099.
[20] H. Ishida, Y. Rodriguez, Polymer 1995, 36, 3151.
[21] Chih-Feng Wang, Yi-Che Su, Shiao-Wei Kuo, Chih-Feng Huang, Yuung-Ching Sheen and Feng-Chih Chang,Angew. Chem. Int. Ed. 2006, 45, 2248.
[22] C. P. R. Nair, Prog. Polym. Sci. 2004, 29, 401.
[23] T. Agag, T. Takeichi, Macromolecules 2001, 34, 7257.
[24] Li, H.; Wang, X.; Song, Y.; Liu, Y.; Li, Q.; Jiang, L.; Zhu, D. Angew. Chem. Int.,
Ed. 2001, 40, 1743.
[25] Aussillous, P.; Quere, D. Nature 2001, 411, 924.
[26] Shirtcliffe, N. J.; McHale, G.; Newton, M. I.; Perry, C. C. Langmuir 2005, 21, 937.
[27] Wang, S.; Feng, L.; Liu, H.; Sun, T.; Zhang, X.; Jiang, L.; Zhu, D.
ChemPhysChem 2005, 6, 1475.
[28] Coulson, S. R.; Woodward, I.; Badyal, J. P. S.; Brewer, S. A.; Willis, C. J. Phys.
Chem. B 2000, 104, 8836.
[29] Jin, M.; Feng, X.; Xi, J.; Zhai, J.; Cho, K.; Feng, L.; Jiang, L. Macromol. Rapid
Commun. 2005, 26, 1805.
[30] Feng, L.; Zhang, Z.; Mai, Z.; Ma, Y.; Liu, B.; Jiang, L.; Zhu, D. Angew. Chem., Int. Ed. 2004, 43, 2012.
[31] Hillborg, H.; Tomczak, N.; Olah, A.; Schonherr, H.; Vancso, G. J. Langmuir
2004, 20, 785.
[32] Wu, S. Polymer Interface and Adhesion; Marcel Dekker: New York, 1982. [33] Feiring, A. E.; Imbalzano, J. F.; Kerbow, D. L. Adv. Fluoroplast. Plast. Eng.
1994, 27.
[34] Carlson, D. P.; Schmiegel, W. Ullmann’s Encyclopedia of Industrial Chemistry; VCH Verlagsgesellschaft: Weinheim, Germany, 1988; p 393.
[35] Wang, C. F.; Su, Y. C.; Kuo, S. W.; Huang, C. F.; Sheen, Y. C.; Chang, F. C.
Angew. Chem., Int. Ed. 2006, 45, 2248
[36] Kobayashi, H.; Owen, M. J. Trends Polym. Sci. 1995, 3, 5.
[37] Schmidt, D. L.; Coburn, C. E.; DeKoven, B. M.; Potter, G. E.; Meyers, G. F.; Fischer, D. A. Nature 1994, 368, 41.
[38] Owen, M. J. Comments Inorg. Chem. 1988, 7, 195.
[39] Sun, T.; Wang, G.; Feng, L.; Liu, B.; Ma, Y.; Jiang, L.; Zhu, D. Angew. Chem.
Int. Ed. 2004, 43,357-360.
[40] Ma, K. X.; Chung, T. S. J. Phys. Chem. B 2001, 105, 4145-4150.
[41] Tsibouklis, J.; Graham, P.; Eaton, P. J.; Smith, J. R.; Nevell, T, G.; Smart, J. D.; Ewen, R. J. Macromolecules 2000, 33, 8460.
[42] Lin, H. C.; Wang, C. F.; Kuo, S. W.; Tung, P. H.; Huang, C. F.; Lin, C. H.; Chang, F. C. J. Phys. Chem. B 2007, 111, 3404.
Chapter 2
The Study of Theory
2.1 Surface Free Energy
As everyone knows , nanomaterial science and engineering already becomes world research focuses.While studying the surface characteristic of nanomaterial, it often involves this concept of the surface energy and contact angle. This section of articles are proving theory and researches of the surface free energy and contact angle .
2.1.1 Interfacial Thermodynamics
The interface (surface) is a region of finite thickness (usually less than 0.1 µm) in which the composition and energy very continuously from one bulk phase to other. The pressure (force field) in the interfacial zone is therefore nonhomogeneous, having a gradient perpendicular to the interfacial boundary. In contrast, the pressure in a bulk phase is homogeneous and isotropic. Consequently, no net energy is expended in reversibly transporting the matter within a bulk phase. However, a net energy is required to create an interface by transporting from the bulk phase to the interfacial zone. The reversible work require to create a unit surface area is the surface free energy, that is,
T, P, n G A γ = ⎜⎛∂ ⎞⎟ ∂ ⎝ ⎠ (2.1)
where γ is the surface free energy, G the Gibbs free energy of the total system, A the interfacial area, T the temperature, P the pressure, and n the total number of moles of matter in the system.
α and β form their equilibrium separation to infinity is the work of adhesion. a
W =Wαβ =γα +γβ −γαβ (2.2)
Where Wa is the work of adhesion, γα the surface free energy of phase α , γβ the surface free energy of phase β, and γαβ the interfacial energy between phase α and β (Figure 2-1). αβ
γ
γ
α βγ
aW
Figure 2-1. Work of adhesion.
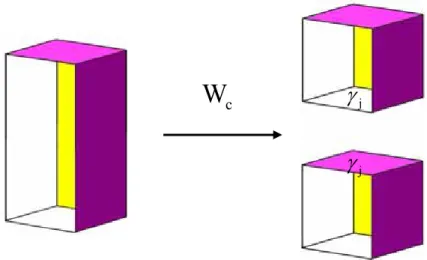
This was apparently first purpose by Dupré.[1] When the two phase are identical, the reversible work is the work of cohesion (Figure 2-2),
c jj j j
W =W = + − =γ γ 0 2γj
Figure 2-2. Work of cohesion.
(2.3)
where Wc is the work of cohesion for phase j.
c
W
γ
jj
The work of adhesion is the decreas of Gibbs free energy per unit area when an int
e
erface is formed from two individual surfaces. Thus, the greater the interfacial attraction, the greater the work of adhesion will be. Rearrangement of Eq. (2.1) gives
a W
αβ α β
γ =γ +γ indicating that the
be carrie
.1.2 Contact Angle Equilibrium: Young Equation
ontact angle (Figure 2-3). If the system
− (2.4)
greater the interfacial attraction, the smaller the interfacial energy will be. The works of adhesion can be related to the cohesion theoretically. Thereby, the interfacial energy can be linked to the properties of the two individual phases.
Thermodynamic discussions of adhesion in solid-liquid systems should d out in terms of surface free energy rather than surface tension. Discussions that involve the shape of liquid-gas or liquid-liquid interfaces can be carried out either in terms of surface tension or surface free energy.
2
A liquid in contact with a solid will exhibit a c
is at rest, a static contact angle is obtained. If the system is in motion, a dynamic contact angle is obtained. Here, static contact angles are discussed. A system at rest may be in stable equilibrium (the lowest energy state), or in meta stable equilibrium ( an energy through separated from neighboring states by energy barriers).
Saturated Vapor
θ LVγ
SVγ
SLγ
Liquid
Solid
Figure 2-3. Contact h, homogeneous, planar, and rigid surface
Stable equilibrium will be obtained if the solid surface is ideally smooth, homogeneous, planar, and nondeformable; the angle formed is the equilibrium contact angle,
angle equilibrium on a smoot
θ .
On the other hand, if the solid surface is rough or compositionally heterogeneous, the system may reside in one of many stable states; the angle formed
a metastable contact angle. The amount of mechanical energy in the liquid drop (such
(s h as vibration), and how the angle is formed ( whether by advancing or recedi
is
as vibrational energy) determines which metastable state is to be occupied. Therefore, metastable contact angle vary with drop volume, external mechanical energy uc
ng the liquid front on the solid). The stable equilibrium contact angle may sometimes (but rarely) be observed on a rough or heterogeneous surface. This equilibrium angle corresponds to the lowest energy state.
The angle formed by advancing the liquid front on the solid is termed
advancing contact angle, θa (Figure 2-4). The angle formed by receding the liquid front on the solid is termed receding contact angle, θr (Figure 2-5).
Figure 2-4. Advancing contact angle
Figure 2-5. Receding contact angle
dvancing contact angle are usually greater than receding contact angle when the sy em is in a metastable state. On the other hand, the advancing and the receding angles are identical when equilibrium angles are formed. Many real surfaces are rough or heterogeneous. Thus, variable contact angles are often observed. This has
previously led to concern as quality. The origin of
variable contact angle has now been clearly established and the thermodynamic status of con
A st
to whether is a true thermodynamic
tact angle ascertained.
The equilibrium contact angle (abbreviated θ here) for liquid drop on an ideally smooth, homogeneous, planar, and nondeformable surface (Figure 2-3) is related to the various interfacial tension by
LVcos SV SL
γ θ γ= −γ (2.5)
where γLV is the surface tension of the liquid in equilibrium with its saturated vapor, SV
γ the surface free energy of the solid in equilibrium with the saturated vapor of the liquid, and γSL the interfacial tension between the solid and the liquid. This is known as the Young equation. Young [2] described the relation in words, and did not attempt to prove it. Several proofs were offered later by others. [3-5]
Many real sur ma
metastable equilib
barriers). The equilibrium contact angle
faces are rough or heterogeneous. A liquid drop resting on such a surface y reside in the stable equilibrium (the lowest energy state), or in a
rium (energy trough separated from neighboring states by energy
e
θ corresponds to the lowest energy state for a system. On an ideally smooth and compositionally homogeneous surface, the
equilibrium contact angle is the Young’s angle θY, which is also the microscopic local contact angle on any rough or heterogeneous surface, hence also known as the intrinsic contact angle θ0. The fact that θ0 equals θY has been proved theoretically as the condition for minimization of system free energy.
The equilibrium contact angle on rough surface is Wenzel’s angle a θW. The equilibrium contact angle on a heterogeneous surface is Cassie’s angle θC. These angles correspond to the lowest energy sta but are often not observed experimentally. Instead, the system often resides in a metastable state, exhibiting a metastable contact ang . In this case, advancing and receding angles are different,
known as hysteresis (H). The different a r
te,
le
θ θ− is the extent of hysteresis.
The surface free energy of a solid polymer cannot be measured directly, as reversible formation of its surface is difficult. Many indirect method have been proposed, including the polymer melt (temperature dependence) method, Good–Girifalco Method, Owens, Wendt, and Kaelble’s Method (Two-Liquid Geometric Method), Wu’s Method (Two-Liquid Harmonic Method), Lifshitz–van der Waals Acid-Base Theory (Three-Liquid Acid-Base Method), critical surface tension and others.
Good–Girifalco Method
Good and Girifalco in the 1950s proposed the following equation to describe the surface energy of interfacial phase systems: [6-8]
1/ 2
2 ( )
ab a b a b
γ =γ +γ − Φ γ γ (2.6)
The subscripts a and b refer to the two phases, which may be liquid or solid. is a onstant between interfaces of a system and is defined as:
Φ c 1/ 2 ) c c a∆Fb where a ab F
∆ = the free energy of adhesion for the inte (
ab F
− = Φ
∆ (2.7)
rface between phases A and B,
per cm a F ∆ 2, ab a b γ γ γ = − − and c n F
∆ = free energy of cohesion for phase N 2= γn.
Equation (2.6) can be rewritten as the well known Good and Girifalco equation
1/ 2 2 ( ) γ =γ +γ − Φ γ γ : (2.9) Combined eq γ + θ = Φ γ γ (2.10) Or SL S LV S LV
uations 2.5 and 2.9 yield:
1/ 2 (1 cos ) 2 ( ) LV S LV 2 2 4 LV S (1 cos ) γ + θ 11)
Suppose the value of is γ =
Φ (2.
Φ known for a pair of the testing solid and liquid, γS can
be ca ith eq. (2.11). In the zeroth order
approximation, Good and Gi
lculated from contact angle data w
rifalco suggested that Φ was equal to unity.
Fowkes’ Method
Fowkes [9,10] proposed that “the surface tensions are a measure of the attractive forces between surface layers and liquid phase, and that such forces and
their contribution to the free energy are additive.” He designated, in the case of the surface tension of water, the surface tension c ld be considered thou e sum of
ontributions from dispersion forces (γd) and dipole interactions, mainly hydrogen
c bonds (γh): 2 2 2 d h H O H O H O γ γ γ (2.12) contribution to su = +
where superscript h refers to hydrogen bonding, and d to dispersion. In addition, at the interface between a liquid and solid, as Fowkes pointed out, the interfacial molecules are attracted by the bulk liquid from one side and from the other side by the intermolecular forces between the two phases. Fowkes defined the dispersion force
rface tension of the solid in terms of the interaction with the dispersion forces
Strictly speaking, eq. (2.14) provides a method to estimate the value of of the liquid. As a result, the Young–Good–Girifalco equation can be modified as:
1/ 2 2( d d )
SL S LV S LV
γ =γ +γ − γ γ (2.13)
Combine eqs. (2.5) and (2.13) results in:
1/ 2 (1 cos ) 2( d d ) γ + θ = γ γ (2.14) d LV S LV , S γ but not total γS, from a single contact angle measurement, where only dispersion forces operate in the liquid, such as a hydrocarbon liquid. The γSd of any solid can be
determined using a “dispersion force only” liquid.
Owens, Wendt, and Kaelble’s Method (Two-Liquid Geometric Method)
Owens and Wendt [11] and Kaelble [12] extended Fowkes’ equation to a more general form:
1/ 2 1/ 2 2( d d ) 2( p p ) SL S LV S LV S LV γ =γ +γ − γ γ − γ γ (2.15) ) LV S LV S LV (2.16) where superscrip
polar (nondispersion) component, including all the interactions established between the solid and liquid, such as dipole–
onding, etc.
Combine eqs. (2.5) and (2.15) yield:
1/ 2
(1 cos ) 2( d d ) 2( p p
γ + θ = γ γ + γ γ 1/ 2
t d refers to a dispersion (nonpolar) component, and p refers to a
dipole, dipole-induced dipole and hydrogen b
Since γS is the sum of surface tension components contributed from dispersion and polar parts:
S
d p
S S
γ =γ +γ (2.17)
d
Equations (2.15) and (2.16) provide a method to estimate surface tension of solids.
Using two liquids with known and p L
γ γL for contact angle measurements, one
could easily determine d p
S
γ and γS by solving the following two equations:
1 2( ) d d p p S LV γ + θ = γ γ + γ γ (1 cos d d p p LV γ + 1/ 2 1/ 2 1(1 cos ) 2(1 1) LV S LV 1/ 2 1/ 2 2 θ2) 2(= γ γS LV2) +2(γ γS LV2) (2.18) The values of d L γ and p L
γ of reference liquids have been provided by Kaelble.
Wu’s Method
(Two-Liquid Harmonic Method)
This method uses the contact angles
harmo n. ult
olymer melt method, and the equation of state method.
of two testing liquids and the nic-mean equatio The res agree remarkable well with the liquid homolog method, p
Based on “harmonic” mean and force addition, Wu proposed the following ] equations: [13,14 4 d d 4 p p S LV S LV SL S LV d d p p γ γ γ γ γ γ γ S LV S LV γ +γ γ +γ
Equation (2.19) can be written as follows with the aid of eq. (2.5):
(2.19) = + − − 4 4 (1 cos ) d d p p S LV S LV LV d d p p γ γ γ γ γ θ S LV S LV γ +γ γ +γ (2.20)
Equations (2.19) and (2.20) provide a method to estimate surface tension of
solids. Using two liquids with known
+ = +
d L
γ and p L
γ for contact angle measurements, one could easily determine d
S
γ and p S
γ by solving the following two equations:
1 1 1 1 1 4γ γd d 4γ γp p (1 cos ) S LV S LV LV d d p p S LV S LV γ θ γ γ γ γ + = + + + 2 2 2 2 2 d d p p S LV S LV 4 4 (1 cos ) d d p p S LV S LV LV γ γ γ γ γ θ γ γ + = + (2.21)
Lifshitz–van der Waals Acid-Base Theory (Three-Liquid Acid-Base Method)
Van Oss et al. has proposed a methodology that represents both Fowk
lar,” the later cannot be represented by a
single parameter such as
γ γ
+ +
Wu [13] claimed that this method applied accurately between polymers and between a polymer and an ordinary liquid.
es–Owens–Wendt–Kaelble and Wu. This methodology introduces a new meaning of the concepts, “apolar” and “po
p
γ .
As shown in eq. (2.22), surface tension γ could be divided into an apolar ng component or (more generally) acidbase component and a hydrogen bondi
interaction. One may follow Fowkes’ approach [15,16] and separate surface energy into several components as:
d dip ind h ...
γ γ= +γ +γ +γ + (2.22)
d AB
γ γ +γ (2.23)
where the superscripts, d, dip, ind, and h refer to (London) dispersion, (Keesom) dipole– dipole, (Debye) induction, and hydrogen bonding forces, respectively. And the superscript AB refers to t
=
he acid-base interaction. By regrouping com
surface ener
ponents in eq. 2–22, van Oss and Good expressed the gy as:
LW AB
γ γ= +γ (2.24)
LW d dip ind
γ =γ +γ +γ (2.25)
where LW stands for Lifshitz–van der Waals. Because a hydrogen bond is a proton
rogen, a hydrogen bonding is an example of Lewis acid (electron acceptor) and
hydrogen bonding as
-sharing interaction between an electronegative molecule or group and an electropositive hyd
Lewis base (electron donor). Van Oss et al., [17-23] therefore, treated Lewis acid-base interactions. In addition, van Oss et al. [17- 19] created two parameters to describe the strength of Lewis acid and base interactions:
+
γ = Lewis acid parameter of the surface free energy γ− = Lewis base parameter of the surface free energy
AB 2
γ γ γ+ −
its
= (2.26)
Based on these definitions, a material is classified as a bipolar substance if both +
γ and its γ− are greater than 0 (γAB ≠ 0). In other words, it has both nonvanishing γ+ and γ−. A monopolar material is one having either an acid or a base characters, which means either γ+= 0 and γ− > 0 or γ+ > 0 and γ−= 0. An
apolar material is neither an acid nor a base (both its γ+ and its γ− are 0). For both monopolar and apolar materials, their γAB= 0. Therefore, according to the Fowkes notation, the criterion for a substance to be apolar, is, γAB= 0. This is not true in the van Oss and Good’s met dology.
How do we calculate these surface energy parameters? van Oss, Good, and their coworkers, have developed a “three-liquid procedure” (Equation rmine
S
ho
2.27) to dete γ by using contact angles techniques and a traditional matrix scheme.
1(1 cos ) 2(1 1 1 1) LV S LV S LV S LV γ + θ = γ γLW LW + γ γ+ − + γ γ− + 2(1 cos ) 2(2 2 LW LW LV S LV S γ + θ = γ γ + γ γLV2 γ γS LV2) + − + − + 3(1 3 3 3 3 LV S LV S LV S LV γ
In short, to determine the components of
cos ) 2(θ γ γLW LW γ γ+ − γ γ− + )
+ = + + (2.27)
S
γ of a polymer solid, it was recommended [24,25] to select three or more liquids f om the reference liquids table,
with two of them being polar, the othe . Moreover, the polar
pairs—water and ethylene glycol, and water and form ide— were recommended to give good results, while aploar liquids are either diiodomethane or
a-bromonaphthalene. Because the LW, Lewi ewis base parameters of
r
r one being apolar am
s acid, and L
1
LV
γ , γLV2, and γLV3 areavailable, one can determine the LW, Lewis acid, and base parameters of γS by solving these three equations simultaneously.
Critical Surface Tension – Zisman plot
The concept of critical surface tension was first proposed by Fox and Zisman
[26-28]. An empirical rectilinear relation was found between cosθ and γLV for a series of testing liquid on a given solid. When homogeneous liquids are used as the
testing liquids, a straight line is often obtained. When nonhomologous liquids are used, however, the data are often scattered within a rectilinear band or give a curved line.
The intercept of the line at cosθ = 1 is the critical surface tension γc. When a
band is obtained, the intercept of lower line of the band is defined as the critical
surface tension. The cosθ versus γLV plot is known as the Zisman plot. The
example is given in Figure 2-6.
Figure 2-6. Zisman plot for poly(tetrafluoroethylene) (PTFE) using various testing liquids.
2.1.4 Surface Free Energy of Polymer
gy of homologous series tends to increase, while the with increasing molecular weight. At infinite
Molecular-Weight Dependence
The surface free ener
molecular weight, both the surface free energy and the surface entropy are, however,
The surface free energy of homologous series varies linearly with Mn -2/3,
finite. [29,30] 2 / 3 e n k M − (2.28) where γ γ= ∞
γ∞ is the surface free energy at infinite molecular weight and k is a e
constant. This equation fits the data for n-alkanes with standard deviations in γ about
anes, and polystyrenes with standard deviations in
0.05 dyne/cm, and for prefluoroalkanes, polyisobutylenes,
polydimethylsilox γ about 0.2
dyne/cm (Table 2-1).
Table 2-1. Numerical constant for molecular weight dependence of surface free energy.
polymer Temp. ℃ γ∞ dyne/cm k e σ
a n-alkanes 20 37.81 385.9 0.03 Polyisobutylenes 24 35.62 382.7 0.34 Polydimethylsiloxanes 20 21.26 166.1 0.09 refluoroalkanes 20 25.85 682.8 0.30 ylene oxide)- dimethyl ether 24 44.35 342.8 0.44 P Polystyrenes 176 29.97 372.7 0.08 Poly(eth
aσ is the standard deviations in γ
The surface free e variation ses with increasing molecular weight.
Table 2-1 indicate tha
nergy decrea
The k values ine t γ will be smaller than γ∞ by less than 1
the surface free energy 11,000-120,000
of poly(viny te) melts having molecular weight are found to be practically independent of molecular weight. [31]
hase Transitions
At the crystal-melt transition, the surface free energy of crystalline phase l aceta
Effects of P
c
γ is related to that of the amorphous phase γa by [32]
n c ρc a a γ γ ρ = ⎜ ⎟ ⎝ ⎠ (2.29) ⎛ ⎞
where ρc is the crystalline density, ρa the amorphous density, and n the Macleod’s exponent (Table 2-2).
Table 2-2. Macleod’s exponent for some polymers
’s exponent polymer Macleod Polychloroprene 4.2 Poly(methyl m Poly(n-butyl methacrylate) 4.2 3.2 oly(ethylene oxide) 3.0 Polybutylene 4.1 ene, linear ched ethacrylate) 4.2 Polystyrene 4.4 Poly(vinyl acetate) P Polypropylene 3.2 Polyethyl 3.2 Polyethylene, bran 3.3 polydimethylsiloxane 3.5
Thus, at the crystal-melt transition, the surface free energy changes
the density is discon us. As
discontinuously, since tinuo ρc is usually greater than ρa,
a
γ = 35.7 dyne/cm, and ρa
instance, polyethylene has n = 3.2, = 0.855 g/ml at 20
ty γc
℃. The crystalline densi ρc is 1.000 g/ml. Thus is calculated by eq. (2.29) to
ch compares rather with an experimental value of 53.6 dyne/cm. [33]
Semicrystalline polymers tend to be covered with an amorphous surface layer. As the amorphous phase has lower surface free energy, it tends to migrate to the
ust as in small-molecule liquids, as this will lower the free energy of the sy
e surface free energy of a random copolymer usually follows the linear relation [34]
be 58.9 dyne/cm, whi well
surface.
Copolymers and Blends
Low-energy components in copolymers or blends tend to preferentially adsorb on the surface, j stem. Random Copolymers Th 1 1 2 2 x x γ = γ + γ (2.30)
where γ is the surface free energy and x is the mole fraction. The subscripts 1 and 2 refer to the components 1 and 2, respectively. Such behavior is shown for random copolymers of ethylene oxide and propylene oxide in Figure 2-7.
Block
er, block and graft copolymers show considerable surface activity of the lower energy
y
molecule. For instance, pronounced surface activity is observed for ABA block
and Graft Copolymers
Howev
component, when the lower-energy blocks or grafts are sufficient long that the can accumulate and orient on the surfaces independently of the rest of the
Figure 2-7. Linear additively of surface tension of random copolymers of ethylene oxide and propylene oxide, and surface-active behavior of blends of poly(ethylene oxide) (PEG 300) and poly(propylene oxide) (PPG 425). [34]
copolymers of ethylene oxide (A block, higher surface free energy) and propylene oxide (B block, lower surface free energy) (Figure 2-8). [34]
Figure 2-8. Surface tension versus composition for ABA block copolymers of ethylene oxide (A block) and propylene oxide (B block). Degree of polymerization are (1) DP = 16, (2) DP = 30, (3) DP = 56. [34]
Blends of Polymers
Blends of both compatible and incompatible polymers show pronounced surface activity, incompatible blends being more pronounced than compatible blends. The surface activity of an incompatible blends is further complicated by heterogeneous phase structure.
Surface activity of compatible blend of poly(ethylene oxide) and poly(propylene oxide) is shown in Figure 2-9. [34] The surface activity increases with increasing molecular weight, apparently because of increased in compatibility.
Figure 2-9. Surface tension of blends of compatible homopolymers. (1) poly(ethylene oxide) (PEG 300) + poly(propylene oxide) (PPG 425), (2) PPG 2025 + polyepichlorohydrin (PECH 1500), (3) PPG 400 + PECH 2000. [34]
2.2 Superhydrophobic Surfaces
Wettability is a fundamental property of a solid surface, which plays important roles in daily life, industry, and agriculture. Functional surfaces with special
wettability have aroused much interest because of their great advantages in applications. For example, the superhydrophilic surface (Figure 2-10) [35] with a water contact angle (CA) of almost 0° generated by UV irradiation has been uccessfully used as a transparent coating with antifogging and self-cleaning roperties. On the other hand, various phenomena, such as contamination, snow ticking, erosion, and even current conduction are expected to be inhibited on with a CA larger than 150° and a sliding angle (SA) less t
s p s
superhydrophobic surfaces [36-39]
han 10°. [40] The chemical compositions [41,42] determine the surface free energy and thus have great influence on wettability. However, it has certain limitation. For example, the -CF3 terminated surface was reported to possess the lowest free
energy and the best hydrophobicity, while on flat surfaces, the maximum CA could only reach about 120°. [43] The surface topographic structure is also an important factor that influences the wettability.
Figure 2-10 a, A hydrophobic surface before ultraviolet irradiation. b, A highly hydrophilic surface on ultraviolet irradiation. c, Exposure of a hydrophobic TiO2-coated glass to water vapour. The formation of fog (small water droplets) hindered the view of the text on paper placed behind the glass. d, Creation by ultraviolet irradiation of an antifogging surface. The high hydrophilicity prevents the
formation of water droplets, making the text clearly visible.
Conventionally, superhydrophobic surfaces have been produced mainly in two ways. One is to create a rough structure on a hydrophobic surface (CA > 90°), and the other is to modify a rough surface by materials with low surface energy. Up to now, many methods have been developed to produce rough surfaces, including solidification of melted alkylketene dimmer (AKD, akind of wax), [44] plasma polymerization/etching of polypropylene (PP) in presence of polytetrafluoroethylene
(FAS) is often necessary. [46-50] While the water CA has commonly been used as a criterion for the evaluation of hydrophobicity of
(PTFE), [36] microwave plasma-enhanced chemical vapor deposition (MWPE-CVD) of trimethylmethoxysilane (TMMOS), [45] anodic oxidization of aluminum, [46] immersion of porous alumina gel films in boiling water, [47] mixing of a sublimation material with silica or boehmite, (Figure 2-11) [48] phase separation, [49] and molding [50] To obtain superhydrophobic surfaces, coating with low-surface-free-energy materials such as fluoroalkylsilane
a solid surface, this alone is insufficient to assess the sliding properties of water droplets on the surface. [51] A fully superhydrophobic surface should exhibit both high CA and low sliding angle, where sliding angle can also be expressed as the difference between advancing and receding contact angle (hysteresis).
Figure 2-11 Shapes of water droplets and SEM micrographs of prepared films. a) Film prepared from a suspension containing only (AlOOH). b) Film prepared from a suspension containing (AlOOH) and (Al(C5H7O2)3). c) Film prepared from a
suspension containing silica and (Al(C5H7O2)3)..
.
2.2.1 The Principle of Wetting Young’s Relation
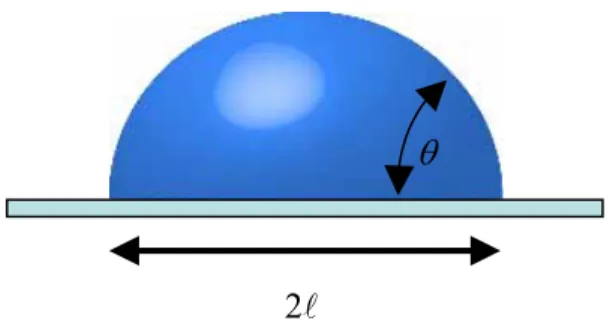
Let us start with the academic case of a drop deposited on an ideal (i.e. homogeneous) solid (Figure 2-12). The drop contacts its substrate on a disc of radius
l , whose border is a line (the so-called contact line) where the three phases of the system coexist. Close to this line, and whatever the size of the drop, we can observe
that the liquid joins the solid at an angle θ , whose value defines the size, , of the ntact.
!l
co
θ
Figure 2-12. Liquid droplet on a solid. The liquid contacts the solid over a zone of size l , and joins it at an angle θ .
The value of the contact angle was t discussed by Young. [2] Each interface raws the contact line so as to minimize the corresponding surface area, so that
balancing the surface ten tion (i.e. the horizontal)
yields a relation attribu t explicitly show up in
Young’s paper):
firs 2l
d
sions on the direction of potential mo ted to Young (although it does no
LVcos SV SL
γ θ γ= −γ (2.5)
tion dx of the contact line (Figure 2-13).
Figure 2
id/vapor, Equation (2.5) can alternatively be derived by calculating the variation of surface energy associated with a mo
θ
dx
-13. Displacing the contact line by a quantity dx (keeping the drop volume unchanged) modifies the surface area of each interface (solid/liquid, sol
liquid/vapor). We find
dE (γSL γSV)dx+γdxcosθ
E is minimum, which indeed yields equation (2.5).
= − (2.31)
At equilibrium,
From Complete Wetting to Complete Drying
equation (2.5). Two limits are particularly interesting:
(a) If (
Depending on the values of the different surface tensions (which are typically in the range of 20 to 500 mNm−1 for pure liquids or solids), an angle may or may not be deduced from
SV−γSL) is larger than
γ γLV
nsidered
, the drop tends to spread completely on the
solid, and the contact angle is co as null (θ = 0°). As first identified by Marangoni, this condition (which can also be written γSV >γSL+γLV ) indicates that the solid lowers its (surface) energy by being wetted. [52] Complete wetting happens for solids of high surface energy, such as glass or noble metals—but such solids often get polluted by aerosols (which wet them), so that their actual surface energy often decreases with time (and at the same time, these solids lose their ideality). This is the case with glass, which is wetted by water when it comes fresh out of a factory, but only shows partial wetting later, in most cases. Cleaning the glass very efficiently (with a strong acid) allows it to recover (transiently) a complete hydrophilicity. Complete wetting will also be observed with liquids of low surface tension (γLV γSV), such as light alkanes or silicone oils, which wet completely glass, steel and most plastics. Surfactants, which lower the liquid/vapor surface tension, are often added to a paint to increase its wettability, in order to make the film of paint stable.
A drop deposited on a solid that it wets completely will spread spontaneously, and the question of the final contact (i.e. the size ) it develops with its substrate has l