Displacement Reaction in Pulse Current Deposition of PtRu
for Methanol Electro-Oxidation
Yu-Chi Hsieh,
*
Pu-Wei Wu,**
,zYung-Jean Lu, and Yun-Min Chang*
Department of Materials Science and Engineering, National Chiao Tung University, Hsin-chu 300, Taiwan
Galvanostatic depositions in rectangular pulses and nitrosol precursors were employed to prepare PtRu nanoparticles on carbon clothes in various sizes and compositions. Variables including current on-time共Ton兲, current off-time 共Toff兲, and current density were explored to identify the optimized catalytic performances for methanol electro-oxidation. Electrochemical characterizations including cyclic voltammetry and hydrogen desorption were carried out. Images from a transmission electron microscope on the PtRu nanoparticles revealed a moderate size distribution. Signals from X-ray patterns indicated a slight shift of diffraction peaks, suggesting that the Ru was alloyed successfully in the Pt lattice. In addition, the amount of alloyed Ru was found to decrease with reduced duty cycles. Composition determinations from inductively coupled plasma mass spectrometry and analysis on the oxida-tion states from X-ray photoelectron spectroscopy suggested a displacement reacoxida-tion in which the Ru was alternately deposited and dissolved during Tonand Toff, while the Pt was deposited continuously. As a result, we observed substantial enrichment of Pt
in the PtRu nanoparticles when the duty cycle was shortened.
© 2009 The Electrochemical Society. 关DOI: 10.1149/1.3116187兴 All rights reserved.
Manuscript submitted November 3, 2008; revised manuscript received January 22, 2009. Published April 16, 2009.
Development of clean and affordable energy has attracted con-siderable attention due to rising concerns over oil price and harmful CO2emission. Among the possible systems under study, the direct
methanol fuel cell 共DMFC兲 is recognized as a promising power source for applications in portable electronics and transportations.1,2 Because electro-oxidation of methanol is intrinsically slow, many materials have been investigated as electrocatalysts at the anode. They include alloys in binary, tertiary, and quaternary compositions such as PtRu, PtCo, PtRuCo, and PtRuNiZr.3-7So far, the PtRu has appeared as the leading candidate with superb electrocatalytic per-formance. It is because by alloying with Ru, the undesirable Pt poisoning by CO could be largely reduced. Mechanisms including bifunctional effect and ligand model are proposed to explain the contributory role of Ru while alloying with Pt.8,9 Moreover, the catalytic behaviors of PtRu depend greatly on its surface composi-tion. For example, Richarz et al. prepared the PtxRu1−xin various
compositions and determined the Pt0.5Ru0.5 to possess the highest activity for methanol electro-oxidation.10
In practice, the PtRu is impregnated on appropriate carbon sup-ports for an extended reaction interface. Conventional synthetic ap-proaches for the PtRu-catalyzed electrodes entail techniques in chemical reduction and hydrogen annealing.11,12These methods add substantial difficulties in controlling the locations and compositions of the resulting PtRu nanoparticles. In contrast, approaches involv-ing electrochemical reductions are rather straightforward. Because the growths of PtRu nanoparticles are occurring selectively at the interface between electrode and electrolyte, the electrodeposition routes are recognized to produce electrodes with exceptional effi-ciencies in the catalyst utilization, albeit with moderate size distributions.13,14Because the nuclei formation and growth are ex-tremely sensitive to the overpotentials imposed, potentiostatic and galvanostatic depositions are known to produce distinct morpholo-gies and compositions in the resulting PtRu nanoparticles. Between them, the galvanostatic deposition is suitable to prepare catalysts in a larger geometric area and better distributions, in addition to sim-pler operation setups.15-18
In the galvanostatic depositions, the driving forces are imposed in manners of direct current or pulse current 共pc兲. With a single variable in current density共Ja兲, the dc deposition is known to pro-duce dendritic morphologies, because growths of the deposit are capped by the mass transport at a diffusion-limiting current.19 In contrast, deposition in the pc mode allows independent adjustments of Ja, current on-time 共Ton兲, and current off-time 共Toff兲, offering
more opportunities to obtain deposits with desirable attributes. As a result, many groups have employed pc depositions to fabricate elec-trocatalysts in Pt and PtRu.15-17,20-22 For example, Choi et al. re-ported notable advantages of pc deposition in particle sizes, adhe-sions, and uniform distributions.22
During the Toffin a pc deposition for binary alloys, differences in
the redox potentials for the deposited metals often render a sponta-neous galvanostatic displacement reaction in which the constituent of less positive redox potential dissolves from the deposit while the one with a higher redox potential is reduced from the electrolyte. A well-studied system is the CuNi alloy where detailed theoretic mod-eling and experimental results were discussed.23-25In this system, the Ni was alternately deposited and dissolved during Tonand Toff,
while the Cu was deposited continuously. Hence, the ratio for the
Ton/Toffplayed an important role in determining the resulting CuNi composition. So far, many groups have employed the displacement reaction to prepare substrates with unique surface layers.26-30For instance, noble films of Au, Pd, and Pt were deposited on Ge sub-strates with reasonable adhesions.30 In addition, Brankovic et al. have explored the spontaneous depositions of Pt on both single-crystalline and nanoparticulate Ru surfaces.31-33In Ru single crys-tals, they believe the surface oxidations are responsible for the re-duction of PtCl62− from the electrolyte. However, in the case of nanoparticles, partial dissolutions of Ru are likely to contribute to the PtCl62−reductions.
To date, many groups have employed pc deposition to fabricate PtRu nanoparticle and characterize their electrochemical performances.15,16,19-21However, none of them discussed the pos-sible influences of displacement reaction in determining the result-ing PtRu compositions. In this work, we investigate relevant vari-ables to identify the effect of displacement reaction by carrying out careful analysis on the compositions and associated methanol electro-oxidation behaviors.
Experimental
A carbon cloth共E-TEK兲 was used as the starting substrate for the growth of PtRu. Prior to the pc deposition process, the carbon cloth was coated with an ink dispersion in which 5.0 mg Nafion solution 共5.0 wt %兲 and 8.0 mg carbon powders 共Vulcan XC-72R兲 were mixed in 5.0 mL of 99.5 wt % ethanol for 30 min. The ink disper-sion was deposited repeatedly on a 2⫻ 2 cm2carbon cloth which
was kept at 80°C atop a hot plate to evaporate the residual solvent. The weight of the coated electrode was 26.3 mg/cm2. Subsequently, an electrochemical conditioning step was conducted by imposing five voltammetric scans on the coated carbon cloth at potentials between −0.2 and +1.1 V共vs Ag/AgCl兲 at a scan rate of 50 mV/s in *Electrochemical Society Student Member.
**Electrochemical Society Active Member.
z
E-mail: [email protected]
an electrolyte of 0.5 M H2SO4. The purpose for this treatment was
to homogenize the coated carbon cloth and expose a larger effective surface area.
The plating bath for the electrodeposition was formulated by mixing 99.9 wt % RuCl3 共Sigma-Aldrich兲 and 97.0 wt % NaNO2
共Showa兲 in an aqueous solution at 100°C for 1.0 h, followed by dissolution of 99.9 wt % H2PtCl6. Afterward, the solution was
cooled to room temperature, with the addition of 97.0 wt % H2SO4
共Showa兲 to increase conductivity of the electrolyte. The resulting concentrations for the H2PtCl6, RuCl3, NaNO2, and H2SO4 were 0.005, 0.005, 0.050, and 0.250 M, respectively. The solution was aged for 2 weeks to reach a steady state for the complex ions. In the pc depositions, rectangular pulses with independent parameters in
Ton, Toff, and Ja were explored. Three sets of experiments were
designed to elucidate the effect of displacement reaction. First, Ton of 50 ms and Ja of 50 mA/cm2 were selected with the Toffvaried
between 100 and 600 ms. Second, Toff of 400 ms and Ja of 50 mA/cm2 were chosen with the Ton varied between 25 and
400 ms. Lastly, we maintained the Tonand Toffat 50 and 400 ms but
adjusted the Ja between 75 and 200 mA/cm2. Throughout our
ex-periments, the total coulombic charge was kept at 8.0 C/cm2. Once the deposition was completed, the carbon cloth was removed and washed for subsequent electrochemical characterizations.
The electrochemical measurements were conducted at 26°C in a three-electrode arrangement using an EG&G 263A. First, to evalu-ate the electrochemical surface area 共ECSA兲, the PtRu-catalyzed carbon clothes were subjected to cyclic voltammetric共CV兲 scans in the voltage range of −0.2 and 0.9 V in 0.5 M H2SO4 with a scan rate of 50 mV/s. The ECSA was estimated by the integrated charge in the hydrogen desorption region.34,35Next, for catalytic abilities on the methanol electro-oxidation, multiple CV sweeps were per-formed in a potential range of −0.2 and 0.9 V at a scan rate of 20 mV/s in 500 mL of 0.5 M H2SO4and 1.0 M CH3OH. The area
for the working electrode was 1.0 cm2. The Ag/AgCl and Pt foil
共10.0 cm2兲 were used as the reference and counter electrodes,
re-spectively. The CV scan at the second cycle was used for compari-son purposes.
For phase confirmation of the deposited PtRu nanoparticles, X-ray diffraction共XRD, Siemens D5000兲 with a K␣of 1.54 Å was employed. A transmission electron microscope 共TEM, Philips Tecnai-20兲 was used to observe the morphologies and distributions for the PtRu nanoparticles. The average sizes and standard devia-tions of the PtRu nanoparticles were obtained by analyzing images from the TEM through software共Image-Pro Plus 6.0兲. Catalyst load-ings of the PtRu after the pc depositions were determined by an inductively coupled plasma mass spectrometry 共ICP-MS, SCIEX ELAN 5000兲, where the samples were dissolved in a solution con-taining HCl, HNO3, and HF at 2:2:1 volume ratio. X-ray
photoelec-tron spectroscopy共XPS, Thermo Microlab 350兲 was used to confirm the oxidative states of Ru in the PtRu nanoparticles.
Results and Discussion
Previously, several reports have identified the nitroso compounds of Ru to be promising complexes as the Ru sources for PtRu
electrodepositions.36-38 When dissolved in an acidic electrolyte, a spontaneous Ru deposition was not observed in nitroso precursors as compared to the typical RuCl3.39This contributed to a longer life-time and minimal bath management. In addition, Gavrilov et al. indicated that the presence of nitroso ligands shifts Ru/Ru共III兲 redox potential to more positive values.40Therefore, with the selection of nitroso precursor, similar Pt:Ru ratios are expected to be obtained in both deposit and solution states. This is especially critical because previous studies using the RuCl3and RuCl5reported substantial Pt
enrichments with respect to their concentration ratios in the electro-lyte. Consequently, their fabrications of desirable PtRu compositions hinged on empirical determination entirely.
Our preparation steps of nitroso Ru precursor followed earlier documentation in which the dissolution of RuCl3in excess NaNO2 at elevated temperatures was carried out.41The resulting complex was confirmed by Blake et al. to be Ru共NO兲共NO2兲4共OH兲2−.42
How-ever, in our electrolyte we also added H2PtCl6after the formation of
Ru nitroso complex. Because the molar ratio for Pt:Ru:NaNO2was 1:1:10, we surmise that the simultaneous presence of PtCl62− and Pt共NO2兲xCl6−x2− is likely. The color for the plating bath is in light yellow. This is in sharp contrast with the electrolytes of RuCl3and
RuCl5, which appear in dark brown.
For the pc depositions, intricate interactions between Ton, Toff, and Jaexert significant influences over the PtRu catalyst loadings,
compositions, distributions, as well as particle sizes. Therefore, careful scrutiny in the plating variables would be necessary. In our first set of experiments, pc depositions were conducted at various
Toff, while the Ton and Ja remained unchanged at 50 ms and 50 mA/cm2, respectively. Because we maintained the total charge
constant at 8.0 C/cm2, the entire deposition process lasted approxi-mately 4–35 min. TableIlists the experimental parameters as well as results from TEM and ICP-MS for the PtRu nanoparticles. As presented, the PtRu loadings were in the range of 67.6–128.5g/cm2. Following faradaic law, the coulombic
efficien-cies were estimated at 1.8–3.6%. These reduced values are attrib-uted to the parasitic hydrogen evolution occurring on the Pt sur-faces. Currents from the capacitive charge and discharge were not expected to be substantial, as the effective working range for the capacitance component were less than 1.0 ms for Tonand Toff.20We
observed a notable trend for the PtRu composition on different pulses. The ratio for the Pt in the PtRu nanoparticles increased con-siderably with a longer Toff. At the shortest Toffof 100 ms, we
de-termined the composition to be Pt52.7Ru47.3. In contrast, at the largest
Toffof 600 ms, the makeup was confirmed as Pt83.4Ru16.6.
TEM observations on the particles sizes indicated a slightly wider distribution as compared to those from conventional chemical reduction methods. For example, at a Toffof 200 ms, the PtRu nano-particles were an average of 12.9 nm with a standard deviation of 8.7 nm. Moderate size distributions are typical, because the nucle-ation and growth took place during each individual pulse. A recent report by Bennett et al. also observed similar behaviors when they prepared Pt nanoparticles on diamond thin films.43Figure1provides the representative TEM images for the PtRu nanoparticles from Toff
Table I. Results from material characterizations on the PtRu nanoparticles with fixed values of Ton „50 ms…, Ja „50 mAÕcm2…, and total
coulombic charge„8.0 CÕcm2 …. Toff 共ms兲 Pt loading 共g/cm2兲 Ru loading 共g/cm2兲 Pt/Ru atomic ratio Total loading 共g/cm2兲 Average size 共nm兲 deviationStandard 100 62.5 28.9 52.8/47.2 91.4 7.2 5.6
of 400 and 600 ms, respectively. The average size of the PtRu nano-particles from the Toff of 400 ms was 4.1 nm, while the Toff of
600 ms revealed a somewhat larger size of 11.3 nm. These TEM
images also indicated that the PtRu nanoparticles were dispersed uniformly on the carbon substrates with negligible aggregation.
Figure2exhibits the CV profiles in mass activity for the PtRu-catalyzed electrodes at various Toff. Critical information from the
CV responses, including the onset potentials, peak current共ia兲 and
potential共Va兲 at anodic scans, peak current 共ic兲 and potential 共Vc兲 at cathodic scans, as well as values for ECSA, are listed in TableII. For the samples with Toffin 100 and 200 ms, their CV curves
re-vealed moderate current outputs. This is unexpected, because com-positions for these two samples were Pt52.8Ru47.2 and Pt54.6Ru45.4,
respectively. In contrast, the CV profiles of the remaining samples demonstrated obvious anodic signals with relatively reduced
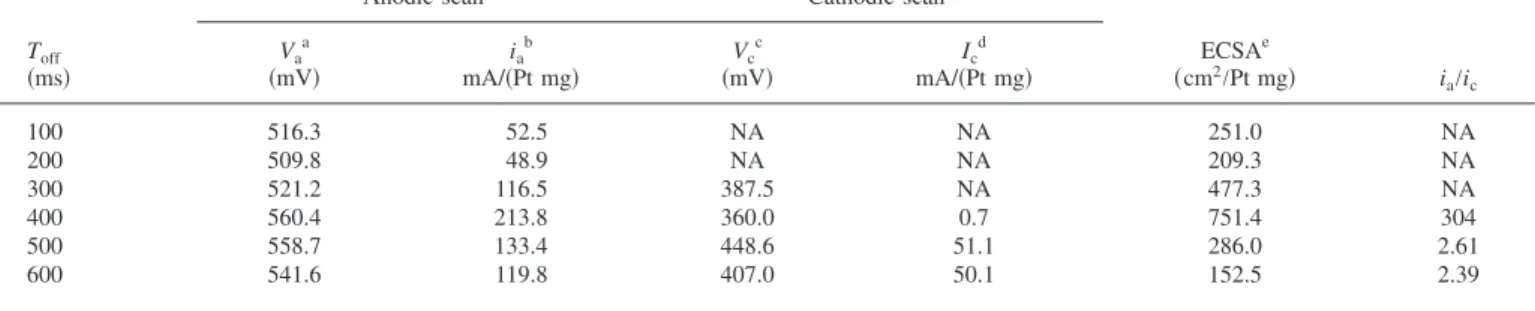
ca-Table II. Electrochemical parameters from the CV scans in mass activity of the PtRu-catalyzed carbon clothes with fixed values of Ton„50 ms…,
Ja„50 mAÕcm2…, and total coulombic charge „8.0 CÕcm2….
Toff
共ms兲
Anodic scan Cathodic scan
ECSAe 共cm2/Pt mg兲 i a/ic Vaa 共mV兲 ia b mA/共Pt mg兲 Vcc 共mV兲 Ic d mA/共Pt mg兲 100 516.3 52.5 NA NA 251.0 NA 200 509.8 48.9 NA NA 209.3 NA 300 521.2 116.5 387.5 NA 477.3 NA 400 560.4 213.8 360.0 0.7 751.4 304 500 558.7 133.4 448.6 51.1 286.0 2.61 600 541.6 119.8 407.0 50.1 152.5 2.39
aPotential at peak mass activity in anodic scan. bPeak mass activity in anodic scan.
cPotential at peak mass activity in cathodic scan. dPeak mass activity in cathodic scan.
eECSA from hydrogen desorption data.
100 nm
(B)
(A)
100 nm
Figure 1. Representative TEM images for the PtRu nanoparticles with fixed
values of Ton共50 ms兲, Ja共50 mA/cm2兲, and coulombic charge 共8.0 C/cm2兲,
as well as Toffof共A兲 400 and 共B兲 600 ms.
-50 0 50 100 150 200 (a) (b) (c) -0.2 0.0 0.2 0.4 0.6 0.8 1.0 -50 0 50 100 150 200
I/m
A
P
t
-1mg
-1E / V vs. Ag/AgCl
(d) (e) (f)Figure 2. CV profiles in mass activity for the PtRu-catalyzed carbon clothes
with fixed values of Ton共50 ms兲, Ja共50 mA/cm2兲, and coulombic charge
共8.0 C/cm2兲, as well as T
offof共a兲 100, 共b兲 300, 共c兲 500, 共d兲 200, 共e兲 400, and
thodic signals, suggesting considerable abilities for the methanol electro-oxidation. In addition, the onset potentials became smaller when the amount of Ru was increased, a fact that is consistent with what was reported in literature that alloying with Pt promotes methanol electro-oxidation.4The ratio for the ia/icindicates the
ca-pabilities to remove CO after methanol dehydrogenation. Among these samples, the one with Toffof 400 ms demonstrated the highest
value. As expected, for the mass activities, the sample with Toffin 400 ms exhibited the highest value of 213 mA mg−1Pt−1. More-over, the general trend for the ECSA was consistent with that of ia,
in which a larger ECSA is associated with a higher ia.
In our second set of experiments, the pc depositions were carried out at various Tonwhile the Toff and Ja were held at 400 ms and
50 mA/cm2, respectively. Because we kept the total charge
un-changed at 8.0 C/cm2, the entire deposition process lasted
approxi-mately 2.6–45.0 min. TableIIIprovides the experimental conditions as well as results from TEM and ICP-MS for the PtRu nanoparticles. As listed, the PtRu loadings were in the range of 67.6–128.8g/cm2. Similarly, the coulombic efficiency was
esti-mated at 1.8–2.6%. These values were in line with results obtained from our first set of experiments. An interesting trend was observed in which a longer Tonresulted in a lower amount of Pt in the PtRu nanoparticles. At the shortest Tonof 25 ms, we recorded the
compo-sition to be Pt90.9Ru9.1. In contrast, at the largest Tonof 400 ms, a
composition of Pt52.5Ru47.5was measured.
TEM observations on the PtRu nanoparticles confirmed a similar pattern in the size distributions. For example, at a Tonof 25 ms, we
obtained the average size to be 6.7 nm with a standard deviation of 5.0 nm. At a larger Tonof 400 ms, the average size was 8.4 nm with a standard deviation of 7.4 nm. Representative TEM pictures from those two samples are provided in Fig.3. Consistent with images in Fig.1, the PtRu nanoparticles were deposited uniformly throughout the substrates without aggregation. Figure4demonstrates the CV profiles in mass activity for the PtRu nanoparticles at various Ton.
Relevant parameters from the CV responses are also provided in TableIV. Apparently, all the samples revealed obvious anodic peaks without notable cathodic peaks. They suggest the presence of rea-sonable catalytic behaviors for methanol electro-oxidation. As ex-pected, the onset potentials and the peak potentials at the anodic scans became smaller with increasing Ru amounts. The sample with a Tonof 50 ms revealed the highest mass activities, reaching values at 213.8 mA mg−1Pt−1. Similarly, the trend of ECSA agreed with
that of ia, a fact we established in the previous set of experiments.
We realized that the duty cycle, defined as Ton/共Ton+ Toff兲, would be an appropriate indicator to solicit further information on the composition variations over Tonand Toff. As defined, a higher
duty cycle is closer to the dc deposition, while a lower one repre-sents a longer stop time between pulses. Figure5exhibits the ratio of Pt in the PtRu nanoparticles as a function of duty cycle from the data listed in TablesI and III. Remarkably, the Pt ratio increased
Ru were likely to reproduce their concentration ratios in the electro-lyte on the PtRu nanoparticles. In order to verify the observed trend, we also performed the pc depositions with Ja of 75, 100, and
200 mA/cm2, leaving the T
onand Tofffixed at 50 and 400 ms,
re-spectively. The experimental parameters and resulting material char-acteristics are provided in Table V. Interestingly, the Pt amounts
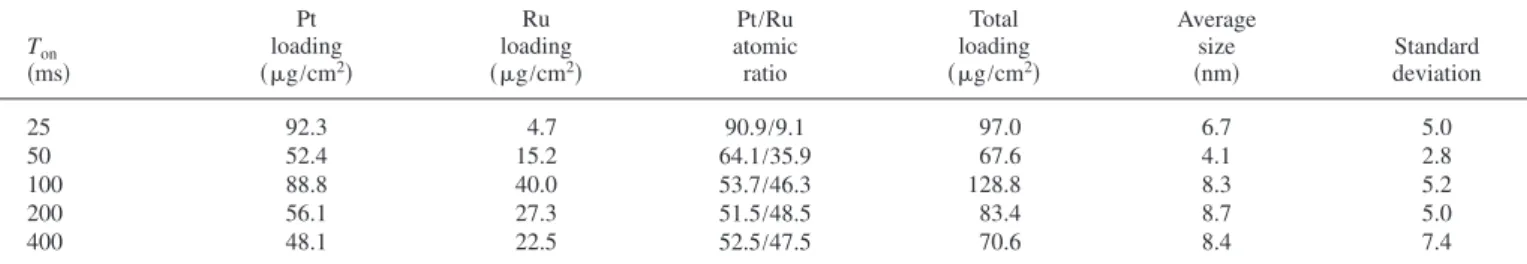
Table III. Results from material characterizations on the PtRu nanoparticles with fixed values of Toff„400 ms…, Ja„50 mAÕcm2…, and total
coulombic charge„8.0 CÕcm2 …. Ton 共ms兲 Pt loading 共g/cm2兲 Ru loading 共g/cm2兲 Pt/Ru atomic ratio Total loading 共g/cm2兲 Average size 共nm兲 deviationStandard 25 92.3 4.7 90.9/9.1 97.0 6.7 5.0 50 52.4 15.2 64.1/35.9 67.6 4.1 2.8 100 88.8 40.0 53.7/46.3 128.8 8.3 5.2 200 56.1 27.3 51.5/48.5 83.4 8.7 5.0 400 48.1 22.5 52.5/47.5 70.6 8.4 7.4
20 nm
(A)
(B)
20 nm
from these samples were rather consistent, indicating that the pc deposition was insensitive to the current densities under study once the Tonand Toffwere determined. In addition, the catalyst loadings
were in the range of 49.1–67.6g/cm2, values that are in line with
earlier results. TableVIalso lists the electrochemical characteristics for these samples.
To account for the apparent enrichment in the Pt at shorter duty cycles, we believe a displacement reaction was taking place where the Ru in the PtRu nanoparticles was preferentially dissolved while the Pt cations in the solution were reduced during Toff. This is at-tributed to the observed rise in the Pt ratio when the Toff was
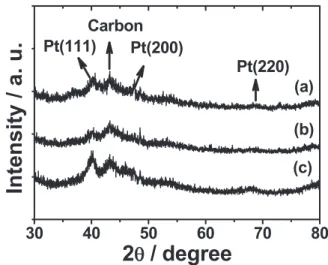
pro-longed. The nature of displacement reaction could be supported by detailed XRD analysis on the PtRu nanoparticles to determine their lattice parameter. Figure6exhibits the XRD patterns for the PtRu nanoparticles with Toffof 100, 400, and 600 ms, respectively. The
complete parameters for their synthetic conditions are shown in Table I. Due to the interferences from carbon clothes, the XRD profiles were expectedly rough. Nevertheless, the signals from Pt共111兲, Pt共200兲, Pt共220兲, and carbon were identified. Because we did not observe the characteristic Ru peaks, we rationalize that al-loying of Ru into the Pt lattice was successfully achieved. Moreover, because the atomic radius of Ru is smaller than that of Pt, substitu-tion of Ru in the Pt unit cell results in the reducsubstitu-tion of lattice pa-rameters. This engenders a slight shift of diffraction peaks to larger angles. To minimize undesirable noises, we selected the signal from Pt共111兲, as shown in Fig.7, to estimate the lattice parameter with the equation below
a =
冑
3k␣2 sinmax 关1兴
Where a is the lattice parameter, max is the peak position for
Pt共111兲, and k␣is the wavelength of X-ray. The value for a could
Table IV. Electrochemical parameters from the CV scans in mass activity of the PtRu-catalyzed carbon clothes with fixed values of Toff
„400 ms…, Ja„50 mAÕcm2…, and total coulombic charge „8.0 CÕcm2….
Ton
共ms兲
Anodic scan Cathodic scan
ECSAe 共cm2/Pt mg兲 i a/ic Va 共mV兲 ia b mA/共Pt mg兲 Vc 共mV兲 mA/共Pt mg兲Ic 25 565.1 66.3 433.1 12.7 105.0 5.20 50 560.4 213.8 360.0 0.7 751.4 304 100 540.0 81.2 NA NA 188.9 NA 200 539.2 100.1 NA NA 296.0 NA 400 518.0 108.7 NA NA 130.4 NA
aPotential at peak mass activity in anodic scan. bPeak mass activity in anodic scan.
cPotential at peak mass activity in cathodic scan. dPeak mass activity in cathodic scan.
eECSA from hydrogen desorption data.
-0.2 0.0 0.2 0.4 0.6 0.8 1.0 -50 0 50 100 150 200 (a) (b) (c) (d)
I/m
A
P
t
-1mg
-1E / V vs. Ag/AgCl
Figure 4. CV profiles in mass activity for the PtRu-catalyzed carbon clothes
with fixed values of Toff共400 ms兲, Ja共50 mA/cm2兲, and coulombic charge
共8.0 C/cm2兲, as well as T onof共a兲 25, 共b兲 50, 共c兲 100, and 共d兲 400 ms.
0.0
0.1
0.2
0.3
0.4
0.5
40
50
60
70
80
90
100
Pt
at
%
Duty cycle
J
a=75~200 mA/cm
2Figure 5. The effect of duty cycle on the Pt atomic ratio for the PtRu
nanoparticles. Data are from TablesI共䊏兲, III 共䊊兲, and V 共⫻兲.
30
40
50
60
70
80
(c)
(b)
Pt(200)
Intensity
/
a
.
u
.
2
θ
/ degree
Carbon
Pt(111)
Pt(220)
(a)
Figure 6. The XRD patterns for the PtRu nanoparticles with fixed values of Ton共50 ms兲, Ja共50 mA/cm2兲, and coulombic charge 共8.0 C/cm2兲, as well as Toffof共a兲 100, 共b兲 400, and 共c兲 600 ms.
further be used to deduce the amount of alloyed Ru, as suggested by Antolini et al., in the following relation44
a = a0− 0.124xRu 关2兴
where a0is the standard lattice parameter from a bulk Pt 共JCPDS: 870646兲 and xRu is the atomic Ru ratio in the alloyed state. The
results from these estimations are presented in TableVII. As listed, we noticed that when the Toff was prolonged, the ratio for the al-loyed Ru also decreased. This behavior is understandable, because when the displacement reaction was occurring共at larger Toff兲, the Ru on the surface were dissolved preferentially, leaving those buried inside共the alloyed Ru兲 intact.
An alternative explanation for the Pt enrichment at shorter duty cycles is a cementation process. As proposed by Spendelow and Wieckowski, spontaneous deposition of Pt from electrolyte could
proceed via the oxidation of Ru substrate.45In such a reaction, the Ru is not dissolved but exists in an oxidized state on the surface with metallic Pt deposited from the electrolyte. This model poses a drastic contrast with that of displacement reaction, where the Ru is dissolved. Therefore, we could identify the exact mechanism in our case simply by determining the oxidative states of Ru at different duty cycles.
Figure8apresents the XPS signals from Ru共3p3/2兲 on samples
of Toffin 100, 400, and 600 ms, respectively. The complete synthetic parameters can be obtained in TableI. The selection of Ru 共3p3/2兲 instead of Ru共3d5/2兲 was to avoid possible interference from that of
C共1 s兲. As shown in the diagram, all the samples revealed rather broad profiles. The signals peaks were located at 462.2, 462.0, and 461.9 eV for samples of 100, 400, and 600 ms, respectively. Earlier, the peak for metallic Ru was documented at 461.1 eV, which was close to what we measured.46A slight deviation is expected, because there is a minor shift of Ru signals共less than 0.1 eV兲 in the PtRu from that of metallic Ru.47Nevertheless, our broad signals seem to suggest that Ru existed in multiple oxidative states. Furthermore, the XPS signal intensity decreased considerably with longer Toff,
indi-Table V. Results from material characterizations on the PtRu nanoparticles with fixed values of Ton„50 ms…, Toff„400 ms…, and total coulombic
charge„8.0 CÕcm2 …. Ja 共mA/cm2兲 Pt loading 共g/cm2兲 Ru loading 共g/cm2兲 Pt/Ru atomic ratio Total loading 共g/cm2兲 Average size 共nm兲 deviationStandard 75 39.1 10.0 66.8/33.2 49.1 7.2 5.9 100 42.4 10.9 66.7/33.3 53.3 11.4 8.9 200 49.9 13.0 66.5/33.5 62.9 14.3 9.6
Table VI. Electrochemical parameters from the CV scans in mass activity of the PtRu-catalyzed carbon clothes with fixed values of Ton„50 ms…,
Toff„400 ms…, and total coulombic charge „8.0 CÕcm2….
Ja
共mA/cm2兲
Anodic scan Cathodic scan
ECSAe 共cm2/Pt mg兲 i a/ic Vaa 共mV兲 ia b mA/共Pt mg兲 Vcc 共mV兲 Ic d mA/共Pt mg兲 75 531.8 197.7 386.0 3.8 526.8 51.2 100 524.5 138.9 Na NA 434.5 NA 200 487.0 37.4 Na NA 243.4 NA
aPotential at peak mass activity in anodic scan. bPeak mass activity in anodic scan.
cPotential at peak mass activity in cathodic scan. dPeak mass activity in cathodic scan.
eECSA from hydrogen desorption data.
Table VII. Lattice parameter and alloyed Ru for the PtRu nano-particles with fixed values of Ton„50 ms…, Ja„50 mAÕcm2…, and
coulombic charge„8.0 CÕcm2
…. Sample
Pt共111兲
共deg兲 Lattice parameter a共Å兲 X共%兲Ru Pt/Ru ratiob
TF100 40.21 3.879 33.9 52.8/47.2 TF400 40.16 3.884 30.2 64.1/35.9
38
39
40
41
42
(c)
(b)
(a)
Intensity
/
a.u.
cating that the amount of Ru, regardless of its oxidative states, de-creases when the duty is reduced. This is consistent with our argu-ment of steady Ru loss during Toff.
In an acidic environment, we suspect the possible oxidation states of Ru are Ru0, RuO2, and RuO2·nH2O. To determine their
relative ratios quantitatively, we carried out curve fitting using soft-ware共Thermo Avantage 3.20兲. The corresponding peaks for RuO2,
and RuO2·nH2O were 462.2 and 463.8 eV, respectively.45,48Shown in Fig.8b, we acquired a reasonable match for the observed XPS responses. The detailed fitting results are listed in TableVIII. When the Toffwas prolonged, we observed that the ratio for the metallic Ru increased, while the ratio for the RuO2·nH2O decreased steadily.
Interestingly, the ratio for the RuO2remained unchanged. Because the metallic Ru existed in the alloyed state buried inside the PtRu nanoparticles, the loss of Ru in the displacement reaction was likely from the RuO2·nH2O on the surface.
Conclusion
The pc depositions were employed to prepare PtRu nanoparticles on carbon clothes. Parameters including Ton, Toff, and Jawere ex-plored to identify the optimized catalytic performances for methanol electro-oxidation. TEM images on the PtRu nanoparticles revealed an uniform distribution with moderate size variations. Measure-ments from ICP-MS indicated that a displacement reaction was oc-curring, resulting in the enrichment of Pt in the PtRu nanoparticles when the duty cycle was shortened. XRD analysis on the PtRu nano-particles exhibited a slight shift of diffraction peaks, suggesting the Ru was alloyed with Pt successfully. In addition, the alloyed Ru was found to decrease with reduced duty cycles. Analysis from XPS confirmed a steady loss of RuO2·nH2O when the Toffwas prolonged.
Acknowledgments
Financial support from the National Science Council of Taiwan is noted共NSC-96-2221-E-009-110兲.
National Chiao Tung University assisted in meeting the publication costs of this article.
References
1. B. C. H. Steele and A. Heinzel, Nature (London), 414, 345共2001兲. 2. G. J. K. Acres, J. Power Sources, 100, 60共2001兲.
3. H. Liu, C. Song, L. Zhang, J. Zhang, H. Wang, and D. P. Wilkinson, J. Power
Sources, 155, 95共2006兲.
4. O. A. Petrii, J. Solid State Electrochem., 12, 609共2008兲.
5. H. Igarashi, T. Fujino, Y. Zhu, H. Uchida, and M. Watanabe, Phys. Chem. Chem.
Phys., 3, 306共2001兲.
6. P. Strasser, Q. Fan, M. Devenney, W. H. Weinberg, P. Liu, and J. K. Nørskov, J.
Phys. Chem. B, 107, 11013共2003兲.
7. J. F. Whitacre, T. Valdez, and S. R. Narayanan, J. Electrochem. Soc., 152, A1780 共2005兲.
8. T. Yajima, H. Uchida, and M. Watanabe, J. Phys. Chem. B, 108, 2654共2004兲. 9. P. Waszczuk, G. Q. Lu, A. Wieckowski, C. Lu, C. Rice, and R. I. Masel,
Electro-chim. Acta, 47, 3637共2002兲.
10. F. Richarz, B. Wohlmann, U. Vogel, H. Hoffschulz, and K. Wandelt, Surf. Sci., 335, 361共1995兲.
11. J. H. Choi, K. W. Park, B. K. Kwon, and Y. E. Sung, J. Electrochem. Soc., 150, A973共2003兲.
12. S. Y. Huang, S. M. Chang, and C. T. Yeh, J. Phys. Chem. B, 110, 234共2006兲. 13. M. C. Tsai, T. K. Yeh, and C. H. Tsai, Electrochem. Commun., 8, 1445共2006兲. 14. J. M. Sieben, M. M. E. Duarte, and C. E. Mayer, J. Appl. Electrochem., 38, 483
共2008兲.
15. C. Coutanceau, A. F. Rakotondrainibé, A. Lima, E. Garnier, S. Pronier, J. M. Léger, and C. Lamy, J. Appl. Electrochem., 34, 61共2004兲.
16. F. Alcaide, Ó. Miguel, and H. J. Grande, Catal. Today, 116, 408共2006兲. 17. Z. D. Wei and S. H. Chan, J. Electroanal. Chem., 569, 23共2004兲.
18. A. Bauer, E. L. Gyenge, and C. W. Oloman, J. Power Sources, 167, 281共2007兲. 19. S. S. Kim, Y. C. Nah, Y. Y. Noh, J. Jo, and D. Y. Kim, Electrochim. Acta, 51, 3814
共2006兲.
20. Z. D. Wei, S. G. Chen, Y. Liu, C. X. Sun, Z. G. Shao, and P. K. Shen, J. Phys.
Chem. C, 111, 15456共2007兲.
21. J. Lee, J. Seo, K. Han, and H. Kim, J. Power Sources, 163, 349共2006兲. 22. K. H. Choi, H. S. Kim, and T. H. Lee, J. Power Sources, 75, 230共1998兲. 23. S. Roy, M. Matlosz, and D. Landolt, J. Electrochem. Soc., 141, 1509共1994兲. 24. S. Roy and D. Landolt, J. Electrochem. Soc., 142, 3021共1995兲.
25. Q. Zhu and C. L. Hussey, J. Electrochem. Soc., 148, C395共2001兲.
26. L. Magagnin, R. Maboudian, and C. Carraro, J. Phys. Chem. B, 106, 401共2002兲. 27. J. Zhang, F. H. B. Lima, M. H. Shao, K. Sasaki, J. X. Wang, J. Hanson, and R. R.
Adzic, J. Phys. Chem. B, 109, 22701共2005兲.
28. M. B. Vukmirovic, J. Zhang, K. Sasaki, A. U. Nilekar, F. Uribe, M. Mavrikakis, and R. R. Adzic, Electrochim. Acta, 52, 2257共2007兲.
29. C. Thambidurai, Y. G. Kim, and J. L. Stickney, Electrochim. Acta, 53, 6157 共2008兲.
Table VIII. Results from XPS and curve fitting of PtRu nanopar-ticles with fixed values of Ton„50 ms…, Ja„50 mAÕcm2…, and total
coulombic charge„8.0 CÕcm2…. Toff 共ms兲 Binding energy a 共eV兲 Reference binding energyb
共eV兲 Suggestedspecies
Ratio 共%兲 100 461.1 461.1 Ru 36.5 462.6 462.2 RuO2 33.9 463.9 463.8 RuO2·nH2O 29.6 400 461.1 461.1 Ru 41.1 462.4 462.2 RuO2 34.5 463.8 463.8 RuO2·nH2O 24.4 600 461.2 461.1 Ru 43.8 462.4 462.2 RuO2 36.4 463.8 463.8 RuO2· nH2O 19.8
aFrom XPS curve fitting. bFrom Ref.45,46, and48.
472
468
464
460
456
(c)
(b)
Intersity
/
a.u.
Binding energy / eV
Ru 3p
3/2(a)
462.2 eV 462.0 eV 461.9 eV(A)
468
464
460
456
RuOX•nH2OIntersity
/
a.u.
Binding energy / eV
(B)
Ru RuO2Figure 8.共A兲 XPS signals of Ru 共3p3/2兲 from PtRu nanoparticles with fixed
values of Ton共50 ms兲, Ja共50 mA/cm2兲, and coulombic charge 共8.0 C/cm2兲,
as well as Toffin共a兲 100, 共b兲 400, and 共c兲 600 ms. 共B兲 The results of curve
fitting using Ru0, RuO
30. L. A. Porter, Jr., H. C. Choi, A. E. Ribbe, and J. M. Buriak, Nano Lett., 2, 1067 共2002兲.
31. S. R. Brankovic, J. McBreen, and R. R. Adžić, J. Electroanal. Chem., 503, 99 共2001兲.
32. S. R. Brankovic, J. X. Wang, and R. R. Adžić, Electrochem. Solid-State Lett., 4, A217共2001兲.
33. S. R. Brankovic, J. X. Wang, Y. Zhu, R. Sabatini, J. McBreen, and R. R. Adžić, J.
Electroanal. Chem., 524–525, 231共2002兲. 34. R. J. Woods, Electroanal. Chem., 9, 1共1976兲.
35. Z. Liu, X. Y. Ling, B. Guo, L. Hong, and J. Y. Lee, J. Power Sources, 167, 272 共2007兲.
36. T. Frelink, W. Visscher, and J. A. R. van Veen, Surf. Sci., 335, 353共1995兲. 37. C. L. Green and A. Kucernak, J. Phys. Chem. B, 106, 11446共2002兲. 38. F. Maillard, F. Gloaguen, and J.-M. Leger, J. Appl. Electrochem., 33, 1共2003兲. 39. F. Vigier, F. Gloaguen, J.-M. Leger, and C. Lamy, Electrochim. Acta, 46, 4331
共2001兲.
40. A. N. Gavrilov, O. A. Petrii, A. A. Mukovnin, N. V. Smirnova, T. V. Levchenko, and G. A. Tsirlina, Electrochim. Acta, 52, 2775共2007兲.
41. T. D. Avtokratova, Analytical Chemistry of Ruthenium, p. 8, Ann Arbor-Humphery Science Publishers, Ann Arbor, MI共1963兲.
42. A. J. Blake, R. O. Gould, B. F. G. Johnson, and E. Parisini, Acta Crystallogr., Sect.
C: Cryst. Struct. Commun., 48, 982共1992兲.
43. J. A. Bennett, Y. Show, S. Wang, and G. M. Swain, J. Electrochem. Soc., 152, E184共2005兲.
44. E. Antolini and F. Cardellini, J. Alloys Compd., 315, 118共2001兲.
45. J. S. Spendelow and A. Wieckowski, Phys. Chem. Chem. Phys., 6, 5094共2004兲. 46. XPS Database, U.S. National Institute of Standards and Technology, Gaithersburg,
MD共2008兲.
47. A. Lewera, W. P. Zhou, R. Hunger, W. Jaegermann, A. Wieckowski, S. Yockel, and P. S. Bagus, Chem. Phys. Lett., 447, 39共2007兲.