Alternative method for measuring both
the refractive indices and the thickness
of silver-halide holographic plates
Cheng-Chih Hsu
Industrial Technology Research Institute Center for Measurement Standards Building 16, 321 Kuang Fu Road,
Section 2
Hsin-Chu 30050, Taiwan
Jiun-You Lin
National Chiao Tung University Institute of Electro-Optical Engineering 1001 Ta-Hsueh Road
Hsin-Chu 30050, Taiwan
Kun-Huang Chen Feng Chia University
Department of Electrical Engineering 100 Wenhwa Road
Seatwen, Taichung 40724 Taiwan
Der-Chin Su,MEMBER SPIE
National Chiao Tung University Institute of Electro-Optical Engineering 1001 Ta-Hsueh Road
Hsin-Chu 30050, Taiwan
Abstract. First, the phase differences between s- and p-polarizations of a circularly polarized heterodyne light beam reflected from the emul-sion layer, and that from its substrate, are measured, respectively. The measured data are substituted into specially derived equations, so the refractive indices of the emulsion layer and its substrate can be calcu-lated. Second, the variations of phase differences between s- and p-polarizations due to the wavelength shifts and the extraction of the holographic plate in a modified Michelson interferometer are measured. Then, the thickness of the emulsion layer and its substrate can be esti-mated based on the measured values of refractive indices, the wave-length shifts, and the phase difference variations. This method has some advantages, such as high resolution and easy operation in only one optical configuration. © 2005 Society of Photo-Optical Instrumentation Engineers. [DOI: 10.1117/1.1902624]
Subject terms: silver-halide holographic; refractive index; heterodyne interferom-etry.
Paper 040282R received May 17, 2004; revised manuscript received Nov. 16, 2004; accepted Nov. 17, 2004; published online May 23, 2005.
1 Introduction
Silver-halide holographic plates1,2are widely used because of their high sensitivity and commercial availability. Ac-cording to the coupled wave theory,3 their thickness and refractive indices strongly influence the characteristics of holograms. To enhance the quality of a hologram, it is very important to measure accurately the associated thickness and refractive indices of a holographic plate.2 There are several methods4 –10 proposed for measuring the refractive index of material, but they are suitable only for either ab-sorbing materials4 –7 or nonabsorbing materials.8 –10 Al-though some other methods11–13are also proposed for mea-suring the thickness, they are applied only for the thickness being smaller than the light wavelength. However, the com-mercial silver-halide holographic plates consist of a weak-absorbing emulsion layer and a nonweak-absorbing substrate, and their thicknesses are far larger than the light wavelength. To our knowledge, there is no method for measuring both the refractive indices and the thickness of a thick weak-absorbing material and its substrate with single optical con-figuration. In this work, an alternative method for achieving all these measurements in one setup is presented. This method is based on Fresnel’s equations,14 heterodyne interferometry,15 and multiwavelength interferometry.16 Three pieces of holographic plates are measured, and the measured results are in good correspondence with the ref-erence data. The validities of this method are demonstrated.
2 Principle
The schematic diagram of this method is shown in Fig. 1. For convenience, the ⫹z axis is chosen to be along the light propagation direction and the x axis is along the di-rection perpendicular to the paper plane. A light coming from a heterodyne light source17 has an angular frequency difference between s- and p-polarizations, and its Jones vector18 can be written as
E⫽ 1
冑
2冋
exp共it/2兲
exp共⫺it/2兲
册
. 共1兲It is incident on a beamsplitter共BS兲 and is divided into two parts: the transmitted light and the reflected light. The transmitted light is used to measure the refractive indices of both the emulsion layer and its substrate, and the reflected light is for measuring the thickness. The details are de-scribed as follows.
2.1 Refractive Index Measurements
The transmitted light passes through a quarter-wave plate Q with the fast axis at 0 deg to the x axis. The Jones vector of the light can be written as19
0091-3286/2005/$22.00 © 2005 SPIE
055801-1
Ei⫽Q共0 deg兲•E⫽
冋
cos冉
t 2冊
⫺sin冉
t 2冊
册
⫽1 2冉
1 i冊
exp冉
i t 2冊
⫹ 1 2冉
1⫺i
冊
exp冉
⫺it
2
冊
. 共2兲From Eq. 共2兲, we can see that the right- and left-circular polarizations have angular frequency shifts/2 and⫺/2, respectively. Thus, there is an angular frequency difference
between them. This circularly polarized heterodyne light beam is incident atonto the silver-halide emulsion layer. Then the reflected light passes through an analyzer ANt1 with the transmission axis at␣ to the x axis, and enters a photodetector Dt1. Hence, the intensity detected by Dt1can be expressed as
I11⫽I0关1⫹␥cos共t⫹1兲兴, 共3兲
where I0 and␥ are the bias intensity and the visibility of the signal, and 1 is the phase difference between the p-and s-polarizations coming from the reflection of the emul-sion layer. They can be written as
I0⫽ 1 2共兩rp兩 2cos2␣⫹兩r s兩2sin2␣兲, 共4兲 ␥⫽
冑
A 2⫹B2 I0 , 共5兲 A⫽1 2共兩rp兩 2cos2␣⫺兩r s兩2sin2␣兲, 共6兲 B⫽1 2共rprs*⫹rsr*p兲sin␣cos␣, 共7兲 and 1⫽tan⫺1冉
B A冊
⫽tan ⫺1冋
共rprs*⫹rsr*p兲sin␣cos␣ 兩rp兩2cos2␣⫺兩rs兩2sin2␣册
, 共8兲where rp, rs, rp*, and rs*are the reflection coefficients and its conjugates of p- and s-polarizations, respectively. Ac-cording to the Fresnel’s equations, we have14
rp⫽cos关sin
⫺1共sin/n
e兲兴⫺necos cos关sin⫺1共sin/ne兲兴⫹necos
, 共9兲
and
rs⫽
cos⫺necos关sin⫺1共sin/ne兲兴 cos⫹necos关sin⫺1共sin/ne兲兴
, 共10兲
where ne is the refractive index of the silver-halide emul-sion layer and it can be written as ne⫽n⫹ik.
On the other hand, the modulated electronic signal of the heterodyne light source is filtered and becomes the refer-ence signal. It has the form of
Ir⫽ 1
2关1⫹cos共t兲兴. 共11兲
Both these two sinusoidal signals I11 and Ir are sent to a lock-in amplifier and their phase difference1can be mea-sured accurately.
From Eqs.共8兲, 共9兲, and 共10兲, it is obvious that the phase difference 1 is a function of n, k, and ␣, and it can be experimentally measured for each given␣. To evaluate the values of n and k, we require two phase differences11and
12 that correspond to two azimuth angles ␣1 and ␣2, respectively. Hence, a set of simultaneous equations
11⫽ f共n,k,␣1兲, 共12兲
12⫽ f共n,k,␣2兲, 共13兲
are obtained. If these simultaneous equations are solved, then the refractive indices n and k of the emulsion layer can be estimated.
Second, let the tested holographic plate be rotated by
180 deg such that the light beam is incident at identical incident angle on its substrate, then the test signal has a similar mathematical form of Eq. 共3兲 but with a different phase difference13. It can be expressed as
13⫽tan⫺1
再
关1⫹2ns 2
⫹2共ns
2⫺1兲cos 2⫹cos 4
兴sin 4␣3⫺8nscossin2sin 2␣3
冉
4ns2⫺2⫹2 cos 2 ns2
冊
1/2 4关ns 2 ⫺1⫹共1⫹ns 2兲cos 2兴冎
, 共14兲where ns is the refractive index of the substrate. Because the substrate is a nonabsorbing material, its refractive index can be solved from Eq.共14兲 only given an azimuth angle
␣3 of ANt1 and the measured value of13.
2.2 Thickness Measurements
As shown in Fig. 1, the reflected light coming from the BS is reflected again by a mirror M1 and enters a modified Michelson interferometer. It consists of a polarization beamsplitter 共PBS兲, two mirrors M2 and M3, an analyzer ANt2, and a photodetector Dt2. The tested holographic plate H is located in one arm and the light beam passes through this plate perpendicularly. In the interferometer, PBS divides the light into two beams. The paths of these two beams are: 1. PBS→M3→PBS→M1→BS→ANt2
→Dt2 共for the reflected s-polarization light兲, and 2. PBS
→H→M2→PBS→M1→BS→ANt2→Dt2 共for the
trans-mitted p-polarization light兲. If the transmission axis of ANt2 is 45 deg to the x axis, then Jones vectors of p- and s-polarizations arriving at Dt2 are
Ep⫽ 1 2
冑
2冉
1 1冊
exp冋
i冉
t 2 ⫹21冊册
exp冉
⫺ 4k1de 1冊
, 共15兲 and Es⫽ 1 2冑
2冉
1 1冊
exp冋
i冉
⫺ t 2冊册
, 共16兲where k1 is the imaginary index of the emulsion layer at wavelength 1, de is the thickness of the emulsion layer, and dsis that of the substrate, respectively.21is the phase difference due to the optical path difference between the two arms, and it can be expressed as
21⫽
4关n1de⫹ns1ds⫹d兴
1
, 共17兲
where n1 and ns1 are the real index of the emulsion layer and the refractive index of the substrate at wavelength1, and d is the path difference between the two arms, except for the thickness of the tested holographic plate in the in-terferometer, respectively. Hence, the intensity of the test signal received by Dt2 can be expressed as
I21⫽兩Ep⫹Es兩2⫽ 1 4
冋
1⫹exp冉
⫺ 8k1de 1冊
⫹2 exp冉
⫺4k1de 1冊
cos共t⫹21兲册
. 共18兲When the wavelength of the heterodyne light source is slightly shifted to2, then it becomes
I22⫽兩Ep
⬘
⫹Es⬘
兩 2⫽1 4冋
1⫹exp冉
⫺ 8k2de 2冊
⫹2 exp冉
⫺4k2de 2冊
cos共t⫹22兲册
, 共19兲where k2 is the imaginary index of the emulsion layer at wavelength 2. These sinusoidal signals I21, I22, and Ir are sent to the lock-in amplifier, then 21 and22 can be obtained. Hence, the variations of phase difference⌬due to the wavelength shift⌬1(⫽2⫺1) can be derived and written as ⌬⫽22⫺21 ⫽4关de共n21⫺n12兲⫹ds共ns21⫺ns12兲⫺d⌬1兴 12 , 共20兲 where n2 and ns2 are the real index of the emulsion layer and the refractive index of the substrate at wavelength2, respectively.
Then, remove the tested holographic plate H from the interferometer, and the phase differences are measured similarly. We also obtain31 at1, and32at2. So the phase difference variation⌬
⬘
between two measurements can be written as ⌬⬘
⫽32⫺31⫽⫺ 4共de⫹ds⫹d兲⌬1 12 . 共21兲 Consequently, we have⌿⫽⌬
⬘
⫺⌬⫽4关de共n12⫺n21⫺⌬1兲⫹ds共ns12⫺ns21⫺⌬1兲兴 12. 共22兲
Because 兩⌬兩 is so small, we have n1⬵n2⬵n and ns1
⬵ns2⬵ns. Then Eq.共22兲 can be rewritten as
⌿⫽4关共n⫺1兲de⫹共ns⫺1兲ds兴⌬1 12
. 共23兲
From Eq.共23兲, it is obvious that ⌿ is a function of de, ds, and ⌬. Hence, to evaluate the values of de and ds, we require two phase differences⌿1 and⌿2 that correspond to the wavelength shifts ⌬1⫽2⫺1 and ⌬2⫽3 ⫺1. Hence, a set of simultaneous equations
⌿1⫽ f共de,ds,1,2,⌬1兲, 共24兲
⌿2⫽ f共de,ds,1,3,⌬2兲, 共25兲
are obtained. If these simultaneous equations are solved, then the thickness de and ds can be estimated.
3 Experiments and Results
To show the feasibility of this method, we measured the refractive indices and the thickness of two Slavich holo-graphic plates 共PFG-01 and VRP-M兲 and a hologram fab-ricated with a VRP-M holographic plate at 25°C. The het-erodyne light source consisting of a tunable diode laser 共Model 6304, New Focus兲 and an electro-optic modulator 共EO兲 driven by a function generator 共FG兲 was used, as shown in Fig. 1. The frequency of the sawtooth signal ap-plied to the EO was 1 kHz. A lock-in amplifier with reso-lution 0.001 deg 共Model SR850, Stanford Research Sys-tem兲 was used to measure the phase difference, and a personal computer was employed to record and analyze the data. For convenience, the experimental conditions ⫽59 deg, ␣1⫽40 deg, ␣2⫽60 deg, ␣3⫽45 deg, 1⫽632.8 nm, 2⫽632.79 nm, 3⫽632.81 nm, ⌬1⫽⫺0.01 nm, and ⌬2⫽0.01 nm were used. The measurement and estimated results are summarized in Tables 1 and 2. The reference data from Refs. 2 and 7 and the measured values of the plate thickness with a conventional micrometer are listed in Table 3 for comparison. It is clear that they show good agreement.
In the prior experiments, we showed that the values of n and k could be evaluated by measuring two phase differ-ences 11 and 12 that correspond to two azimuth angles
␣1 and␣2, respectively. To evaluate the values of n and k more accurately, the relations between1 and␣were also measured under the conditions ⫽59 deg and 1 ⫽632.8 nm. The measured results and the associated fitting curves are shown in Fig. 2. Then, based on these fitting curves, n and k can be evaluated with Eqs.共4兲 through 共8兲 and by the least-square method. For comparison, these evaluated values of n and k are also listed into Table 2 with superscript #. Theoretically, they are more accurate than the results obtained with two phase differences 11 and12. The differences between these two results are small.
4 Discussions
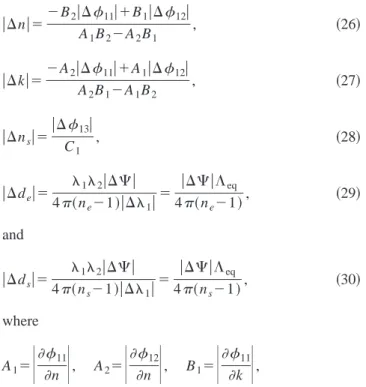
From Eqs.共8兲, 共14兲, and 共23兲, we get 兩⌬n兩⫽⫺B2兩⌬A11兩⫹B1兩⌬12兩 1B2⫺A2B1 , 共26兲 兩⌬k兩⫽⫺A2兩⌬11兩⫹A1兩⌬12兩 A2B1⫺A1B2 , 共27兲 兩⌬ns兩⫽ 兩⌬13兩 C1 , 共28兲 兩⌬de兩⫽ 12兩⌬⌿兩 4共ne⫺1兲兩⌬1兩 ⫽ 兩⌬⌿兩⌳eq 4共ne⫺1兲 , 共29兲 and 兩⌬ds兩⫽ 12兩⌬⌿兩 4共ns⫺1兲兩⌬1兩 ⫽ 兩⌬⌿兩⌳eq 4共ns⫺1兲, 共30兲 where A1⫽
冏
11 n冏
, A2⫽冏
12 n冏
, B1⫽冏
11 k冏
,Table 1 Measurement results. Note that VRPM*means the holo-gram fabricated with a VRPM holographic plate.
Phase difference (in deg.) PFG-01 VRPM VRPM* 11 1.957 2.056 ⫺0.05 12 0.945 0.995 ⫺0.03 13 5.247 5.038 4.833 ⌿1 23.252 23.085 23.161 ⌿2 ⫺23.252 ⫺23.086 ⫺23.162
Table 2 Estimated results. Note that superscript # represents the
estimated values with the fitting curves of1versus␣shown in Fig. 4, Eq. (8), and the least-square method.
Parameter PFG-01 VRPM VRPM* n 1.60923 1.60626 1.66591 1.60875# 1.60544# 1.66513# k 0.000071 0.000043 0.004866 0.000075# 0.000039# 0.00541# ns 1.51508 1.51508 1.51508 de(m) 7.32 5.69 5.35 ds(mm) 2.502 2.486 2.494
B2⫽
冏
12 k冏
, C1⫽冏
13 ns冏
, 共31兲 and 兩⌬n兩, 兩⌬k兩, 兩⌬ns兩, 兩⌬de兩, 兩⌬ds兩, 兩⌬11兩, 兩⌬12兩, 兩⌬13兩, and兩⌬⌿兩 are the errors of n, k, ns, de, ds, 11,12,13, and⌿, respectively. ⌳eqis the equivalent wave-length 共⬵40 mm in our experiments兲. The angular resolu-tion of the lock-in amplifier, second harmonic error, and polarization-mixing errors are the factors that influence the accuracy of the phase difference in this method. According to Chiu, Lee, and Su’s calculations,20the total phase differ-ence errors of 兩⌬11兩, 兩⌬12兩, 兩⌬13兩, and 兩⌬⌿兩 can be decreased to 0.03 deg. Substituting the conditions 兩⌬11兩 ⫽兩⌬12兩⫽兩⌬13兩⫽兩⌬⌿兩⫽0.03 deg, 1⫽632.8 nm, 2 ⫽632.79 nm, ⌬1⫽⫺0.01 nm, and the measurement re-sults of neand ns into Eqs.共26兲 through 共31兲, the measure-ment errors of each plate can be calculated with the soft-ware MATHEMATICA. The results are summarized in Table 4.
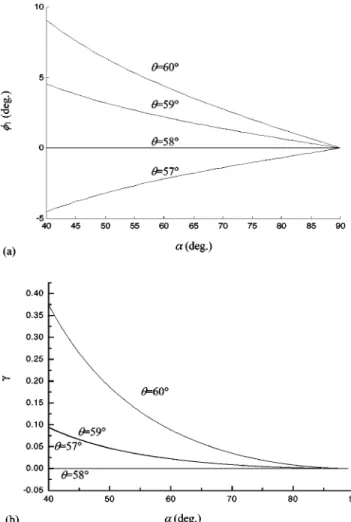
According to Chiu, Lee, and Su,20 we understand that the phase difference error depends on the phase difference, and it becomes very small as the phase difference ap-proaches zero. Substituting our experimental conditions into Eqs.共4兲 and 共8兲, the curves of1 and␥ versus␣ for some different can be plotted in Figs. 3共a兲 and 3共b兲,
re-spectively. It can be seen that when approaches Brew-ster’s angle 共⬵57.99 deg兲 of the silver-halide emulsion layer, both the phase difference1 and its associated␥are almost equal to 0. Compromising between1and␥,⫽59 deg is chosen for our experiments.
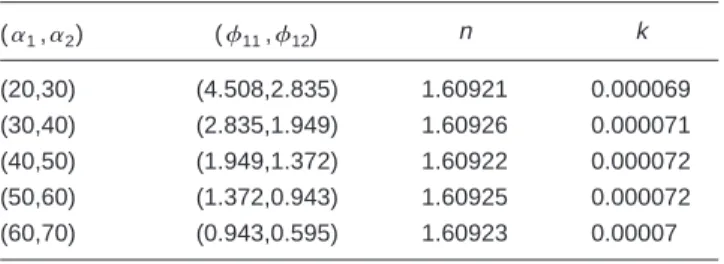
The relations between1 and␣had been measured and depicted in Fig. 2. Here only the measured data for PFG-01 are rearranged and listed in the columns (␣1,␣2) and (11,12) of Table 5. The associated evaluated values of n and k are listed in the same table. From this table, it is obvious that the evaluated values of n and k are indepen-dent of (␣1,␣2).
Fig. 2 Measured data between1and␣, and the associated fitting
curves.
Table 3 Reference data. Note that superscripts a, b, and c
repre-sent the reference data coming from Refs. 7 and 2, and Scott Lim-ited, and superscript d represents the measured values with a con-ventional micrometer, respectively.
Parameter PFG-01 VRPM VRPM* n 1.609a 1.604b 1.665b k 0.00008a 0.00004 0.00536 ns 1.51509 c 1.51509c 1.51509c de(m) 7.31a 5.7b 5.35b ds(mm) 2.51d 2.50d 2.50d
Table 4 Estimated errors of⌬n,⌬k,⌬ns,⌬de, and⌬ds.
Parameter error PFG-01 VRP-M VRP-M* 兩⌬n兩 2.28⫻10⫺5 3.48⫻10⫺5 1.07⫻10⫺5 兩⌬k兩 2.41⫻10⫺6 2.70⫻10⫺6 2.33⫻10⫺6 兩⌬ns兩 5.24⫻10⫺4 5.24⫻10⫺4 5.24⫻10⫺4 兩⌬de兩(m) 0.913 0.917 0.835 兩⌬ds兩(m) 3.24 3.24 3.24
Fig. 3 Relation curves of (a)1versus ␣and (b)␥versus␣for
To avoid phase wrapping,21 it is necessary to let ⌿ be smaller than. So our experimental conditions are suitable for the emulsion layer and its substrate with thickness smaller than⌳eq/4(n⫺1) and ⌳eq/4(ns⫺1), respectively. Substituting n⬵1.67 and n⬵1.52 into ⌳eq/4(n⫺1) and ⌳eq/4(ns⫺1), their measurable thicknesses are smaller than 14.93 and 19.23 mm, respectively.
5 Conclusions
An alternative method for measuring both the refractive indices and the thickness of the silver-halide emulsion layer and its substrate is presented by using the multiwavelength circularly polarized heterodyne interferometry. These opti-cal parameters can be estimated with only one optiopti-cal con-figuration. This method has many merits such as simple optical setup, easy operation, and rapid measurement. Its validity is demonstrated. It is suitable for the emulsion layer and its substrate with thicknesses smaller than 14.93 and 19.23 mm, respectively, in our experiments.
Acknowledgments
This study was supported in part by the National Science Council, Taiwan under contract NSC 92-2215-E-009-052. References
1. P. Hariharan, Optical Holography: Principles, Techniques, and
Appli-cations, 2nd ed., Chap. 7, Cambridge University Press, Boston, MA 共1996兲.
2. J. H. Chen, D. C. Su, and J. C. Su, ‘‘Shrinkage- and refractive-index shift-corrected volume holograms for optical interconnects,’’ Appl.
Phys. Lett. 81, 1387–1389共2002兲.
3. H. Kogelnik, ‘‘Coupled wave theory for thick hologram gratings,’’
Bell Syst. Tech. J. 48, 2909–2947共1969兲.
4. See http://www.aquila-instrucments.com.
5. C. Jung and B. K. Rhee, ‘‘Simultaneous determination of thickness and optical constants of polymer thin film by analyzing transmit-tance,’’ Appl. Opt. 41, 3861–3865共2002兲.
6. X. Liu, P. Liang, W. Zhang, and Y. Tang, ‘‘Measuring the optical parameters of thin films by p-polarized laser beams,’’ Opt. Technol.
30, 85– 89共1998兲.
7. A. Belendez, T. Belendez, C. Neipp, and I. Pascual, ‘‘Determination of the refractive index and thickness of holographic silver halide ma-terials by use of polarized reflectance,’’ Appl. Opt. 41, 6802– 6807
共2002兲.
8. B. Smith, D. F. Clark, and C. Hamilton, ‘‘Characterization of planar antiresonant reflecting optical waveguide structures on silicon by an Abbe refractometer,’’ Opt. Lett. 20, 2084 –2086共1995兲.
9. M. V. Collados, I. Arias, A. Garcia, J. Atencia, and M. Quintanilla, ‘‘Silver halide sensitized gelatin process effects in holographic lenses recorded on Slavich PFG-01 plate,’’ Appl. Opt. 42, 805– 810共2003兲. 10. J. Rheims, J. Koser, and T. Wriedt, ‘‘Refractive-index measurements in the near-IR using an Abbe refractometer,’’ Meas. Sci. Technol. 8, 601– 605共1997兲.
11. C. Cali, M. Mosca, and G. Targia, ‘‘A simple apparatus for the deter-mination of the optical constants and thickness of absorbing thin films,’’ Opt. Commun. 191, 295–298共2001兲.
12. J. Jaglarz and M. Nowak, ‘‘Determination of optical constants and
average thickness of thin films on thick substrates using angular dis-tribution of intensity of reflected,’’ Thin Solid Films 278, 124 –128
共1996兲.
13. T. Globus, G. Ganguly, and P. R. Cabarrocas, ‘‘Optical characteriza-tion of hydrogenated silicon thin films using interference technique,’’
J. Appl. Phys. 88, 1907–1915共2000兲.
14. P. Yeh, Optical Waves in Layered Media, pp. 232–239, Wiley, New York共1991兲.
15. P. G. Charette, I. W. Hunter, and C. J. H. Brenan, ‘‘A complete high performance heterodyne interferometer displacement transducer for microactuator control,’’ Rev. Sci. Instrum. 63, 241–248共1992兲. 16. R. Dandliker, Y. Salvade, and E. Zimmermann, ‘‘Distance
measure-ment by multiple-wavelength interferometry,’’ J. Opt. 29, 105–114
共1998兲.
17. D. C. Su, M. H. Chiu, and C. D. Chen, ‘‘Simple two-frequency laser,’’
Precis. Eng. 18, 161–163共1996兲.
18. A. Yariv and P. Yeh, Optical Waves in Crystals, p. 62, Wiley, New York共1983兲.
19. J. Y. Lin and D. C. Su, ‘‘A new type of optical heterodyne polarime-ter,’’ Meas. Sci. Technol. 14, 55–58共2003兲.
20. M. H. Chiu, J. Y. Lee, and D. C. Su, ‘‘Complex refractive-index measurement based on Fresnel’s equations and the uses of heterodyne interferometry,’’ Appl. Opt. 38, 4047– 4052共1999兲.
21. P. K. Rastogi, Optical Measurement Techniques and Applications, p. 66, Artech House, Boston, MA共1997兲.
Cheng-Chih Hsu received his MS degree
from the Institute of Applied Physics, Chung Yuan Christian University, Taiwan, in 1998, and is now working toward a PhD degree in optical metrology at the Institute of Electro-Optical Engineering of National Chiao Tung University. His current re-search activities are optical metrology and nondestructive testing.
Jiun-You Lin received his MS degree from
the Institute of Electro-Optical Engineering of National Chiao Tung University, Taiwan, in 2000, and is now working toward a PhD degree in optical metrology at the Institute of Electro-Optical Engineering of National Chiao Tung University. His current re-search activities are optical metrology and measurement of optical constants of a chi-ral medium.
Kun-Huang Chen received his BS degree
in physics from Chung Yuan Christian Uni-versity, Taiwan, in 2000, and his PhD de-gree from the Institute of Electro-Optical Engineering of National Chiao Tung Uni-versity, Taiwan, in 2004. He joined the fac-ulty of Feng Chia University in 2004, where he is currently an assistant professor with the Department of Electrical Engineering. His current research activities are in optical metrology and optical sensors.
Der-Chin Su received his BS degree in
physics from the National Taiwan Normal University in 1975 and his MS and PhD de-grees in information processing from the Tokyo Institute of Technology in 1983 and 1986, respectively. He joined the faculty of the National Chiao Tung University in 1986, where he is currently a professor with the Institute of Electro-Optical Engi-neering. His current research interests are in optical testing and holography.
Table 5 The values ofnandkfor PFG-01 obtained at (␣1,␣2).
(␣1,␣2) (11,12) n k (20,30) (4.508,2.835) 1.60921 0.000069 (30,40) (2.835,1.949) 1.60926 0.000071 (40,50) (1.949,1.372) 1.60922 0.000072 (50,60) (1.372,0.943) 1.60925 0.000072 (60,70) (0.943,0.595) 1.60923 0.00007