M.-S. Chen, P.S. Yu, and B. Liu (Eds.): PAKDD 2002, LNAI 2336, pp. 237-250, 2002. Springer-Verlag Berlin Heidelberg 2002
Based on Gravity Theory
Chien-Yu Chen, Shien-Ching Hwang, and Yen-Jen Oyang Department of Computer Science and Information Engineering
National Taiwan University, Taipei, Taiwan [email protected] [email protected]
Abstract. One of the main challenges in the design of modern clustering
algorithms is that, in many applications, new data sets are continuously added into an already huge database. As a result, it is impractical to carry out data clustering from scratch whenever there are new data instances added into the database. One way to tackle this challenge is to incorporate a clustering algorithm that operates incrementally. Another desirable feature of clustering algorithms is that a clustering dendrogram is generated. This feature is crucial for many applications in biological, social, and behavior studies, due to the need to construct taxonomies. This paper presents the GRIN algorithm, an incremental hierarchical clustering algorithm for numerical data sets based on gravity theory in physics. The GRIN algorithm delivers favorite clustering quality and generally features O(n) time complexity. One main factor that makes the GRIN algorithm be able to deliver favorite clustering quality is that the optimal parameters settings in the GRIN algorithm are not sensitive to the distribution of the data set. On the other hand, many modern clustering algorithms suffer unreliable or poor clustering quality when the data set contains highly skewed local distributions so that no optimal values can be found for some global parameters. This paper also reports the experiments conducted to study the characteristics of the GRIN algorithm.
Keyword: data clustering, hierarchical clustering, incremental clustering,
gravity theory.
Section 1. Introduction
Data clustering is one of the most traditional and important issues in computer science [3, 8, 9]. In recent years, due to emerging applications such as data mining and document clustering, data clustering has attracted a new round of attention [6, 14]. One of the main challenges in the design of modern clustering algorithms is that, in many applications, new data sets are continuously added into an already huge database. As a result, it is impractical to carry out data clustering from scratch whenever there are new data instances added into the database. One way to tackle this challenge is to incorporate a clustering algorithm that operates incrementally.
The development of incremental clustering algorithms can be traced back to 1980s [4, 5]. In 1989, Fisher proposed CLASSIT [5], which is an alternative version of COBWEB [4] and was designed for handling numerical data sets. However,
CLASSIT assumes that the attribute values of the clusters are normally distributed. As a result, its application is limited. In recent years, several incremental clustering algorithms have been proposed, including BIRCH [15], the clustering algorithm proposed by Charikar et al. in 1997 [1], Incremental DBSCAN [2], and the clustering algorithm proposed by Ribert et al. in 1999 [12]. However, the algorithm proposed by Charikar et al. employs a clustering quality measure that may not be appropriate for some real data sets, especially when the data set contains mainly arbitrarily shaped clusters. Incremental DBSCAN lacks a desirable feature for some applications in biological, social, and behavior studies, because it does not output a clustering dendrogram. For such applications, creating a clustering dendrogram is an essential work due to the need to construct taxonomies [9]. The algorithm proposed by Ribert et al. suffers higher time complexity and, therefore, is not suitable for handling large databases. BIRCH is an incremental hierarchical clustering algorithm with O(n) time complexity. However, as will be elaborated in the following, BIRCH may fail to deliver satisfactory clustering quality in some cases.
This paper presents the GRIN algorithm, a novel incremental hierarchical clustering algorithm for numerical data sets based on gravity theory in physics. As the experiments conducted in this study reveal, the GRIN algorithm delivers favorite clustering quality in comparison with the BIRCH algorithm and generally features O(n) time complexity. One main factor that makes the GRIN algorithm able to deliver favorite clustering quality is that the optimal parameters settings in the GRIN algorithm are not sensitive to the distribution of the data set. On the other hand, parameter setting is a main problem for many modern clustering algorithms and could lead to unreliable or poor clustering quality. As Han and Kamber summarized in [6], “Such parameter settings are usually empirically set and difficult to determine, especially for real-world, high-dimensional data sets. Most algorithms are very sensitive to such parameter values: slightly different settings may lead to very different clusterings of the data. Moreover, high-dimensional real data sets often have very skewed distributions such that their intrinsic clustering structure may not be characterized by global density parameters.” In the BIRCH algorithm, there is a global parameter that controls the diameter the leaf subclusters. As the experiments conducted in this study reveal, this factor along with dependence on input data ordering cause the BIRCH algorithm unable to deliver satisfactory clustering quality in some cases. Fig. 1 presents an example. In this example, θ denotes the threshold imposed on the diameters of leaf subclusters and it is assumed that distance(instance1, instance2) < θ, distance(instance2, instance3) < θ, and distance(instance1, instance3) > θ. As the example shows, if the data is inputted in the following order 1 → 2 → 3 …, then data instance 2 will be clustered with data instance 1 instead of with data instance 3. Such a clustering result is not in conformity with what we consider
Fig. 1. An case in which BIRCH may fail to deliver satisfactory clustering quality.
natural clusters. It is certain that this problem can be resolved by setting θ to a smaller value. However, since θ is a global parameter automatically set based on some system metrics, it could occur that the setting is not appropriate for some leaf subclusters. Though the optional phase 4 of the BIRCH algorithm can be carried out to remove some of the flaws like the one shown in Fig. 1, this option is not applicable, when BIRCH is invoked to perform incremental clustering.
As mentioned above, the time complexity of the GRIN algorithm is generally O(n). This argument holds, provided that the spatial distribution of the new data instances that are continuously added into the data set is similar to that of the data instances already in the data set. Even if the spatial distributions of the new data set and the existing data set are very different, it does not imply that the linearity of time complexity no longer holds, because the GRIN algorithm keeps flattening and pruning the clustering dendrogram as new data instances continue to arrive. Only when the incoming data instances continue to form brand new clusters far away from existing clusters, will the time complexity of the GRIN algorithm approaches O(n2).
In the following part of this paper, section 2 discusses how the GRIN algorithm works. Section 3 describes the agglomerative hierarchical clustering algorithm that the GRIN algorithm invokes to construct the clustering dendrogram. Section 4 reports the experiments conducted to study the characteristics of the GRIN algorithm. Finally, concluding remarks are given in section 5.
Section 2. The GRIN Algorithm
This section describes how the GRIN algorithm works. The GRIN algorithm operates in two phases. In both phases, it invokes the gravity-based agglomerative hierarchical clustering algorithm presented in next section to construct clustering dendrograms. One key idea behind the development of the GRIN algorithm is that any arbitrarily shaped cluster can be represented by a set of spherical clusters as exemplified in Fig. 2. Therefore, spherical clusters are the primitive building blocks of the clustering dendrogram derived. Note that, though any two clusters contain disjoint sets of data instances, the spheres defined by their respective centroids and radii may overlap. The centroid of a cluster is defined to be the geometric center of the data instances in the
(a) A cluster of arbitrary shape. (b) Representation of the arbitrarily shaped cluster by a set of spherical clusters.
Fig. 2. An example demonstrating how an arbitrarily shaped cluster can be represented by a set
of spherical clusters.
cluster and the radius is defined to be the maximum distance between the centroid and the data instances.
In the GRIN algorithm, it is assumed that all the incoming data instances are first buffered in an incoming data pool. In the first phase of the algorithm, a number of samples are taken from the incoming data pool and the GRACE algorithm, the gravity-based agglomerative hierarchical clustering algorithm described in section 3, is invoked to build a clustering dendrogram for these samples. Actually, how sampling is carried out is not a concern with respect to clustering quality, because, as will be shown in the later part of this paper, the clustering quality of the GRIN algorithm is immune from how incoming data instances are ordered. However, the order of incoming data instances may impact the execution time of the second phase of the GRIN algorithm.
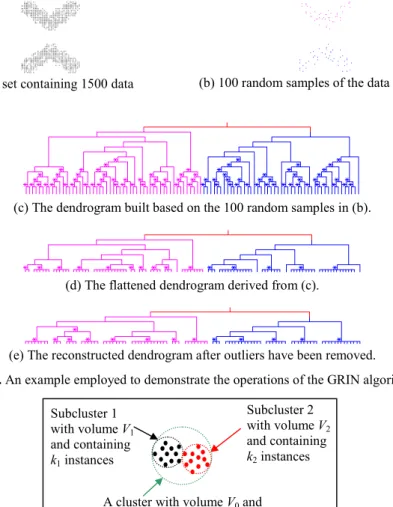
Fig. 3 presents an example that illustrates the operations carried out by the GRIN algorithm. Fig. 3(a) shows the data set and Fig. 3(b) shows 100 random samples taken from the data set. Fig. 3(c) depicts the dendrogram built based on the samples. Each node in the clustering dendrogram corresponds to a cluster of data samples. A cluster is said to be in the spherical shape, if the cluster satisfies either one of the following two conditions:
(1) The cluster contains less than Min data instances, where Min is a parameter to be set based on the statistical sense discussed in the following.
(2) The cluster contains Min or more data instances and passes the statistical test described in the following.
A cluster containing less than Min data instances is considered as a spherical cluster by default, because such a cluster does not contain sufficient number samples for any meaningful statistical test to be conducted. Therefore, we just trust GRACE, the gravity- based clustering algorithm, for its capability of identifying spherical clusters of small size. Concerning a cluster containing Min or more data instances, the chi-square goodness of fit test [7] is conducted. Fig. 4 presents an example that illustrates the statistical test. The hypothesis of the statistical test is that the data instances of the cluster are uniformly distributed in the sphere defined by the centroid and the radius of the cluster. Accordingly, for the case shown in Fig. 4, the chi-square test of goodness of fit is applied to determine whether the distributions of the data instances in the following 3 subspaces conform with the hypothesis or not:
(1) The subspace enclosed by the sphere of subcluster 1; (2) The subspace enclosed by the sphere of subcluster 2;
(3) The subspace enclosed by the sphere of the parent cluster but outside subcluster 1 and subcluster 2.
The parent cluster is said to be in the spherical shape, if
(
) (
)
[
(
)
]
(
0 1 2)
0 2 2 0 2 1 0 0 2 2 0 2 2 0 1 2 0 1 1 α χ µ µ µ µ µ µ ≤ ⋅ − − ⋅ − − + ⋅ ⋅ − + ⋅ ⋅ − V V V V V V V V k V V k (1) , where µ0 =(k1+k2)/V0 and 2 αχ is a threshold for the chi-square distribution of 2 degrees of freedom. In general, if the parent cluster of concern contains m subclusters, then the chi-square test with m degrees of freedom is conducted. In the statistical test, if one of the child subcluster contains only one single data instance, then the radius of the child cluster is defined to be one half of the distance between
(a) The data set containing 1500 data instances
(b) 100 random samples of the data set in (a).
(c) The dendrogram built based on the 100 random samples in (b).
(d) The flattened dendrogram derived from (c).
(e) The reconstructed dendrogram after outliers have been removed.
Fig. 3. An example employed to demonstrate the operations of the GRIN algorithm.
Fig. 4. An example illustrating the statistical test of spherical clusters.
the instance and its nearest neighbor. Note that applying the chi-square goodness of fit in identifying spherical clusters is an empirical mechanism in some sense, as inequality (1) above assumes that the spheres of subclusters 1 and 2 do not overlap and both are completely enclosed by the sphere of the parent cluster.
In Fig. 3(c), the clusters that pass the spherical cluster criterion described above are marked by “*”. Note that, the test described here is not applicable to the so-called primitive clusters, i.e. those clusters that contain single data instance. In the following discussion, such clusters are treated as primitive spherical clusters.
The next operation performed in the first phase of the GRIN algorithm is to flatten and prune the bottom levels of the clustering dendrogram in order to derive the so-called tentative dendrogram. It is so-called the tentative dendrogram, because its structure may be modified repetitively in the second phase of the GRIN algorithm. In the flattening process, a spherical cluster in the original dendrogram will become a leaf cluster in the tentative dendrogram, if it satisfies all of the following three conditions: Subcluster 1 with volume V1 and containing k1 instances Subcluster 2 with volume V2 and containing k2 instances
A cluster with volume V0 and
(1) The cluster is of spherical shape;
(2) If the cluster has descendents, all of its descendents are spherical clusters; (3) Its parent does not satisfy both conditions (1) and (2) above.
The structure under a leaf cluster in the original dendrogram is then flattened so that all the data instances under the leaf cluster become its children. Fig. 3(d) shows the dendrogram derived from flattening the dendrogram depicted in Fig. 3(c).
In the final step of the first phase of the algorithm, the user may conduct an optional operation to remove outliers from the dendrogram and put them into a tentative outlier buffer. These outliers may form new clusters with the data instances that come in later. The user may set a threshold to screen clusters based on their densities. If the density of a cluster does not exceed the threshold, then the cluster is considered as containing only outliers and is removed. How the threshold should be set really depends on the user's definition of outliers. After the outliers are removed, the tentative dendrogram is generated.
It is recommended that, after the outliers are removed, construction of the tentative dendrogram is conducted one more time to re-generate the tentative dendrogram. The reason is that presence of outliers may cause clustering quality to deteriorate, if outliers are in large number. Fig. 3(e) shows the reconstructed tentative dendrogram.
There are three pieces of information recorded for each cluster in the tentative dendrogram. These three pieces of information are (1) the centroid, (2) the radius, and (3) the mass of the cluster. The radius of a cluster is defined to be the maximum distance between the centroid and the data instances in this cluster. The mass of a cluster is defined to be the number of data instances that it contains. In other words, it is assumed that the mass of each single data instance is equal to unity.
In the second phase of the GRIN algorithm, the data instances in the incoming data pool are examined one by one. For each data instance, the second-phase algorithm checks whether it falls in the spheres of some leaf clusters in the tentative dendrogram. If the data instance falls in exactly one leaf cluster, then it is inserted into that leaf cluster. If the data instance falls in the spheres of two or more leaf clusters, then the gravity theory is applied to determine which leaf cluster the data instance should belong to. That is, the leaf cluster that imposes the largest gravity force on the data instance wins. Note here that, though every pair of leaf clusters contain disjoint sets of data instances, their spheres defined by their respective centroids and radii may overlap. The third possibility is that the input data instance does not fall in any leaf cluster. In this case, the data instance may be an outlier and a test is conducted to check that. The gravity theory is first applied to determine which leaf cluster imposes the largest gravity force on the data instance. Then, a test is conducted to determine whether this leaf cluster would still satisfy the criterion of being a spherical cluster, if the data instance were added into the cluster. If yes, then the data instance is added into that leaf cluster. If no, the data instance is currently an outlier to the tentative dendrogram and is therefore put into the tentative outlier buffer temporarily. The data instance, however, may form a cluster with other data instances that are already in the tentative outlier buffer or that come in later.
Once the number of data instances in the tentative outlier buffer exceeds a threshold, the gravity-based agglomerative hierarchical clustering algorithm described in section 3 is invoked to construct a new tentative dendrogram. In this reconstruction process, the primitive objects are the leaf clusters in the current tentative dendrogram and the data instances in the tentative outlier buffer. When a new tentative
dendrogram has been generated, the same flattening and pruning process invoked in the first phase is conducted and the same criteria is applied to remove the outliers from the new tentative dendrogram. It could occur that the tentative outlier buffer overflows. Should this situation occurs, those data instances that have been in the tentative outlier buffer longest can be treated as outliers and removed from the buffer.
As far as time complexity of the GRIN algorithm is concerned, the time complexity of the first-phase is a constant, as long as the number of samples taken in the first phase is not a function of the size of the data set. It has been shown in [10] that the time complexity of the GRACE algorithm, the hierarchical clustering algorithm invoked by the GRIN algorithm to construct dendrograms, is O(n2).
However, as long as the number of samples is constant, then the time taken by the first phase is a constant.
The analysis of the time complexity of the second phase is a little bit complicated, because it depends on whether the clustering dendrogram will grow indefinitely or not, as new data instances are continuously added into the data set. One important observation regarding the operations of the second phase algorithm is that, if the samples taken in the first phase are good representatives of the entire data set, then most data instances processed in the second phase will fall into one of the leaf clusters in the tentative dendrogram and the structure of the tentative dendrogram will remain mostly unchanged. Even if the spatial distribution of the new data instances that will be continuously added into the data set is very different from that of the data instances that are already in the data set, it does not imply that the dendrogram will continue to grow indefinitely, because the GRIN algorithm keeps flattening and pruning the dendrogram in the second phase. As long as the dendrogram does not grow indefinitely, then the time complexity of the second phase is O(n). The reason is that the time taken to examine each incoming data instance is constant and the time taken to reconstruct the dendrogram in the second phase is bounded, since the size of the tentative outlier buffer is fixed and the number of leaf clusters in the dendrogram is bounded. Only when the incoming data instances keep forming new clusters far away from existing clusters, will the dendrogram continues to grow indefinitely. In this case, the time complexity of the GRIN algorithm is O(n2).
Section 3. The Gravity-Based Hierarchical Clustering Algorithm
This section discusses the gravity-based hierarchical clustering algorithm that is invoked by the GRIN algorithm for constructing the clustering dendrogram. This algorithm is called the GRACE algorithm, which stands for GRAvity-basedClustering algorithm for the Euclidean space. The GRACE algorithm simulates how
a number of water drops move and interact with each other in the cabin of a spacecraft. Due to the gravity force, the water drops in the cabin of a spacecraft will move toward each other. When these water drops move, they will also experience resistance due to the air in the cabin. Whenever two water drops hit, which means that the distance between these two drops is less than the lumped sum of their radii, they merge to form one new and larger water drop. In the simulation model, the merge of water drops corresponds to forming a new, one-level higher cluster that contains two existing clusters. The air resistance is intentionally included in the
simulation model in order to guarantee that all these water drops eventually merge into one big drop regardless of how these water drops spread in the space initially. An analysis of why the GRACE algorithm is guaranteed to terminate and its main characteristics can be found in [10, 11].
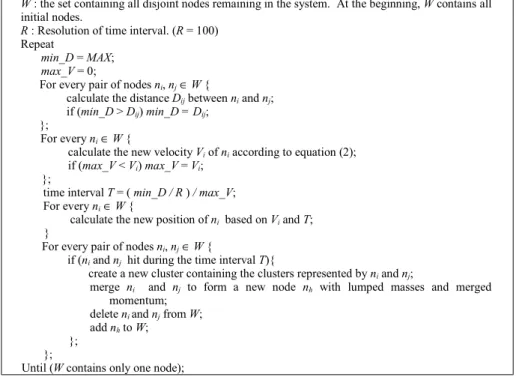
Fig. 5 shows the pseudo-code of the GRACE algorithm. Basically, the GRACE algorithm iteratively simulates the movement of each node during a time interval and check for possible merge. One key operation in the GRACE algorithm is to compute the velocity of each disjoint node remaining in the system. In the GRACE algorithm, equation (2) below is employed to compute the velocity of a node during one time interval. The derivation of equation (2) involves solving a differential equation under several pragmatical assumptions and is elaborated in [11].
r n i g j C F v i
∑
= node ! (2) , where∑
i n gi F node !is the vector sum of the gravity forces that node nj experiences from
all the other disjoint nodes remaining in the physical system at the beginning of the time interval, and Cr is the coefficient of air resistance. According to gravity theory,
) , ( distance ) of mass )( of mass ( j i k j i g g n n n n C F!i = ⋅ ,
where Cg is a coefficient. In the physical world, k = 2. However, in the GRACE
algorithm, k can be any positive integer number.
Section 4. Experiments
This section reports the experiments conducted to study the following 4 issues concerning the GRIN algorithm.
(1) How the clustering quality of the GRIN algorithm compares with the BIRCH algorithm.
(2) Whether the GRIN algorithm is immune from the order of input data.
(3) Whether the optimal settings of the parameters in the GRIN algorithm are sensitive to the distribution of the input data set.
(4) How the GRIN algorithm performs in terms of execution time in real applications.
Table 1 shows how the parameters in the GRIN and GRACE algorithms are set in the experiments.
Fig. 5. The pseudo-code of the GRACE algorithm.
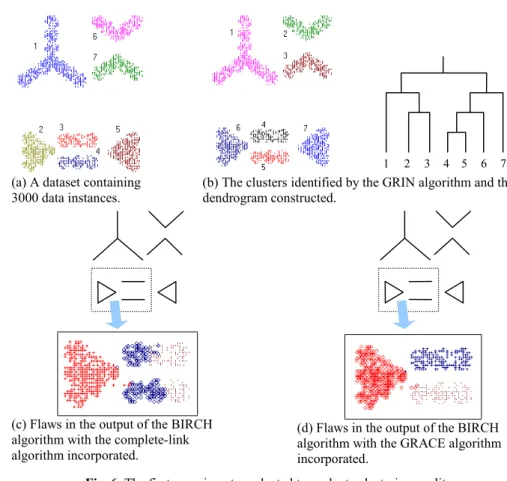
Fig. 6(a) shows a data set used in the experiments. In Fig. 6(a), natural clusters are identified according to human’s intuition and are numbered. Fig. 6(b) depicts the clusters identified by the GRIN algorithm and the dendrogram constructed. In this experiment, data is fed to the GRIN algorithm one natural cluster by another natural cluster in the following order 1 → 2 → 3 → … . For providing better visualization
GRACE
k : Order of the distance term gravity force formula
10 Cg : Coefficient of gravity force 1
Cr : Coefficient of air resistance 100
M0 : Initial mass of each node 1
D0 : Material density of the node 1
GRIN
sample size 500
size of tentitive outlier buffer 500
Min 3
Significance of the χ2test 0.01
Table 1. Parameter settings of the GRIN and GRACE algorithms in the experiments.
quality, only the clusters at the top few levels of the dendrogram are plotted. The result in Fig. 6(b) shows that the GRIN algorithm is able to identify natural clusters flawlessly. Several runs of the GRIN algorithm were executed with the data fed to the algorithm in different orders. In one particular run, the data was fed to the algorithm also one natural cluster by another natural cluster but in the reverse order.
W : the set containing all disjoint nodes remaining in the system. At the beginning, W contains all initial nodes.
R : Resolution of time interval. (R = 100) Repeat
min_D = MAX; max_V = 0;
For every pair of nodes ni, nj∈ W {
calculate the distance Dij between ni and nj; if (min_D > Dij) min_D = Dij;
};
For every ni∈ W {
calculate the new velocity Vi of ni according to equation (2); if (max_V < Vi) max_V = Vi;
};
time interval T = ( min_D / R ) / max_V; For every ni∈ W {
calculate the new position of ni based on Vi and T; }
For every pair of nodes ni, nj∈ W {
if (ni and nj hit during the time interval T){
create a new cluster containing the clusters represented by ni and nj;
merge ni and nj to form a new node nh with lumped masses and merged momentum;
delete ni and nj from W; add nh to W;
}; };
In the remaining runs, data was fed to the algorithm in a random order. The outputs of all these separate runs of the GRIN algorithm are basically identical to what is depicted in Fig. 6(b). The experiment results show that the clustering quality of the GRIN algorithm is immune from the order of input data.
Fig. 6(c) and (d) depict the data clusters identified by the BIRCH algorithm with different hierarchical clustering algorithms incorporated. The BIRCH algorithm is employed for comparison, because it is a well-known incremental hierarchical clustering algorithm that features O(n) time complexity. In Fig. 6(c), the portion of the data set in which the BIRCH algorithm with the complete-link algorithm incorporated fails to deliver reasonable clustering quality is enlarged and data instances belonging to different clusters are marked by different symbols. In this case, the BIRCH algorithm mixes the data instances from natural clusters 2, 3, and 4. BIRCH’s failure is due to two factors. First, BIRCH uses a global parameter to control the diameter of leaf subclusters. Therefore, as exemplified in Fig. 1, it could occur that no optimal value for this parameter can be found when the local distributions of the data set are highly skewed. Second, the complete-link algorithm itself suffers bias towards spherical clusters [10, 11]. Fig. 6(d) reveals that the clustering quality of BIRCH is improved when the GRACE algorithm is incorporated instead of the complete-link algorithm. The GRACE algorithm contributes to improvement of clustering quality, because the complete-link algorithm suffers bias towards spherical clusters in a much higher degree than the GRACE algorithm [10, 11]. Nevertheless, there are still a few flaws in Fig. 6(d) due to the parameter setting problem with the BIRCH algorithm.
Fig. 7(a) depicts the clusters identified by the GRIN algorithm and the dendrogram constructed for another data set. Fig. 7(b) shows the clusters outputted by the BIRCH algorithm with the GRACE algorithm incorporated. Again, several flaws are observed as marked by the squares.
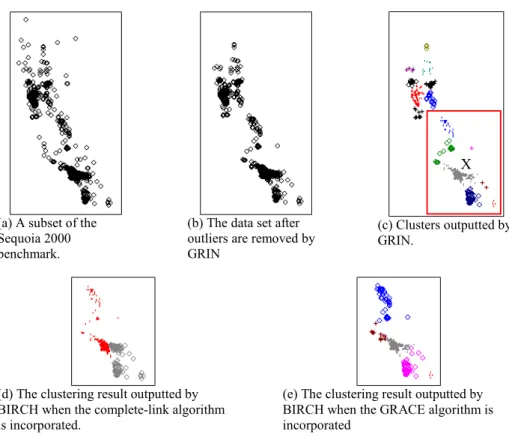
In the third experiment, a subset of the Sequoia 2000 benchmark [13] is used to test how the GRIN algorithm performs in dealing with a real data set. The subset contains the locations of all the high schools in California. Fig 8(a) plots the 989 location instances in the subset. Fig. 8(b) depicts the outlook of the data set after outliers are removed by GRIN algorithm. In this case, the threshold is set to 1% of the average density of all the leaf clusters. After the outliers are removed, the remaining data set contains 946 location instances. Fig. 8(c) shows the clusters outputted by the GRIN algorithm. In Fig. 8(c), different clusters are plotted using different symbols. We also use the data set shown in Fig. 8(b) to test the how the BIRCH algorithm performs when operating with the complete-link algorithm and the GRACE algorithm, respectively. Due to the limited space, we only show the clustering results inside the rectangle box in Fig. 8(c). As shown in Fig. 8(d) and 8(e), in both cases, the largest natural cluster in the rectangle region, the cluster marked by X in Fig. 8(c) is divided into two parts and the left part is clustered with the location instances further to the left.
(a) A dataset containing
3000 data instances. (b) The clusters identified by the GRIN algorithm and thedendrogram constructed.
(c) Flaws in the output of the BIRCH algorithm with the complete-link algorithm incorporated.
(d) Flaws in the output of the BIRCH algorithm with the GRACE algorithm incorporated.
Fig. 6. The first experiment conducted to evaluate clustering quality.
(a) The clusters identified by the GRIN algorithm and the
dendrogram constructed. (b) Clusters identified by theBIRCH algorithm with the GRACE algorithm incorporated.
Fig. 7. The second experiment conducted to evaluate clustering quality.
9 3 6 1 4 2 5 8 7
(a) A subset of the Sequoia 2000 benchmark.
(b) The data set after outliers are removed by GRIN
(c) Clusters outputted by GRIN.
(d) The clustering result outputted by BIRCH when the complete-link algorithm is incorporated.
(e) The clustering result outputted by BIRCH when the GRACE algorithm is incorporated
Fig. 8. Experiment conducted to show how the GRIN algorithm performs with real datasets.
Experiments have been conducted to check whether the parameter settings in the GRIN algorithm are sensitive to the distribution of the data set. Table. 1 shows how the parameters are set in the experiments. Many modern clustering algorithms may fail to deliver satisfactory clustering quality, because the data set contains highly skewed local distributions [6]. Concerning the GRACE algorithm invoked in the GRIN algorithm, it has been shown in [11] that the optimal ranges for the parameters to be set are wide and are essentially not sensitive to the distribution of the data set. As far as the GRIN algorithm is concerned, the data sets shown in Fig. 6 and 7 have been scaled up 2, 4, and 8 times to conduct experiments. The experimental results reveal that the GRIN algorithm outputs identical dendrograms regardless of the scaling factor. This implies that the clustering quality of the GRIN algorithm is immune from the distribution of the data set.
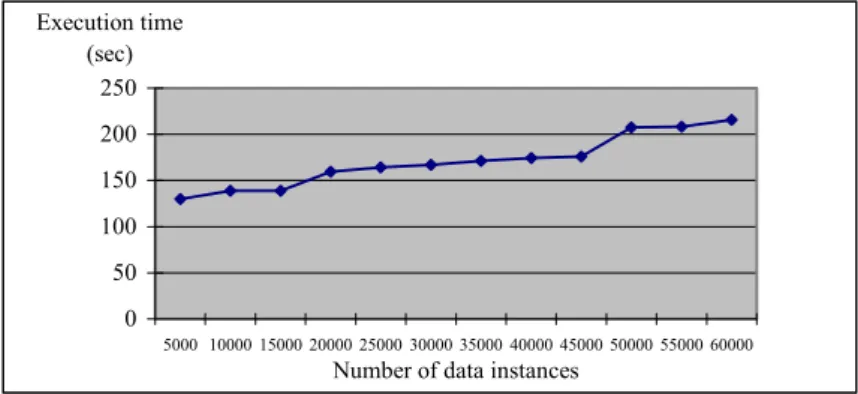
Fig. 9 shows how the execution time of the GRIN algorithm increases with the number of data instances in the data set. The experiment was conducted on a machine equipped with a 600-MHz Intel Pentium-III CPU and 328 Mbytes main memory and running Microsoft Window 2000 operating system. The dataset used is the point data
0 50 100 150 200 250 5000 10000 15000 20000 25000 30000 35000 40000 45000 50000 55000 60000 Number of data instances
Execution time (sec)
Fig. 9. Experiment conducted to test the performance of the GRIN algorithm.
in Sequoia 2000 Earth benchmark [13], which contains 62556 data instances in total. In this experiment, we ran the GRIN algorithm 3 times with different initial samples randomly selected from the benchmark dataset. The result reveals that the GRIN algorithm generally features O(n) time complexity. One may observe that there are two sections with steeper slopes, one is around 20000 and another one is around 50000. The abrupt rises of execution time are due to the operation to reconstruct the dendrogram in the second phase of the GRIN algorithm.
Section 5. Conclusions
This paper presents the GRIN algorithm, an incremental hierarchical clustering algorithm based on gravity theory in physics. The incremental nature of the GRIN algorithm implies that it is particularly suitable for handling the already huge and still growing databases in modern environments. Its hierarchical nature provides a highly desirable feature for many applications in biological, social, and behavior studies due to the need to construct taxonomies. In addition, the GRIN algorithm delivers favorite clustering quality and generally features O(n) time complexity. The experiments conducted in this study reveal that the clustering quality of the GRIN algorithm is immune from the order of input data and the optimal parameter settings are not sensitive to the distribution of the data set.
There are some issues regarding the GRIN algorithm that deserve further study. One interesting issue is the approach to identify outliers. Due to different natures of applications, some may require more strict criteria for identifying outliers, while the other may require less strict criteria. Therefore, alternative approaches may be employed for achieving different goals. Another interesting issue is the approach to prune the dendrogram. If a more aggressive approach was employed, then the efficiency of the GRIN algorithm would be upgraded, because the dendrogram would be smaller in terms of the number of nodes. However, clustering quality may be traded. Again, different applications may impose different criteria. Therefore, this issue deserves further study.
References:
1 M. Charikar, C. Chekuri, T. Feder and R. Motwani: Incremental Clustering and Dynamic Information Retrieval. In Proceedings of the 29th Annual ACM Symposium on Theory of
Computing (STOC-97), 1997, pp. 626-634.
2 M. Ester, H.-P. Kriegel, J. Sander, M. Wimmer, and X. Xu. Incremental clustering for mining in a data warehousing environment. In Proceedings of 24th International Conference
on Very Large Data Bases (VLDB-98), 1998, pp. 323-333. 3. B. Everitt, Cluster analysis, New York : Halsted Press, 1980.
4 D. Fisher, Improving inference through conceptual clustering, In Proceedings of 6th
National Conference on Artificial Intelligence (AAAI-87), 1987, pp. 461-465.
5 J. Gennari, P. Langley, and D. Fisher, Models of incremental concept formation, Artificial Intelligence, vol. 40, pp. 11-61, 1989.
6. J. Han, M. Kamber, Data Mining: Concepts and Techniques, San Francisco : Morgan Kaufmann Publishers, 2000.
7 R. V. Hogg and E. A. Tanis, Probability and statistical inference, New Jersey : Prentice-Hall, 2001.
8. A.K. Jain, R.C. Dubes, Algorithms for clustering data, Englewood Cliffs, N.J. : Prentice Hall, 1988.
9. A.K. Jain, M.N. Murty, P.J. Flynn, Data Clustering: A Review, ACM Computing Surveys, vol. 31, no. 3, pp. 264-323, 1999.
10 Yen-Jen Oyang, Chien-Yu Chen, and Tsui-Wei Yang, A Study on the Hierarchical Data Clustering Algorithm Based on Gravity Theory, In Proceedings of 5th European Conference
on Principles and Practice of Knowledge Discovery in Databases (PKDD-01), 2001, pp. 350-361.
11 Yen-Jen Oyang, Chien-Yu Chen, Shien-Ching Hwang, and Cheng-Fang Lin, Characteristics of a Hierarchical Data Clustering Algorithm Based on Gravity Theory, Technical Report of NTUCSIE 02-01.
(Available at http://mars.csie.ntu.edu.tw/~cychen/publications_on_dm.htm)
12 A. Ribert, A. Ennaji, and Y. Lecourtier, An incremental Hierarchical Clustering, In Proceedings of 1999 Vision Interface Conference, 1999, pp. 586-591.
13. M. Stonebraker, J. Frew, K. Gardels and J. Meredith, The Sequoia 2000 Storage Benchmark, In Proceedings of 1993 ACM-SIGMOD International Conference on Management of Data (SIGMOD-93), 1993, pp. 2-11.
14 I. H. Witten, Data mining: practical machine learning tools and techniques with Java implementations, San Francisco, Califonia : Morgan Kaufmann, 2000.
15. T. Zhang, R. Ramakrishnan, M. Livny, BIRCH: An Efficient Data Clustering Method for Very Large Databases, In Proceedings of the 1996 ACM-SIGMOD International Conference on Management of Data (SOGMOD-96), Jun. 1996, pp. 103-114.