行政院國家科學委員會
獎勵人文與社會科學領域博士候選人撰寫博士論文
成果報告
Productivity, Corporate Investment, and Liquidity
核 定 編 號 : NSC 95-2420-H-002-027-DR 獎 勵 期 間 : 95 年 08 月 01 日至 96 年 07 月 31 日 執 行 單 位 : 國立臺灣大學國際企業學系暨研究所 指 導 教 授 : 洪茂蔚 博 士 生 : 邱琦倫 公 開 資 訊 : 本計畫可公開查詢
中 華 民 國 97 年 05 月 16 日
國立臺灣大學管理學院國際企業學研究所
博士論文
Graduate Institute of International Business
College of Management
National Taiwan University
Doctoral dissertation
財務金融研究
Essays in Finance
邱琦倫
Chyi-Lun Chiou
指導教授:洪茂蔚 博士
Advisor: Mao-Wei Hung, Ph.D.
謝 辭
在論文即將付梓的此刻,內心的感動無言可喻,追尋多年的夢想終於成真。 這一切都必須感謝恩師 洪茂蔚老師多年來對我的照顧與指導。不論在知識上亦 或是在人生觀上 洪老師皆悉心的指引我, 老師的鼓勵與支持使我在面對逆境時 也能勇敢應對。能完成這個夢想,都要感謝 洪老師的引領。我希望未來可以不 辜負 老師的殷切期盼,在工作上能努力扮演好自己的角色。 感謝口試委員 陳思寬老師、 林丙輝老師、 葉疏老師與 董澍琦老師在論文 口試期間的不吝指導,讓本文可以更加精進。諸位口試委員的關懷與建議,在此 非常時刻對我而言更是意義非凡。這一路走來,還要感謝許多台大師長們對我的 照顧, 鍾經樊老師、 林修葳老師、 陳思寬老師、 管中閔老師、 周建富老師、 楊永斌老師、 劉錦添老師、 林明仁老師與 盧信昌老師,由於諸位老師的建議 與指導,讓我在求學的過程可以十分順遂。謝謝同窗好友慈暉、龍福、義杰、季 芸、智翔與瑞萱,銘淞學長、樂晴學姐、家豪學長與世忠學長,謝謝你們的關懷 與鼓勵,有你們的陪伴真好。 最後感謝我親愛的家人,謝謝你們長久以來對我的支持與容忍。謝謝親愛的 老公正偉與我分享喜怒哀樂,也謝謝婆婆容忍這個不及格的媳婦。對於我的小寶 貝翰翰,媽媽心中總是存在一份歉意,沒能做一個稱職的母親。更要感謝教養我 的父母,謝謝你們賦予我的一切一切,女兒無以回報。也希望將這份小小的成果, 傳遞給在天上的祖父與祖母。 感謝所有愛我與我所愛的人,以及默默幫助我的師長們,希望與你們分享我 此刻的喜悅。 邱琦倫 2008.5中文摘要
長久以來,財務經濟學對於股票報酬率是否存在可預測性一直存在爭議。與 此同時,近年來股價異常波動的行為也吸引許多學者的關注。相較於報酬率的可 預測性,文獻對於資產報酬的波動性具有較高的共識。依據傳統的資產訂價理 論,高風險對應高報酬,由股價波動衡量資產報酬也是一種合理的評價方法。本 篇研究主要的目的在於利用不同風險的概念,探討資產報酬的行為特性。除了系 統性風險之外,本篇著重於非系統性風險(個別風險)的討論。我們將藉由兩個 面相進行分析。首先,我們將以公司的獲利性出發,分析獲利性的變動如何影響 資產的報酬。其次,我們將由公司的投資決策思考,分析投資的不確定性如何主 導資產的價值與行為。前者的經濟直覺源於公司的價值由其獲利性主導。後者則 主張公司的價值是由其擁有的資產決定。研究顯示,獲利性的波動與投資的不確 定性在資產報酬行為上提供完全相反的訊息。 首先,在本文的第二章中,我們將利用報酬波動的訊息分析股票的預期報 酬。依據 Pástor and Veronesi (2003)所建立的評價模型之中,ROE(股東權益報酬 率)的波動值與帳面市值比具有一個負向關係,同時該波動值也會影響資產的平 均報酬與變異數。研究顯示,ROE 波動值與未來股票報酬率呈現顯著的負相關。 更重要的是,相較於每股盈餘或股利收益率等傳統預測因子,該相關性並不會因 加入市值規模與帳面市值比等以價格為基礎的解釋變數而消失。依據 Wei and Zhang (2006)的研究顯示,ROE 波動值可以真實反映資產報酬波動的特性,尤其 是個別風險的部分。因此,透過 ROE 波動值的訊息將有助於我們瞭解非系統性 風險的評價問題。 接著,在本文的第三章中,我們將分析投資的不確定性如何影響報酬的行 為。此篇結合投資與流動性風險的概念探討投資不確定性如何主導資產價值。投該價值。兩相權衡之下,公司必須選擇一個次佳點進行投資的動作。相較於其他 投資與融資的研究,本篇主張在融資限制之下投資不會被迫放棄,而是可以選擇 遞延。研究顯示,當投資不確定性愈高時,股票報酬也會愈高。
關鍵字:股票報酬可預測性; 個別風險; 獲利性; 學習效果; 投資不可逆性; 股東權益報酬波動值; 預期收益波動值。
Thesis Abstract
In asset pricing, it is well known that stock return and return volatility vary over time. Literature concerns issues abut whether stock returns are predictable and why stock returns are so volatile. Some literature focuses on the relationship between return and risk to examine how assets are priced. In particular, among these literatures systematic risks and idiosyncratic risks provide different explanations to stock returns. Examining the stock return behavior is critical in that asset allocation and hedge strategy are related to this evolution. The primary objective of this thesis is to investigate the stock return predictability base on firm level analysis. This thesis provides two different schemes in discussing this issue, including profitability base and investment base framework. The former states that the valuation of firm is from it profitability, while that latter asserts that the firm’s value is from assts that it holds. We investigate that return-on-equity and investment uncertainty govern the evolution of stock price in an opposite way. Overall, in addition to systematic risks we confirm that it is critical to analyze idiosyncratic risks in valuation.
The first part of this dissertation is to examine the stock return predictability through means of volatile volatility. Based on the work of Pástor and Veronesi (2003), we find that the book-to-market ratio and the price evolution, including average stock
return and return volatility, are governed by the firms’ profitability. It is straightforward to analyze stock returns by discussing firm’s return-on-equity. Evidence shows that in addition to size and value effects, variation in return-on-equity has the predictability in stock returns. We further demonstrate that this connection may contribute to the equity cash flow perspective and the risk argument of book-to-market ratio.
The second part of my dissertation incorporates investment issue in examining stock return behavior. Although recent studies has successfully proved that the value effect results from corporate investment decision, the association between investment uncertainty and stock returns is rarely touched. With irreversibility of investment and learning-by-doing effect, we show that less investment uncertainty follows lower stock returns. If firms face financial constraint in expansion, more investment uncertainty may force them to make suboptimal investment decisions and have more systematic risks.
Keyword: Stock return predictability; Idiosyncratic risks; Profitability;
Learning-by-doing; Irreversibility; Variation in return-on-equity; Expected earning volatility.
Contents
口試委員會審定書 ... Ⅰ
謝辭 ... Ⅱ
中文摘要 ... Ⅲ
英文摘要 ... Ⅴ
1 Introduction ... 1
2 The Predictive Ability of Variation in
Return-on-Equity... 4
2.1 Abstract ... 4
2.2 Introduction... 4
2.3 Literature Review... 14
2.4 Data and Preliminary Analysis... 17
2.5 Properties of Variation in return-on-equity ... 26
2.6 Fluctuation of Profitability and Cross Section
of Stock Returns... 35
2.7 The Source of the Predictive Ability of the
Variation in Return-on-equity ... 49
3
How Expected Earning Volatility Affects Stock
Returns ... 57
3.1 Abstract ... 57
3.2 Introduction ... 57
3.3 Literature Review... 63
3.4 The Model ... 66
3.5 The Optimal Investment Strategy... 70
3.6 The Behavior of Stock Returns ... 74
3.7 Empirical Evidence ... 78
3.8 Conclusion... 88
4
Conclusion
...90
Reference
...92
Figures
Figure 1: Time-series evolution of the standard deviation
of return-on-equity for portfolios sorted by
ME and BE/ME, 1980-2001... 24
Figure 2: Time-series evolution of the changes of return-on-equity
for portfolios sorted by ME and BE/ME,
1980-2001. ... 25
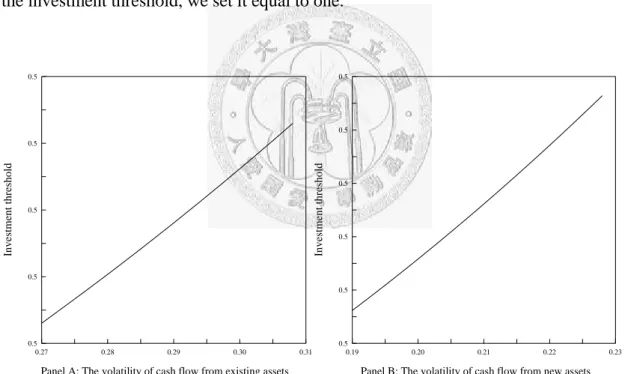
Figure 3: The effect of cash flows’ volatility on
the investment threshold. ... 72
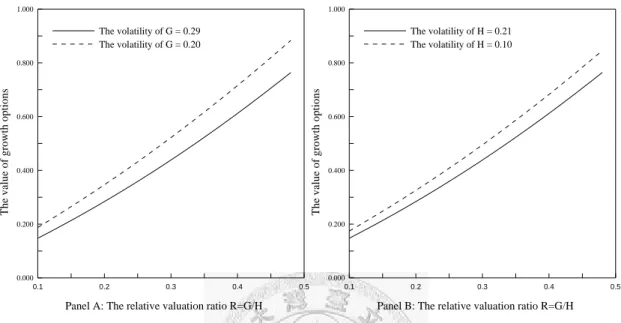
Figure 4: The effect of cash flows’ volatility on
the value of growth options. ... 74
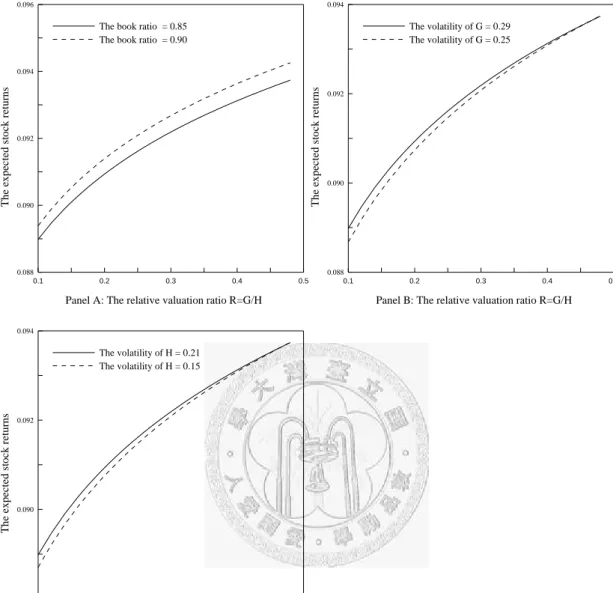
Figure 5: The effect of book ratio and cash flows’ volatility on
Tables
Table 1: Return-On-Equity and Its Sample Variance by
Sorts on Size and Book-to-Market Ratio,
July 1980 to June 2001 ... 21
Table 2: Summary Statistics of Portfolios Formed on Standard
Deviation of Return-on-Equity and Difference of
Return-on-Equity... 31
Table 3: Average Parameter Values from Cross-Sectional
Regressions of Monthly Stock Returns on Firm Size,
Book-to-Market Ratio, Leverage, Standard Deviation
of Return-on-Equity, and Difference
of Return-on-Equity ... 39
Table 4: Average Monthly Percent Returns for Portfolios Sorted
on Book-to-Market, Size, Standard Deviation of
Return-on-Equity, and Difference of
Return-on-Equity ... 47
Table 5: Regression analysis about the variation in
Table 6: Summary Statistics of Expected Earning Volatility... 80
Table 7: Monthly Stock Returns and Investment for Quintile
Portfolios Based on Expected Earning Volatility ... 83
Table 8: Average Parameter Values from Cross-Sectional
Regressions of Monthly Returns on Market Size,
Chapter 1
Introduction
In asset pricing it is well known that stock returns and return volatility vary over time. Literature concerns issues about whether stock returns are predictable and why stock returns are so volatile. These two issues have generated much attention not only because they relate to gains of investing but also because they have great impacts on hedging demand. Prior literature has applied aggregate macroeconomics point of view and firm level characteristics to examine these issues. The former aims at discussion about systematic risks, while the latter is plausible to investigate idiosyncratic risks. Researchers have noted that firm-level analysis provide more insights. Compared with volatile stock returns, the predictability of stock returns remains doubt.
We attempt to examine the behavior of stock returns based on two distinct schemes in this thesis. On the one hand, we try to rely on information from volatile stock returns to investigate average stock returns. On the other hand, we incorporate investing and financing problem to explore return behavior. These two topics have one thing in common: they both associate with idiosyncratic risks. As a result, both of them face the identical problem why idiosyncratic risks need to be priced. However, these two schemes describe stock returns in opposite ways. In the first part of this thesis, we apply information from profitability to explore the behavior of stock returns, including average returns and return volatility, and the book-to-market ratio. Our intuition relies on the fact that the valuation of a firm is from its profitability so that the valuation ratio and price evolution are governed by firm’s performance.
Referring to this connection, prior literature shows that the variation in return-on-equity is good at describing the upward trend of stock return volatility, especially the idiosyncratic stock return volatility (Campbell, Lettau, Malkiel, and Xu, 2001). Applying the variation in return-on-equity as proxy of idiosyncratic return volatility, we find there is a significantly negative association between this variation and average stock returns. Furthermore, we provide two explanations from book-to-market ratio to identify this negative relation, including the equity cash flow perspective and the risk argument. This research not only examines the relation between idiosyncratic risks and stock returns but also confirms the fact that the usefulness of book-to-market ratio is original from the variation in return-on-equity.
In the second part of this thesis, we incorporate investment decision in the firm valuation. Recent studies has successfully applies corporate investment to explain the value effect (Berk, Green, and Naik, 1999). At the same time, the issue about how investment uncertainty affects investment decision has generated much attention in prior literature. The connection between investment uncertainty and stock returns, however, is rarely investigated. The critical point is that the relation between uncertainty and investment is inclusive. In this research we incorporate investment and liquidity issues to examine how investment uncertainty affects the stock returns. If a firm has financial constraint in expansion, today’s investment opportunities cannot be exercised even though they are profitable. With the flexibility to postpone, the relationship between investment and liquidity can be altered. Evidence shows that liquidity constraint will force firms to make suboptimal investment decisions because investment uncertainty not only represents variation in future profit but also stands for potential future cash flow shortfall. Higher stock returns induced by more investment
uncertainty may result from exposing to more systematic risks or having higher cost of capital.
The organization of this thesis is as follows. We examine how and why the variation in return-on-equity, proxy of idiosyncratic return volatility, predicts average stock returns in Chapter 2. Incorporating investment and liquidity issue, we investigate how and why the expected earning volatility associates with average stock returns in Chapter 3. Some main conclusion remarks are presented in the final chapter.
Chapter 2
The Predictive Ability of Variation in
Return-on-equity for Stock Returns
2.1 Abstract
We examine the predictive power of the variation in return-on-equity for stock returns based on the implication of volatility feedback effect. Consistent with the rational valuation framework of Pástor and Veronesi (2003), we shows that portfolios sorted independently by size and book-to-market ratio are conditional on the variation in return-on-equity. We also empirically investigate that the variation in return-on-equity is useful in explaining portfolios stock returns as well as the individual stock returns on the cross section. We further shows that the predictive power of variation in return-on-equity is explained by the risk proxy argument and the equity cash flow perspective of book-to-market ratio. Moreover, the driving force behind these two perspectives about the value and size effect should rely on the connection between the variation in return-on-equity and the behavior of future cash flow. This supports relevance of fundamental accounting information about firm characteristics for explaining stock returns and indicates their application of predicting stock returns. Finally, evidence attributes to examine the relation between return volatility and expected returns in the cross section.
To examine the behavior of asset return, return predictability and excess volatility, is the main issue in the asset pricing literature. Researchers are also interested in documenting the association between risk and returns. It has long been recognized that both the expected stock return and its variation vary over time. Campbell, Lettau, Malkiel, and Xu (2001) find that the level of average stock return volatility has been increasing over time since 1960s. It seems plausible that varying return volatility may have important effects on required stock returns as well as the level of stock prices. The so-called volatility feedback effect suggests that stock price movements are associated with future volatility. Indeed, French, Schwert, and Stambaugh (1987), and Campbell and Hentschel (1992) find that asset returns and innovations from return volatility are negative correlated. If the volatility feedback effect is reliable, it may be useful to examine the return predictability issue through analysis of excess volatility.
The issue about return predictability faces a big challenge in the late of 1990s. There is a historically unprecedented rise in stock prices and other price-based ratio such as price/dividend ratio and price/earning ratio during these years. This rise has reduced the post-war return forecasting regression coefficient in half and weakened the predictive power of these ratios.1 At the same time, stock returns become more volatile in decades. In particular, Campbell, Lettau, Malkiel, and Xu (2001) show that the idiosyncratic stock return volatility has increased over time, while the volatility of stock market returns remains stable. Pástor and Veronesi (2003) (cross-sectional relations) and Wei and Zhang (2006) (time-series relations) examine that this volatile stock returns result from the increasing volatility of return-on-equity. If the association between variation in return-on-equity and return volatility is reliable (cross-sectional or
1
Because of the weak forecasting performance of price-dividend ratio, Lettau and Ludvigson (2002) construct a new proxy, log consumption-aggregate wealth ratio to predict stock returns.
time-series), it is straightforward to examine return predictability through the analysis of variability in profitability.
Despite the well-developed of research on the formal model of volatility feedback, we do not rely our analysis on the level of stock return volatility directly. In contrast with previous studies, we investigate the role of profitability on stock returns as this indicator can be directly linked to the excess volatility. In particular, this non-price measure induces firms to refine their performance and improves effectiveness of accounting information. Most importantly, it identifies that the behavior of stock returns can be explained by the changes of fundamental variables. Based on the rational valuation framework, Pástor and Veronesi (2003) show that market-to-book ratio and the dynamics of stock returns are governed by the firms’ profitability. They demonstrate that market-to-book ratio and return volatility increase with the total volatility of profitability; however, expected excess returns is only driven by systematic risk of profitability. If stock return volatility is driven by variation in return-on-equity as suggested by Pástor and Veronesi (2003), it seems plausible to analyze the volatile trend of return variance by discussing profitability. Indeed, Wei and Zhang inherit this concept and demonstrate that the downward trend in the level of return-on-equity and the upward trend in the volatility of return-on-equity attribute to the more volatile stock returns found in recent years. In this study, we apply the source of increasing stock return volatility, the variation in return-on-equity, as a reliable measure of idiosyncratic volatility to investigate the issue of return predictability.
There are still other possible measures of risk. French, Schwert, and Stambaugh (1987) examine other three indicators, including the variation in the real interest rate, the covariance between stock market return and consumption, and the variability of
decile portfolios formed on the basis of firm size. Perhaps because of the estimation problem, none of these variables provides relevant evidence to support the association between risk and return. In addition, many researchers explore the power of capital asset pricing model beta. Fama and French (1992), however, find that the cross sectional stock returns have no significant relationship with the capital asset pricing model beta. In particular, their finding of the superior explanation power of size and book-to-market for expected stock returns to estimates of CAPM beta then generates much literature concerned with the fundamentals of firm in determining stock prices. Opinions about the size and value effects can be roughly classified into three strands, including risk proxy argument (for example, Fama and French, 1993 and 1995; and Zhang, 2005)2, market mispricing argument (for example, Lakonishok, Shliefer, and Vishny, 1994), and cash flow perspective (for example, Berk, 1995; Pontiff and Schall, 1998; Biddle and Hunt, 1999; and Clubb and Naffi, 2007). Yet a consistent explanation for the Fama-French results remains a controversial issue.
In this paper, we apply the association between variation in return-on-equity and book-to-market ratio to investigate the predictive power of uncertainty for expected stock returns. We follow the intuition of Pástor and Veronesi (2003) that the book-to-market ratio is governed by the behavior of profitability. Moreover, we relies on the cash flow perspective and the risk argument to examine relevant information behind this indicator. It is straightforward to examine the behavior of stock returns by discussing firm’s profitability as suggested by Fama and French (1995). However, we relies on information from the variability of profitability, while the latter focuses on its
2
Fama and French (1992, 1993) state that the book-to-market ratio is a risk factor because this ratio is related to relative financial distress. Zhang (2005) proposes that book-to-market ratio can represent systematic risks of the firm because it reflects how difficult a firm to adjust its capital stock in business cycle.
mean value. According to their studies, we try to answer two specific questions. The first question is how the variation in return-on-equity is associated with the expected stock returns. The second question is why the variation in return-on-equity has the predictive power for stock returns.
First of all, we document empirical association among volatility of return-on-equity, market values, and book-to-market ratios on firm level. Specifically, we find that sorting stocks to forming portfolios by Fama-French approach seems to be conditional on the variation in return-on-equity. Controlling for size, firms classified as growth stocks significantly experience large variation in return-on-equity prior to the portfolio formation year, while value stocks sustain less variation in return-on-equity. This finding is consistent with the implication from the valuation model of Pástor and Veronesi (2003) that book-to-market ratios and volatility of profitability have a negative association. They assert when the clean surplus relation holds for accounting earnings, the growth rate of book equity is profitability (return-on-equity) minus the dividend yield such that the book-to-market ratio decreases with the variation in return-on-equity.
It is worthy to note that our focus is different to the issue of Pástor and Veronesi (2003) and Wei and Zhang (2006). We attempt to investigate the predictive ability of the variation in return-on-equity on the subsequence stock returns in this study, while they aim at finding the explanatory power of the variation in return-on-equity to the idiosyncratic return volatility.3 Moreover, our driving force behind the negative association between uncertainty and book-to-market is somewhat different to Pástor and Veronesi (2003). In particular, we analyze the volatility of profitability and propose
3
that a large variation in return-on-equity decreases book-to-market because it predicts higher growth rates in book equity, earning, and profitability in the future. On the contrary, Pástor and Veronesi (2003) explore the issue of uncertainty about mean profitability. By introducing learning about average profitability, Pástor and Veronesi (2003) examine that market-to-book ratio increase with uncertainty about average profitability.
Second, we show that average stock returns are significantly related to firm-specific variation in profitability both for portfolios based on sorts and for returns on individual stock in the cross section. We demonstrate that variation in return-on-equity provides additional explanatory power to the cross-sectional monthly stock returns even though other prices related factors are under consideration. Evidence shows that large variation in return-on-equity significantly predicts lower stock returns in the subsequence periods. In particular, our study differs from previous research (Biddle and Hunt,1999; and Clubb and Naffi, 2007) in that we find adding the volatility of return-on-equity, plausible proxy for expected cash flow, does not enhance the value effects in the cross section. On the contrary, the value effect becomes weak within portfolios sorted by profitability volatility.
Finally, we investigate why higher variation in return-on-equity forecasts lower expected stock returns. Mechanically, returns must be governed either by cash flow news or discount rate news. However, in an efficient market, cash flow news is largely idiosyncratic while discount rate changes are common across firm. As a result, stock returns react negatively to volatile profitability only if variation in return-on-equity is associated with lower cash flow. Consistent with the cash flow perspective of Berk (1995), we find large variation in return-on-equity significantly forecasts lower
profitability in the near future. In addition, we also investigate the risk argument of book-to-market to discuss the predictive power of uncertainty. Based on the neoclassical framework, Zhang (2005) proposes that because of costly reversibility and countercyclical price of risk value firms have trouble in reducing capital stock in bad times and do not invest even in good times. Thus book-to-market ratio can reflect systematic risks of the firm by discussing difference on investment activity. According to the finding of Anderson and Garcia-Feijóo (2006), growth firms seem to exercise more growth options around the portfolio formation period, while value firms try to contract. Consistent with the risk argument of book-to-market, our evidence shows that more volatile profitability also stimulates firms to involve in more investment activities. We provide another explanation that any difference on investment activity between growth firms and value firms may attribute to the negative association between variation in return-on-equity and book-to-market ratio. Moreover, uncertainty reveals information about future profitability, including mean value and volatility.
Our study makes two main contributions to the literature. First, our finding can complement to the literature of stock returns predictability. We provide an non-price indicator based on profitability to forecast subsequence stock returns. Moreover, this non-price indicator is good at describing the trend in return volatility that makes it more attractive. We indirectly prove that there is a negative association between volatility and expected stock returns in the cross section. A related issue of Ang, Hodrick, Xing, and Zhang (2006) states that stocks with high sensitivities to innovation in aggregate volatility have higher idiosyncratic volatility and lower average stock returns if the market price of volatility risk is negative. Our standpoint is distinct. Based on the framework of Pástor and Veronesi (2003), our finding provides a
powerful evidence to support that book-to-market ratio may serve as proxy for systematic risk.4 Based on their closed-form solution, they show that book-to-market ratio decreases with the instantaneous variance of profitability but increases with the product of market price of risk and volatility of profitability, the critical determinant of expected stock returns, if profitability is well defined.5 In their framework, profitability involves two kinds of risks, systematic shock and idiosyncratic shock, while excess stock returns only compensates for systematic risk.6 If market price of risk is positive, stocks with large and positive sensitivity to aggregate shocks should have high average returns. Over our sample periods, growth firms tend to have volatile profitability and earn lower stock returns while value firms seem to experience less volatile profitability and have higher stock returns. Our intuition is that value firms are more sensitive to aggregate shocks but face less idiosyncratic shocks. While the former makes they to earn higher stock returns, the latter makes they to have higher book-to-market ratio. On the contrary, growth firms with lower book-to-market ratio earn lower sock returns because they are less sensitive to aggregate shocks but have large idiosyncratic shocks.7 Overall, value stocks have higher systematic risks than growth stocks such
4
The systematic risk prospective of book-to-market ratio is original from Berk, Green, and Naik (1999). Their point of view relies on the analysis of a firm’s investment activities. Gomes, Kogan, and Zhang (2003), Zhang (2005) and Cooper (2006) also apply similar idea to explain the value premium by analyzing a firm’s investment decision. In contrast, Pástor and Veronesi (2003) do not investigate the firm’s investment policy in analysis book-to-market ratio. Their model is from the traditional asset pricing research that stock valuation is governed by discount rate and cash flow. By setting suitable process for profitability and stochastic discount factor, book-to-market ratio can be associated with systematic risk.
5
Zhang (2005) proposes that because the market price of risk is countercyclical, the value premium is high in bad times when the price of risk is large.
6
Pástor and Veronesi (2003) do not investigate the firm’s investment decision but simple assume profitability is mean-reverting. This implies the existing capital or asset in place involves two kinds of risks, systematic risk and idiosyncratic risk.
7
Another explanation is that the market price of volatility risk is negative. Ang, Hodrick, Xing, and Zhang (2006) state that the price of aggregate volatility risk is negative so that stocks more sensitive to volatility risk should have low average returns. Aggregate volatility risk is priced with negative sign because risk-averse agents reduce current consumption to increase precautionary saving when facing more uncertainty about future market returns. In this case, however, we cannot identify that
that they earn higher average returns.
This evidence is also consistent with Cooper (2006) that high book-to-market firms are more sensitive to aggregate shocks and have higher systematic risks if capital investment is largely irreversible. In his model, systematic risks rely on the firm’s excess capital capacity, which evolves according to shocks of the firm’s profitability. He proposes that because a firm’s book-to-market ratio is associated with its excess capital capacity, it may serve as a proxy for its systematic risks. In sum, our empirical evidence is complement to the theoretical work of Pástor and Veronesi (2003) that counts on the analysis of profitability. We show that volatile profitability accompanies with lower book-to-market ratio due to the positive association between variation in return-on-equity and growth rate of book equity. Moreover, higher volatility of return-on-equity accounts for lower expected stock returns in the cross section because it predicts lower profitability in the subsequence periods. Future profitability is positively associated with expected stock returns because it represents a higher expected payoff that must be discounted at a higher expected return for a given current market value.
Second, our finding also amplifies the cash flow perspective and the risk argument on the book-to-market ratio’s ability to predict expected stock returns. We find both the volatility of return-on-equity and book-to-market ratios are good at predicting future stock returns. While the former has a negative association with expected returns, the latter provides a positive connection. More specifically, we find the volatility of return-on-equity and the level of book equity provide an opposite explanation to current investment activity, future cash flow, and future growth rate of
book equity, earnings, and profitability. Consistent with the cash flow perspective of Pontiff and Schall (1998), evidences shows that higher book equity predicts higher average profitability such that firms with higher book-to-market earn higher returns. In contrast, when firms have large variation in profitability, their average future profitability will be low. According to the basic idea of Pástor and Veronesi (2003) that book-to-market ratios decrease with the growth rate of book equity, we find the growth rates of book equity, earnings, and profitability increase with the volatility of return-on-equity but decrease with the level of book equity. All these evidences not only provide some possible explanations for the predictive power of variation in profitability for expected stock returns but also enhance the cash flow perspective on the book-to-market ratio’s ability to predict stock returns in which book equity plays an important role. In addition, we find the cash flow perspective and the risk argument of book-to-market have one similarity reflecting on investment activity. According to the theoretical work of Berk, Green, and Naik (1999) and the empirical evidence of Anderson and Garcia-Feijóo (2006), firms with lower book-to-market have lower stock returns because they own and exercise numbers of profitable investment opportunities. Making profitable investments can reduce the average systematic risk of the firm’s cash flow in subsequence period, which in turn on average makes stock returns lower. Our evidence also shows that firms with higher variation in profitability or lower book equity can invest more. A possible explanation is that firms with volatile profitability or lower book equity are expected to have lower risk-adjusted discount rates or higher growth rate on profitability, which in turn make investments more attractive.
The paper proceeds as follows. We introduce our motivation with a brief review of the related literature in Section 3. Section 4 describes our measure of variation in
return-on-equity and methodology for the analysis of the association between uncertainty, market value, and book-to-market ratio. In Section 5 we investigate some characteristics embodied in the variation in return-on-equity. In Section 6 we investigate whether the variation in return-on-equity affects the subsequence stock returns. In Section 7 we examine why the variation in return-on-equity has the predictive power to stock returns by discussing the risk argument and the equity cash flow perspective of book-to-market ratio. Concluding remarks are shown in Section 8.
2.3 Literature Review
To understand how variation in return-on-equity relates to subsequence stock returns, we relies on the association between profitability and book-to-market ratio. In this section we summarize few explanations of previous research why book-to-market can serve as a predictor of stock returns that is useful to identify the information behind this profitability uncertainty. For the cash flow fundamental perspective, recent literature apply similar framework in discussing the role of book-to-market ratio. They try to perform book-to-market ratio in terms of some fundamental variables they are interested in; then they explain the value effect by discussing properties of these fundamental variables among firms. Considering the dividend process of an all-equity firm that finances its investment entirely with retained earnings, market-to-book ratio has association with profitability and discount rates (Fama and French, 1995). Based on the clean surplus relation, book-to-market ratio is related to future cash flow, interest rates, and excess stock returns (Vuolteenaho, 2000; Clubb and Naffi, 2007). All these methods try to relate book-to-market ratio with other fundamental valuation ratios. On other hand, Pástor and Veronesi (2003) develop a valuation model and
obtain a closed-form solution for the firm’s market-to-market ratio. They find market-to-book ratio increases with expected profitability and decreases with expected stock returns as shown in Vuolteenaho (2000). Most specifically, they find more volatile profitability can increase market-to-book ratio. They state that uncertainty about a firm’s average profitability increases the firm’s market-to-book ratio and return volatility. The expected stock returns, however, are not affected by this uncertainty.
Recently, a number of studies have viewed size and book-to-marker as firm-specific properties to relate risk and returns. They suggest that firm valuation and valuation ratios evolve according to optimal investment decisions and that size and book-to-market ratio are critical to explain the cross section of stock returns because they proxy for time-varying systematic risks. Berk, Green, and Naik (1999) develop a real options model that relates average stock returns, systematic risks, and firm characteristics such as size and book-to-market ratio. They suggest as firms exploit profitable investment, their systematic risks will change in a predictable way. Book-to-market is used a state variable to summarize the firm’s risks relative to the scale of the asset base, while size proxies for the state variable that describes the relative importance of existing assets and growth options.
Zhang (2005) further develop a neoclassical framework with rational expectation to examine the value premium. He proposes that because of costly reversibility and countercyclical price of risk firms have difficult in cutting assets in place that in turn makes existing assets riskier than growth options especially in bad times when the price of risk is high. Based on the intuition of Berk, Green, and Naik (1999), Anderson and Garcia-Feijóo (2006) further provide an empirical evidence to relate past firm-specific investment activity and valuation ratio. More specifically, they find that
size and book-to-market lose part of explanation power to the cross section stock returns once they control for firm-level investment activity.
Based on the equity cash flow perspective of Berk (1995), recent research provides some evidences to support the conjecture that the predictive power of book-to-market seems to result from the relation between book value and future cash flow. Pontiff and Schall (1998) demonstrate that book-to-market will be a better predictor of subsequence returns when book equity is significantly related to future cash flow. When comparing the predictive power of book equity on future cash flow, they find book value from S&P index performs better then that of DJIA index. Thus, S&P book-to-market has a better predictive power on the market returns than the DJIA book-to-market ratio does. Biddle and Hunt (1999) further show that other proxies for expected cash flow in addition to book equity can enhance the cross-sectional relation between market equity and expected stock returns. However, because these cash flow proxies should form ratios with market equity, they reveal similar information with book-to-market.
Clubb and Naffi (2007) develop a log linear model that includes expectations of future boo-to-market and return-on-equity except for current book-to-market to predict future stock returns. Empirical evidence shows that these three variables have significant explanatory power to the UK cross-sectional stock returns even though they include other risk proxy variables to the regression model. More specifically, they find that inclusion expectations of future book-to-market and return-on-equity as additional explanatory variables increase the explanatory power of current book-to-market to expected stock returns.
argument of book-to-market to investigate the usefulness of variation in return-on-equity on forecasting stock returns and examine information embodied in this indicator. This indicator is non-price but can well describe the upward trend in return volatility that is useful in examining the association between expected returns and return volatility in the cross section.
2.4 Data and Preliminary Analysis
In this section we provide cross-sectional evidences of how the uncertainty about future profitability of a firm relates to its characteristics such as book-to-market ratio (BE/ME) and market size (ME). Using two specific proxies of variation in return-on-equity, the standard deviation of return-on-equity, ROEstd, and the changes of return-on-equity, DROE, we find portfolios sorted by size (ME) and book-to-market (BE/ME) inherit distinct property of variation in return-on-equity, as suggested by previous theoretical work. In the next section, we will investigate some properties of portfolios formed on the uncertainty of profitability to explain the association between variation in profitability and valuation ratio.
Because stock prices moves in response to cash-flow news or discount-rate news, there should be a connection between stock returns and earnings surprises. Previous literature has found that firm valuation is associated with the variance of profitability such that book-to-market may serve as a proxy for variation in return-on-equity. Fama and French (1995) investigate that size and value effects are related to the systematic risks about difference on profitability. Our key question is whether the relation between variation in profitability and returns remains after controlling for other well known forecasting factors such as market equity and book-to-market ratio. To detect these
inferences, we count on stock price data from the Center for Research on Securities Prices (CRSP) and financial statement data from COMPUSTAT beginning from 1980 to 2001. In computing proxy of variation in return-on-equity, we require five years of financial data before a company is included in any portfolio. Only nonfinancial firms (SIC other than in the 6000) and firms with ordinary common equity (security type 10 or 11 in CRSP) are discussed in our study. In addition, we also require each firm to have a strictly positive book value prior to portfolio formation year. Overall, the average number of firms per year is 3911 in our sample, compared with an average of about six thousand firms on CRSP and COMPUSTAT databases for the same period. The appendix describes the data in detail. Below we show some properties among portfolios to confirm our inferences and implications behind them.
We use two variables to proxy for uncertainty about future profitability: the standard deviation of return-on-equity (Wei and Zhang (2006)) and the changes of return-on-equity ((Kothari, Lewellen, and Warner (2006)). Return-on-equity is defined as earnings divided by lagged book equity in the last year. The variance of return-on-equity used in this study, ROEstd, is the sample variance of return-on-equity over the last five years. The changes in return-on-equity used, DROE, defines as return-on-equity at the end of fiscal year t− minus return-on-equity at year 1 , where year is the portfolio formation year. To well capture variation in profitability, the changes in return-on-equity must be modified by absolute value. It is well known that the uncertainty about the future return-on-equity is positively related to the realized variation of past return-on-equity (Wei and Zhang (2006)). And the changes in return-on-equity are useful in describing earning news (Kothari, Lewellen, and Warner (2006)). We focus on the variation in return-on-equity of the 25 portfolios formed by 3
t− t
the widely accepted Fama-French method of classifying stocks based on their market size and book-to-market ratio (Fama and French (1993)). We also employ identical conception of Fama and French (1992, 1993) to segment firms by fundamental ratios, adapted when conducting variables for uncertainty across firms. In addition, we use other proxies to represent firm-level variation in return-on-equity, including the changes in return-on-equity between fiscal year t− and year 1 , the earnings changes scaled by lagged book equity, and the modified correlation of coefficient of return-on-equity. However, these results do not cause much change and have been omitted here.
2
t−
Table 1 characterizes the pattern of profitability uncertainty for portfolios sorted by size and book-to-market over the period 1980 to 2001 for CRSP- and Compustat-listed stocks. Panel A of Table 1 shows the mean and median values of the standard deviation of return-on-equity, ROEstd, for 25 portfolios sorted by ME and
BE/ME following Fama and French (1993). We conduct two features from Table 1.
First, controlling for ME, volatility of profitability consistently decreases with BE/ME. For the smallest quintile, ROEstd decreases from an average 67.54% for low BE/ME firms to 21.25% for high BE/ME firms. For the largest quintile, ROEstd decreases from an average 13.43% for low BE/ME firms to 11.48% for high BE/ME firms. In addition, controlling for BE/ME, variation in return-on-equity decreases as market equity value becomes large. For the lowest (highest) BE/ME quintile, ROEstd decrease from 67.54% (21.25%) for the smallest firms to 13.43% (11.48%) for the largest firms. This evidence is consistent with the theoretical work of Pástor and Veronesi (2003) that variation in return-on-equity accounts for the valuation ratio. However, our work differs to Pástor and Veronesi (2003) in that we apply conditional measure of variation
in return-on-equity while they use an estimate of unconditional volatility for each firm. As a result, we state that sorting of stocks to portfolios based on firm size and book-to-market seems to be conditional on past variation in profitability. Panel B of Table 1 shows the value of changes in return-on-equity, DROE, for identical portfolios, and similar patterns are found in such analysis. Controlling for ME, changes in return-on-equity decrease as firms’ book-to-market increase. For the smallest quintile,
DROE decreases from an average 81.96% for low BE/ME firms to 26.69% for high BE/ME firms. For the largest quintile, the average value of DROE is 21.11% for low BE/ME quintile and is 9.04% for high BE/ME quintile. The size effect is also apparent
when controlling for BE/ME. Given BE/ME, changes in return-on-equity decreases as market equity value becomes large. For the lowest (highest) BE/ME quintile, DROE decrease from 81.96% (26.69%) for the smallest firms to 21.11% (9.04%) for the largest firms. Similar features are found when we refer to the median values of ROEstd or DROE .Based on these evidences, we state that portfolios sorted on ME and BE/ME seem to experience distinct degree
Table 1
Return-On-Equity and Its Sample Variance by Sorts on Size and Book-to-Market Ratio, July 1980 to June 2001
Each year (1980 to 2001), we divide NYSE, AMEX, and NASDAQ stocks into five groups based on their size at the end of June (ME, stock price times shares outstanding), and into five groups based on ranked values of book-to-market ratio (BE/ME, the ratio of book value of equity at the end of fiscal yeart− divided by market value of equity 1 at the end of December of calendar yeart− ). Only positive values of BE/ME are 1 considered. We use NYSE stocks to determine the size and BE/ME breakpoints. We form 25 portfolios by combining the ranked value of size and BE/ME. Return-on-equity (ROE) is the stock’s recently yearly earnings divided by the book common equity of the prior fiscal year. The standard deviation of return-on-equity (ROEstd) used is from the sample variance of yearly return-on-equity over the last five years relative to portfolio formation year. The change in return-on-equity (DROE) defines as the absolute value of difference between return-on-equity at the end of fiscal yeart−1 and return-on-equity at the end of fiscal yeart− . The standard deviation of 3 return-on-equity and the change of return-on-equity have been winsorized at the 1% and 99% tails of distribution each year. Means (medians) are shown as percentages. Low
BE/ME BE/ME-2 BE/ME-3 BE/ME-4
High BE/ME Panel A: Standard deviation of return-on-equity % (ROEstd)
sorted by ME and BE/ME
Small-ME 67.5(28.3) 32.0(14.0) 26.1(11.4) 21.9(10.1) 21.3(10.2) ME-2 40.7(13.1) 18.4(7.6) 13.6(6.8) 11.3(6.1) 13.7(7.2) ME-3 26.2(8.7) 14.6(6.2) 13.0(5.7) 10.4(4.9) 12.2(5.5) ME-4 23.9(6.9) 12.3(5.7) 11.4(5.9) 10.3(4.6) 9.7(4.6) Large-ME 13.4(6.1) 8.6(5.4) 9.3(5.2) 6.2(4.1) 11.5(3.7)
Panel B: Change of return-on-equity % ( DROE) sorted by ME and BE/ME
Small-ME 82.0(33.8) 41.6(16.0) 32.1(12.3) 27.5(10.7) 26.7(11.2) ME-2 52.1(15.2) 24.2(8.5) 17.8(7.1) 14.5(6.5) 18.8(7.6) ME-3 41.4(10.6) 20.6(6.5) 14.1(5.6) 11.4(5.2) 14.9(5.4) ME-4 31.8(7.8) 14.7(5.9) 12.8(5.9) 9.2(4.6) 12.8(4.6) Large-ME 21.1(6.4) 10.7(5.5) 11.5(5.4) 8.0(4.0) 9.0(3.2)
of variation in return-on-equity prior to formation year.
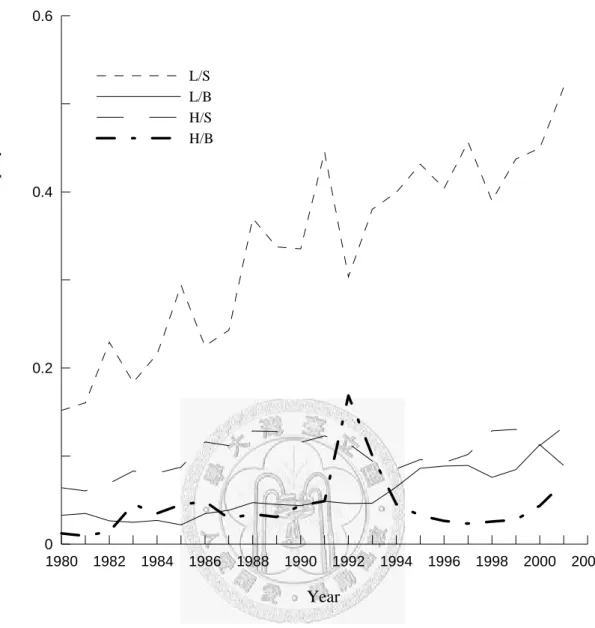
Next, Figure 1 and Figure 2 plot the evolution of ROEstd and DROE for portfolios based on ME and BE/ME from 1980 to 2001. These two figures plot the median ROEstd and DROE that reveal several interesting facts. First, small firms with lower BE/ME tend to have higher and volatile volatility of return-on-equity through time. The median increases almost monotonically from 16% in 1980 to over 50% in 2001. On the contrary, over the same periods, other firms seem to exhibit stable profitability, including small and large size firms with higher BE/ME and large size firms with lower BE/ME. At most of time, the median volatility of return-on-equity is below 15% for these firms. Our evidence is consistent with the finding of Wei and Zhang (2006) that the upward trend in the volatility of return-on-equity is more apparent for newly listed stocks than for existing stocks. Second, controlling for ME, firms that classified as high BE/ME consistently experience less variation in return-on-equity prior to portfolio formation than firms that classified as low BE/ME over the 22 sample year. Third, Controlling for BE/ME, firms with small ME consistently have larger variation in return-on-equity than firms with large ME. Similar patterns are found when we focus on the changes of return-on-equity. Firms with small size and lower BE/ME also have an upward trend in the changes of return-on-equity after 1980. In brief, we find firms with distinct market size and valuation ratio exhibit different degree on the variation in return-on-equity.
Evidences from Table 1 and Figure 1 and 2 sustain implication of previous proposed model from Pástor and Veronesi (2003) that BE/ME is related to the variation in return-on-equity. Classification of stocks based on firm-specific fundamentals such as ME and BE/ME seems to rely on information of variation in return-on-equity. More
specifically, when portfolios are formed under Fama-French model, low BE/ME firms tend to be more volatile in profitability prior to the formation year than high BE/ME firms. In addition, small size stocks are also more volatile than firms with big size. Based on the clean surplus relation, the process of book equity is governed by profitability. If BE/ME is governed by the uncertainty about book equity growth, it is straightforward to apply variation in return-on-equity to mimic the value effect. Now we realize that there is connection between valuation ratio and variation in return-on-equity, proxy by past variance of return-on-equity or the changes in return-on-equity, theoretically and empirically. It may be useful to conduct the power of book-to-market by investigating the implication behind the variation in return-on-equity. We discuss relevant issues in the next section.
1980 1982 1984 1986 1988 1990 1992 1994 1996 1998 2000 2002 Year 0 0.2 0.4 0.6 S tan d ar d d evia tion o f re tu rn-o n -e q ui ty L/S L/B H/S H/B
Figure 1: Time-series evolution of the standard deviation of return-on-equity for portfolios sorted by ME and BE/ME, 1980-2001.
This figure plot the evolution of the standard deviation of return-on-equity for portfolios sorted by market size (ME) and book-to-market ratio (BE/ME) as described in Table1. Return-on-equity (ROE) is the stock’s recently yearly earnings divided by the book common equity of the last fiscal year. The standard deviation of return-on-equity for individual firm used is from the sample variance of yearly ROE over the last five years relative to portfolio formation year. Each year (1980 to 2001) the standard deviation shown is the median standard deviation of return-on-equity for firms in the same portfolio. Only values for stocks in the smallest(S)/largest(B) market size groups and the lowest(L)/highest(H) BE/ME groups are shown.
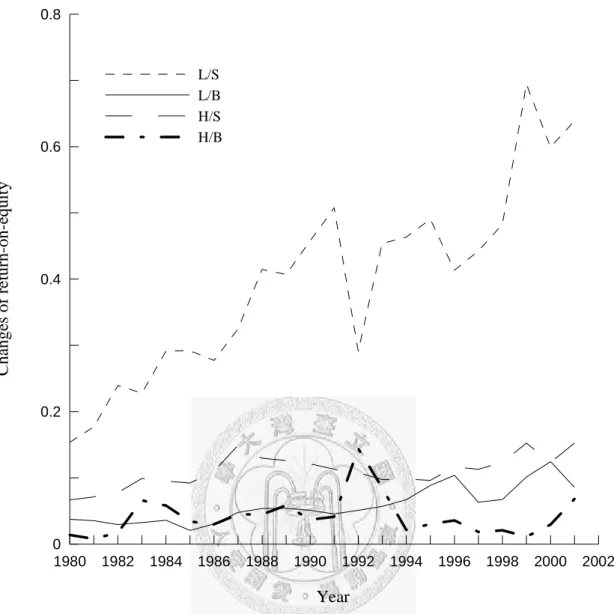
1980 1982 1984 1986 1988 1990 1992 1994 1996 1998 2000 2002 Year 0 0.2 0.4 0.6 0.8 Chang es of re tu rn- on-eq ui ty L/S L/B H/S H/B
Figure 2: Time-series evolution of the changes of return-0n-equity for portfolios sorted by ME and BE/ME, 1980-2001.
This figure plot the evolution of the changes of return-on-equity for portfolios sorted by market size (ME) and book-to-market ratio (BE/ME) as described in Table1. Return-on-equity (ROE) is the stock’s recently yearly earnings divided by the book common equity of the last fiscal year. The changes of return-on-equity defines as the absolute value of difference between return-on-equity at the end of fiscal year and return-on-equity at the end of fiscal year
1
t−
3
t− . Each year (1980 to 2001) the changes
shown is the median value of changes for firms in the same portfolio. Only values for stocks in the smallest(S)/largest(B) market size groups and the lowest(L)/highest(H) BE/ME groups are shown.
2.5 Properties of Variation in return-on-equity
Fama and French (1992 and 1993) find that size and value effect in the cross section of stock returns and point out factors such as market value and book-to-market ratio that capture the stock returns. To examine what kind of risk factors embodied in the size and book-to-market, Fama and French (1995) relate the behavior of earnings to size and book-to-market factors. Furthermore, they test that stock returns are related to the market size factors in earnings, but not to the book-to-market factors. In this section we first examine what kinds of characteristics embodied in the variation in return-on-equity and then document whether the average stock returns is governed by the variation in return-on-equity in next section. The intuition is that if BE/ME is the reflection of uncertainty and there is a value effect in the cross section of expected stock returns, stock returns can be related to the risks in earnings.8 We actually find higher variability of profitability is not noise but actually is related to expected return.9 In order to prevent any possible return anomalies induced by equal-weighted portfolios, we apply the value-weighted portfolio stock returns in the following analysis. Monthly portfolios returns are computed from July of each year to June of year t t+1.
First, Panel A of Table 2 shows some characteristics of portfolios sorted by the variation in return-on-equity, proxy by the variation in return-on-equity and the changes in return-on-equity. Each year we form five quintile portfolios based on the volatility of return-on-equity five year before formation. We report the average and median values of valuation ratio, market size, and two leverage variables. The average
8
The correlation coefficient between book-to-market and volatility of return-on-equity is -0.0328. Moreover, the Spearman’s rank correlation coefficient is -0.2275 that means there is a weak negative correlation between book-to-market and volatility of return-on-equity.
9
Prior research shows that stock prices for individual firms react positively to earnings news but require several quarter to fully reflect the information about earnings, an empirical finding known as
and median value of the market size for the five uncertainty portfolios decrease monotonically as we move from the lowest uncertainty group to the highest group. The mean (median) ME for the lowest ROEstd group is $2320 ($316) millions while it is $384 ($32) millions for the highest ROEstd uncertainty group. The average BE/ME is 0.90 for the lowest uncertainty group; it then increases in the middle quintiles, peaking at a mean of 0.98, and then decreases to 0.68 for the highest uncertainty group. The median BE/ME also performs as the inverse-U shape; it peaks at the second lowest quintiles of 0.79, and down to 0.44 for the highest group. Evidence is consistent with the finding of the previous section that firms with small size and low BE/ME experience higher variation in return-on-equity prior to formation year while firms with big and high BE/ME face less uncertainty.
Panel A of Table 2 also show the leverage property embodied in the uncertainty quintiles. We apply two leverage variables used by Fama and French (1992), including the ratio of book assets to market equity, A/ME, and the ratio of book assets to book equity, A/BE. A/ME is interpreted as a measure of market leverage while A/BE is a measure of book leverage. Evidence shows that the mean value of A/ME and A/BE both increase monotonically from the lowest uncertainty group to the highest uncertainty group. For example, the mean A/ME (A/BE) for the lowest uncertainty group is 1.95 (2.06) while it is 2.64 (8.51) for the highest uncertainty group. However, we find the book leverage has a dramatic increasing from the lowest uncertainty groups to the highest uncertainty groups (from 2.06 for lowest ROEstd to 8.51 for highest
ROEstd). The difference between market and book leverage is book-to-market equity,
ln(BE ME/ )=ln( /A ME) ln( /− A BE), as noted by Fama and French (1992). Thus, if a firm’s book leverage is high relative to its market leverage, it may sustain a lower
valuation ratio. In other word, firms with lower valuation ratios may have a lower book equity or larger book equity growth as investigated by Pástor and Veronesi (2003). We will provide some evidences to complete this argument latter in this work.
Similar evidences are found when we conduct portfolios formed by the changes in return-on-equity. Both the valuation ratio, BE/ME, and market size, ME, decrease with this uncertainty proxy, while both market and book leverage increase with the same proxy. In particular, the average of book leverage increases dramatically from 2.14 for the lowest DROE group to 7.19 for the highest DROE group, while market leverage only increases from 2.00 to 2.43 for the identical portfolios. In Panel A of Table 2 we also find that the standard deviation of subsequence monthly returns also monotonically increases with the variation in return-on-equity as proposed by previous literature (Pástor and Veronesi (2003) and Wei and Zhang (2006)). The volatility of stock return is 4.0% in the lowest uncertainty group and 6.88% in the highest uncertainty group when we conduct variation in return-on-equity as our proxy. In addition, when we refer to changes in return-on-equity as primary proxy, the volatility of stock return is 4.07% in the lowest uncertainty group and 7.00% in the highest uncertainty group.
Panel B shows that for the year after portfolio formation, average monthly returns are 1.33% for the lowest ROEstd portfolio versus 0.60% for the highest ROEstd portfolio. In addition, the average monthly return difference between low and high
ROEstd portfolios is 0.73%. Using the t tests on the equality of means, the two groups
are significantly different at 1%. When we refer to DROE, similar trend on average monthly returns is revealed. The average monthly returns are 1.34% for the lowest
0.50%. And the t tests on the equality of means for the lowest and highest groups is significantly different at 10%. We interpret these results as consistent with Pástor and Veronesi (2003) that book-to-market ratio is associated with the variation in return-on-equity such that there is a connection between variation in return-on-equity and subsequence stock returns. Specifically, we inherit their implication that the variation in return-on-equity involves two kinds of risks, systematic and idiosyncratic shocks. However, the discount rates or expected returns are only driven by systematic shocks. Holding expected returns constant, the return difference between low and high profitability uncertainty portfolios will eliminate. That is what we find in Panel B of Table 2, where we present evidence on the association between variation in return-on-equity and subsequence stock returns, controlling for market value of equity. Stocks are first classified into three groups base on ME, and then into five quintile portfolios based on proxy of variation in return-on-equity.
Although we find the leverage variable increases with the proxy of uncertainty, it is not clear if the variation in return-on-equity can be related the distress event when market size is controlled. It is well-known that firms with small size and high book-to-market could be viewed as firms with higher distress risks. As a result, the variation in return-on-equity should have a larger effect on the risk and return relation for small rather than large firms. However, evidence reveals different signal when we conduct different proxies. We find that there is a large significant return difference between lowest and highest uncertainty groups for large market equity firms when using variance of return-on-equity as proxy variable. On the contrary, the largest significant return difference between lowest and highest uncertainty groups reveals on the small market equity firms when referring to change in return-on-equity as proxy
variable. Overall, we suggest that the variation in return-on-equity contains both systematic and idiosyncratic risks so that there is connection between this uncertainty and subsequence stock returns. In addition, additional risks revealed by the difference on variation in return-on-equity are compensated for smallest and largest market size firms when market equity is controlled. However, we cannot identify the distress risks by examining the uncertainty.
Table 2
Summary Statistics of Portfolios Formed on Standard Deviation of Return-on-Equity and Difference of Return-on-Equity
At the end of June of each year , t t=1980to , five portfolios are formed on the basis of ranked values of the standard deviation of return-on-equity. Return-on-equity (ROE) is the stock’s recently yearly earnings divided by the book common equity of the prior fiscal year. The standard deviation of return-on-equity (ROEstd) used is from the sample variance of yearly return-on-equity over the last five years relative to portfolio formation year. The change in return-on-equity (DROE) defines as the absolute value of difference between return-on-equity at the end of fiscal year
2001
1
t− and return-on-equity at the end of fiscal yeart− . Quintile portfolios are ranked in 3 ascending order. BE is the book value of equity at the end of fiscal yeart− . A is total book assets from the latest fiscal year ending in 1 calendar yeart− . The accounting ratios are measured using market value of equity ME at the end of December of calendar year1 . Firm size (ME, market value of equity) is measured in June of year , with ME dominated in millions of U.S. dollars. Returns are computed over the 12 months following portfolio formation (total of 264 months). The monthly value-weighted returns are based on monthly rebalancing. The variable sigma is the standard deviation of monthly value-weighted returns. The last column of Panel B presents the average monthly return difference between low and high quintile portfolios. Superscripts a, b, c refer to 1%, 5%, and 10% significance levels, respectively, for t-statistics testing the equality of monthly returns between low and high uncertainty groups. In Panel C and D the reported median of average return-on-equity and its volatility is from the subsequence five years after portfolio formation. The last column of Panel C and D reports the p-value for Wilcoxon rank-sum Z-statistics testing the equality of distributions between the two groups, high and low quintile stocks.
1
t− t
Panel A: Characteristics of Portfolios Based on ROEstd and DROE Low ROEstd 2 3 4 High ROEstd Low DROE 2 3 4 High DROE BE/ME 0.90 0.97 0.98 0.95 0.68 0.91 0.92 0.93 0.91 0.67 (median) (0.76) (0.79) (0.77) (0.71) (0.44) (0.75) (0.73) (0.73) (0.67) (0.42) ME 2320 1759 1257 779 384 1727 1750 1131 739 400 (median) (316) (145) (83) (44) (32) (185) (126) (79) (50) (33) A/ME 1.95 2.07 2.30 2.59 2.64 2.00 2.05 2.20 2.40 2.43 (median) (1.42) (1.49) (1.52) (1.58) (1.21) (1.41) (1.40) (1.43) (1.44) (1.11) A/BE 2.06 2.10 2.31 2.76 8.51 2.14 2.29 2.49 2.78 7.19 (median) (1.85) (1.84) (1.92) (2.10) (2.41) (1.85) (1.86) (1.87) (2.01) (2.33) Sigma 4.00 4.59 4.91 5.57 6.88 4.07 4.48 4.97 5.43 7.00
Panel B: Average value-weighted monthly percent returns by ROEstd and DROE(%) Low ROEstd 2 3 4 High ROEstd Low- High Low DROE 2 3 4 High DROE Low- High All 1.33 1.23 1.02 1.18 0.60 0.73 a 1.34 1.15 1.11 1.06 0.85 0.50 c Small 1.54 1.66 1.77 1.70 1.26 0.28 1.78 1.53 1.49 1.65 1.16 0.62 b Medium 1.42 1.51 1.50 1.42 1.04 0.37 1.48 1.39 1.43 1.34 1.00 0.48 c Large 1.41 1.10 1.37 0.98 0.93 0.48 b 1.33 1.24 1.15 1.09 0.91 0.43 c
Panel C: Return-on-equity after formation by ROEstd and DROE(%) Low ROEstd 2 3 4 High ROEstd p-value Low DROE 2 3 4 High DROE p-value All 11.31 10.51 8.72 6.77 4.73 0 10.50 10.29 9.03 6.73 4.41 0 Small 7.01 6.56 5.97 4.80 3.54 0 5.15 5.54 5.10 4.66 2.94 0 Medium 9.94 10.33 10.16 7.99 5.44 0 9.20 9.88 8.93 7.41 4.46 0 Large 12.76 13.11 12.72 11.58 10.31 0 12.32 12.57 12.64 11.76 10.17 0
Panel D: Standard deviation of return-on-equity after formation by ROEstd and DROE(%) Low ROEstd 2 3 4 High ROEstd p-value Low DROE 2 3 4 High DROE p-value All 7.09 11.41 16.18 25.26 59.11 0 9.11 11.59 16.08 24.31 52.71 0 Small 7.71 12.00 13.95 19.94 43.46 0 14.59 15.21 18.01 22.55 44.66 0 Medium 6.35 8.87 12.09 16.16 35.51 0 10.06 10.60 13.67 17.86 35.07 0 Large 6.15 8.07 11.53 15.32 30.20 0 7.48 8.46 10.90 14.63 27.45 0
Next, we provide some evidences to examine what kind of idiosyncratic risks may contain in the variation in return-on-equity. In order to investigate the relevant cash flow information embodied in the proxy of variation in return-on-equity, in Panel C and D of Table 2 we report the association between variation in return-on-equity prior to portfolio formation and the behavior of return-on-equity in the following five years after formation, controlling for market value of equity. Because large and small firms have distinct scale on the ongoing projects, their operation risks are different. If effects of variation in return-on-equity can be fully captured by market size, then the variation in return-on-equity would not reveal any additional information on the behavior of cash flow when market equity is under control. However, our evidence shows that, even controlling for market value of equity, the behavior of return-on-equity after formation year is different among groups sorted by variation in return-on-equity. In Panel C we find that the median return-on-equity monotonically decreases with the variation in return-on-equity with and without controlling market equity size. For example, median return-on-equity for small market equity firms is 7.01% in the lowest
ROEstd group, 5.97% in the middle ROEstd group, and 3.54% in the highest ROEstd
group. Using the Wilcoxon rank-sum test, the highest and lowest uncertainty groups are significantly different at the 1% level. Panel D indicates that the realized variance of return-on-equity is positively related to the variation in return-on-equity after portfolio formation for small, median, and large size groups. Median variance of return-on-equity after portfolio formation for large market equity firms is 6.15% in the lowest ROEstd group, 11.53% in the middle ROEstd group, and 30.20% in the highest
ROEstd group, respectively. Z-statistics for the Wilcoxon test also reveal that the two