1
以釋氧及有機生物牆整治石油碳氫化合物及有機溶劑污染之場址
期 末 報 告 計 畫 編 號 90-2211-E-110-004- 執 行 期 限 90 / 8 / 1 - 91/ 7 / 31 主持人: 高志明 中山大學環工所 副教授 一 、 摘 要 地下水被三氯乙烯(trichloroethylene or TCE)]所 污染是一個愈趨普遍且嚴重的問題。本計畫之目 的即為研究發展被動式之生物整治牆(passive biologically active barrier system) 來 現 地 處 理 TCE 所污染之地下水。當污染之地下水流過此 透水性之生物牆時,污染物和整治牆內之物質發 生生物氧化還原反應而被分解去除。和傳統之地 下 水 整 治 技 術 [ 例 如 抽 取 處 理 法 (pump-and-treat) 及 空 氣 氣 化 法 (air sparging)]相比,這項系統具有以下各項優點: (1)不需要任何機械設備和電力;(2)不需要做地 下水之抽取與補注;(3)現場處理污染之地下 水;以及(4)高經濟效益。本計畫主要工作包括 研究以糖蜜或污泥餅為主要基質對加強 TCE 分 解之效率。研究結果顯示糖蜜或污泥餅可有效釋 出碳源,使 TCE 在共代謝條件下被完全降解。 關鍵詞:三氯乙烯、共代謝、地下水整治、生物 整治牆、The industrial solvent trichloroethylene (TCE) is among the most ubiquitous chlorinated compounds found in groundwater contamination. The objective of this study was to evaluate the potential of using complex organic materials (sludge cake and cane molasses) to enhance the cometabolism of TCE. The bioavailability of sludge cake and cane molasses was evaluated using bioreactor tests. Results show that biodegradable materials were released from sludge cake/cane molasses and utilized by microbial consortia. Based on the chemical oxygen demand (COD) analysis, 13.6 and 226 mg of biodegradable COD can be released from 1 g of sludge cake and 1 g of cane molasses, respectively. Microcosm study was performed using sludge cake/cane molasses as the primary substrates, and aquifer sediments/aerobic activated sludge as the inocula. Results indicate that sludge cake and cane molasses can serve as the diffusion sources of primary substrates, and enhance the TCE biodegradation under aerobic cometabolic processes. Up to 0.59 µM/day/g of TCE degradation ratio using sludge cake as the substrate and aquifer sediments as the inocula was observed. Results from the feasibility study show that the proposed biobarrier has the potential to become an environmentally and economically acceptable technology for the bioremediation of chlorinated-solvent contaminated groundwater.
Keywords: trichloroethylene; aerobic cometabolsim; groundwater remediation; biobarrier
二 、 計 畫 緣 由 與 目 的
Groundwater at many existing and former industrial sites and disposal areas is contaminated by halogenated organic compounds that were released into the environment. The chlorinated solvent trichloroethylene (TCE) is one of the most ubiquitous of these compounds. The maximum contaminant level (MCL) for TCE is 5 µg/L (Federal Register, 1989). Current evidence suggests that TCE can be degraded cometabolically by supplying an alternate primary substrate under aerobic conditions (Magnuson et al., 1998; EPA, 1998; Bedient et al., 1999). Therefore, in situ bioremediation is a feasible technology to clean up TCE contaminated sites if other substrates can be provided to the subsurface economically. Biological sludge cake and cane molasses are wastes from domestic wastewater treatment and sugar industry, respectively. They have the following characteristics that make them good candidates for this type of application: (1) they are rich in carbon, an essential energy source for biodegradation; (2) they have the potential to exhibit sufficient carbon bioavailability for cometabolsim to occur; (3) they are relatively inexpensive. The above discussion suggests that a passive sludge cake or cane molasses biobarrier system is a practical method to biodegrade TCE to non-toxic end products. The objective of this effort was to develop a passive and cost-effective groundwater treatment technology for TCE removal. Specific objectives of this bench-scale study were to: (1) determine the bioavailability of alternative primary substrates (cane molasses and sludge cakes) by microbial consortia; and (2) evaluate the feasibility of biodegrading TCE by different microbial consortia using substrates released from cane molasses and sludge cakes.
三、研究方法及成果 Bioavailability Test
The bioavailability test was a modified biochemical oxygen demand (BOD) experiment. This modified BOD test was used to examine whether cane molasses and sludge cakes contain decomposable organic matters using microbial consortia under aerobic conditions. In this test, six two-liter serum bottles (batch reactors) (labeled as A, B, C, D, E, and
2 F) were used to perform the aerobic bioavailability experiment. Reactors were purged with air and contained primary substrates (Reactors A and B: 2.5 g of sludge cake; Reactors C and D: 0.5 g of cane molasses; Reactors E and F: no primary substrate addition), 980 mL of mineral medium solution, and 20 mL of aerobic activated sludge collected from an industrial wastewater [mainly straight-chain chlorinated compounds (e.g., VC, DCEs, PCE, dichloroethane)] treatment plant. Reactors had the following features: (1) continuous monitoring of pH, and (2) a three-way outlet attached on the top of the reactor for water sample collection. Since activated sludge contained some unknown organics, Reactors E and F were prepared without cane molasses or sludge cake additions. This was used to differentiate the organic utilization between activated sludge and cane molasses/sludge cake. Reactors B, D, and F were used as control sets, which were autoclaved and contained 250 mg/L HgCl2 and 500 mg/L NaN3. Cane molasses and sludge cakes were collected from a sugar cane factory and a domestic wastewater treatment plant, respectively. The pH of the mineral medium buffer solution was 7.5, and the solution was autoclaved before use (Kao and Prosser, 1999). Duplicate water samples (2-mL each) were collected from all reactors each day for chemical oxygen demand (COD) measurements during the 25-day operation period. COD analysis was performed in accordance with the dichromate reflux method described in Standard Methods (APHA, 1995). Microcosm Study
Aerobic microcosm experiments were conducted to examine the feasibility of TCE biodegradation using cane molasses and sludge cake as the primary substrates under aerobic cometabolic conditions. The inocula used in this microcosm study included contaminated aquifer sediments from the mid-plume area (dissolved oxygen level was around 1.2 mg/L) of a TCE-spill site and aerobic activated sludge used in the bioavailability test. Each microcosm was constructed with 35 mL nutrient medium (described in the above section, 10 g sediments or 1 mL activated sludge of inocula, 5 ml TCE solution, and 0.1 g of cane molasses or sludge cake in a 70-ml bottle sealed with Teflon-lined rubber septa. Table 1 lists the components of each microcosm. The aquifer sediments were purged with nitrogen gas before use. The initial TCE concentrations in microcosm bottles were approximately 7.5 - 8 µM (after equilibration). The pH of the microcosm solution was 7.5. Control bottles contained 250 mg/L HgCl2 and 500 mg/L NaN3, and inocula used for the control groups were autoclaved before use. TCE analyses were performed in accordance with U.S. EPA Method 601, using a Tekmer Purge-and-Trap Model LSC 2000 with a Varian Model 3800 Gas Chromatograph (GC).
In the microcosms with aquifer sediments as the inocula, four groups (two lives and two kill controls) of microcosms were constructed (Table 1). Groups
A1 (live) and A2 (control) contained sludge cake and Groups A3 (live) and A4 (control) contained cane molasses. In the microcosms with activated sludge as the inocula, four groups of microcosms were constructed (Table 1). Groups S1 (live) and S2 (control) contained sludge cake and Groups S3 (live) and S4 (control) contained cane molasses. Duplicate microcosms were sacrificed at each time point and analyzed for TCE concentrations.
四 、 結 果 與 討 論 Bioavailability Test
Six reactors were incubated for 25 days. The variations in COD versus time for each reactor are presented in Figure 1. In the kill control group with sludge cake as the substrate (Reactor B), COD was 66 mg/L on day 1 and went up to 163 mg/L on day 7, then slowly climbed up to 182 mg/L on day 25. In the kill control group with cane molasses as the primary substrate (Reactor D), COD was 87 mg/L on day 1 and went up to 502 mg/L on day 5, then slowly increased to 562 mg/L on day 25. This indicates that the soluble organic materials released from the cane molasses and sludge cake caused the increase in COD measurements in both reactors. No significant difference between COD measurements in Reactors E (live control) and F (kill control). Consistent COD measurements were observed in both reactors (approximately 7 to 11 mg/L).
Flocculations of the COD measurements in the Reactors A and C were observed (Figure 2). Based on the COD results from the kill control reactors (B and D), organic carbon continuously released from the substrates, which caused the variation in COD measurements in both live and kill control reactors. Compared to the kill control reactors (B and D), significant decreases in COD measurements were observed in Reactors A and C with sludge cake and cane molasses as the substrates, respectively. This suggests that the released organics (COD) from substrates were biodegraded by the inoculated activated sludge. COD measurements were averaged for the period from day 7, when stabilization was reached, to the end of the experiment on day 25. The averaged COD measurements for Reactors A, B, C, D, E, and F were 150, 186, 429, 544, 7, and 9 mg/L, respectively. After subtracting the contribution from activated sludge, approximately 34 mg/L of COD in Reactor A and 113 mg/L of COD in Reactor C were biodegraded after a 25-day incubation. This indicates that approximately 13.6 mg of biodegradable COD and 226 mg of biodegradable COD can be released from 1 g of sludge cake and 1 g of cane molasses, respectively.
Microcosm Study
Aerobic microcosms (Groups A1 to A4) using aquifer sediments as inocula and sludge cake and cane molasses as primary substrates were incubated for 60 days. The average concentration of the duplicate analysis of TCE versus time is presented in Figure 2. In Microcosm A1 with sludge cake as the primary
3 substrate, almost complete TCE degradation was observed after 23 days of incubation with a measurable lag period (approximately 4 days). In Group A3 with cane molasses as the primary substrate, complete TCE degradation was also observed after 45 days of incubation with a measurable lag period (8 days). Results show that both substrates can be used to enhance the aerobic cometabolism of TCE using aquifer sediments as the inocula. Results also indicate that organic compounds released from the sludge cake were more biodegradable to the inocula (aquifer sediments) than cane molasses although cane molasses contained more COD. In the control microcosms (Microcosms A2 and A4), no significant TCE decrease was observed throughout this experiment (Figure 2). Microcosms with aerobic activated sludge as the inocula and sludge cake (Microcosms S1 and S2) and cane molasses (Microcosms S3 and S4) as the primary substrates were incubated for 60 days. Figure 3 presents the analytical results for this microcosm study. Complete TCE degradation was observed in Microcosms S1 and S3 after 12 and 25 days of incubation with 1 and 4-day lag periods, respectively. Compared to aquifer sediments, activated sludge could use both substrates as the carbon sources more efficiently and enhance TCE cometabolism more effectively. Results also show that sludge cake could release more biodegradable substrates than cane molasses in this study. No TCE decrease was observed in the control microcosms (S2 and S4) (Figure 3). TCE degradation ratios were calculated to compare the activity of the microbial consortia. The selected incubation period for the ratio calculation did not include the lag time, and therefore, days 4, 8, 1, and 4 were used as the starting degradation time points for Microcosms A1, A3, S1, and S3, respectively. The calculated TCE degradation ratios for A1, A3, S1, and S3 were 0.04, 0.02, 0.59, and 0.33 µM/day/g or mL of inocula, respectively. This indicates that the microbial population in activated sludge contained more active microorganisms, which can synthesize oxygenase enzyme for subsequent TCE cometabolism during their degradation of sludge cake and cane molasses. Table 2 presents the calculated degradation ratios for the microcosm study.
五、討 論
Results from the bioavailability test show that biodegradable materials were released from both sludge cake and cane molasses and utilized by microorganisms. Degradation of the released organic materials also caused the decrease in COD measurements. Based on the results from biodegradability tests, 1 g of sludge cake and 1 g of cane molasses could release approximately 13.6 and 226 mg of biodegradable COD, respectively. The released bioavailable organics could cometabolize significant amount of TCE and remediate the contaminated groundwater. Moreover, organic
materials can be released from sludge cake and cane molasses continuously. Thus, sludge cake and cane molasses could be applied for a longer period of remediation time in the field. Microcosms with activated sludges as the inocula had more efficient TCE degradation. Longer lag periods for TCE removal were observed in microcosms with aquifer sediments as the inocula. Furthermore, the calculated TCE degradation ratios were lower using sediments as the inocula. These findings suggest that the aquifer sediments collected from the TCE-contaminated site had no beneficial effects on TCE removal compared to the activated sludge with high and versatile microbial populations from the industrial wastewater treatment plant.
Results indicate that both inocula can efficiently utilize sludge cake and cane molasses as the energy sources and cometabolize TCE. From an engineering point of view, bacteria enrichment or organisms isolation may not be needed to achieve an effective TCE removal ratio for the practical remedial application. For a TCE spill site lacking of active microbial consortia, activated sludge can be applied to accelerate the TCE removal rates. This makes the biobarrier system containing sludge inocula more feasible and applicable. Complete TCE removal in this microcosm study suggests that the proposed biobarrier has the potential to become a cost-effective remediation alternative to remediate chlorinated-solvent contaminated aquifers. Results of this study will aid in designing a system for field application. This system can also be applied for other hazardous waste contaminated sites to biodegrade other recalcitrant contaminants.
六、參考文獻 AP H A, A me r i c a n P u b l i c H e a l t h A s s o c i a t i o n , 1 9 9 5 . St a n d a r d M e t h o d s fo r t h e E x a m i n a t i o n o f Wa t e r a n d Wa s t e Wa t e r, 1 9 t h e d . , AP H A - AW WA -W E F, Wa s h i n g t o n D C .
Bedient, P.B., Rifai, H.S., Newell, C.J., 1999. Ground Water Contamination – Transport and Remediation. PTR Prentice-Hall, Inc., New Jersey.
EPA, US Environmental Protection Agency, 1998. Technical Protocal for Evaluating Natural Attenuation of Chlorinated Solvents in Ground Water.EPA/600/R-98/128, Washington DC. Federal Register, 1989. National primary and
secondary drinking water regulations, Fed. Reg. 54, 22062-22160.
Kao, C.M. and Prosser, J., 1999. Intrinsic bioremediation of trichloroethene and chlorobenzene: field and laboratory studies. J. of Haz. Mat. B69, 67-79.
Magnuson, J.K., Stern R.V., Gossett, J.M., and Burris, D.R., 1998. Reductive dechlorination of tetra- chloroethene to ethene by a two-component enzyme pathway. Appl. Environ. Microbiol. 64, 1270-1275.
4 七、圖表
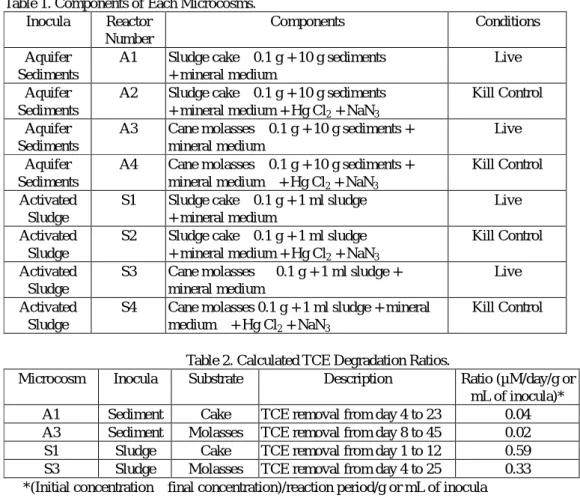
Table 1. Components of Each Microcosms. Inocula Reactor
Number
Components Conditions
Aquifer Sediments
A1 Sludge cake 0.1 g + 10 g sediments + mineral medium
Live Aquifer
Sediments
A2 Sludge cake 0.1 g + 10 g sediments + mineral medium + Hg Cl2 + NaN3
Kill Control Aquifer
Sediments
A3 Cane molasses 0.1 g + 10 g sediments + mineral medium
Live Aquifer
Sediments
A4 Cane molasses 0.1 g + 10 g sediments + mineral medium + Hg Cl2 + NaN3
Kill Control Activated
Sludge
S1 Sludge cake 0.1 g + 1 ml sludge + mineral medium
Live Activated
Sludge
S2 Sludge cake 0.1 g + 1 ml sludge + mineral medium + Hg Cl2 + NaN3
Kill Control Activated
Sludge
S3 Cane molasses 0.1 g + 1 ml sludge + mineral medium
Live Activated
Sludge
S4 Cane molasses 0.1 g + 1 ml sludge + mineral medium + Hg Cl2 + NaN3
Kill Control
Table 2. Calculated TCE Degradation Ratios.
Microcosm Inocula Substrate Description Ratio (µM/day/g or mL of inocula)* A1 Sediment Cake TCE removal from day 4 to 23 0.04 A3 Sediment Molasses TCE removal from day 8 to 45 0.02 S1 Sludge Cake TCE removal from day 1 to 12 0.59 S3 Sludge Molasses TCE removal from day 4 to 25 0.33 *(Initial concentration – final concentration)/reaction period/g or mL of inocula
5
Figure 1. Variation in COD versus time in the bioavailability study.
Figure 2. Microcosm experiments with aquifer sediments as the inocula.
Figure 3. Microcosm experiments with sludge as the inocula. M icrocosm Study (Sludge)
0 1 2 3 4 5 6 7 8 9 10 0 5 10 15 20 25 30 35 40 45 50 55 60 Days Con c µM S1(C ake) S2(C ontrol) S3(M olasses) S4(C ontrol) 0 1 0 0 2 0 0 3 0 0 4 0 0 5 0 0 6 0 0 0 5 1 0 1 5 2 0 2 5 D ay s COD m g /L A (S lud ge ) B (C o ntro l) C (M o la sse s) D (C o ntro l) E(N o A d d ) F (C o ntro l)
Microcosm Study (Sediments)
0 1 2 3 4 5 6 7 8 9 10 0 5 10 15 20 25 30 35 40 45 50 55 60 Days C onc µ M A1(C ake) A2(C ontrol) A3(Molasses) A4(C ontrol)