行政院國家科學委員會專題研究計畫 期中進度報告
除草劑對浮游生物藻類之毒性評估(1/2)
計畫類別: 個別型計畫 計畫編號: NSC94-2211-E-009-007- 執行期間: 94 年 08 月 01 日至 95 年 07 月 31 日 執行單位: 國立交通大學環境工程研究所 計畫主持人: 陳重元 報告類型: 精簡報告 報告附件: 出席國際會議研究心得報告及發表論文 處理方式: 本計畫可公開查詢中 華 民 國 95 年 5 月 29 日
行政院國家科學委員會補助專題研究計畫
※
期中進度
報 告 ※
除草劑對浮游生物藻類之毒性評估(1/2)
計畫類別:
※
個別型計畫 □ 整合型計畫
計畫編號:N
SC
: 94-2211-E-009 -007
執行期間:94 年 8月 1日至 95 年 7月 31日
計畫主持
人:
陳重元
共同主持人:
計畫參與人員:
成果報告類型(依經費核定清單規定繳交):
※
精簡報告 □完整報告
本成果報告包括以下應繳交之附件:
□赴國外出差或研習心得報告一份
□赴大陸地區出差或研習心得報告一份
□出席國際學術會議心得報告及發表之論文各一份 (註:於期末報告一併繳交)
□國際合作研究計畫國外研究報告書一份
處理方式:除產學合作研究計畫、提升產業技術及人才培育研究計畫、列管計
畫及下列情形者外,得立即公開查詢
□涉及專利或其他智慧財產權,□一年□二年後可公開查詢
執行單位:
國立交通大學 環境工程研究所
中 華 民 國 95 年 5 月 29 日
以密閉式藻類毒性試驗評估除草劑之毒性
九十四學年度計畫期中進度報告
計畫編號:NSC 94-2211-E-009 -007
執行期間:94 年 8 月 1 日至 95 年 7 月 31 日
主持人: 陳重元 國立交通大學 環境工程研究所
一、中英文摘要 本研究以藻類(Pseudokirchneriella subcapitata) 利用BOD 瓶進行一密閉式之毒性試驗,評估除 草劑之毒性,以探討除草劑對於非目標性生物 可能造成的危害。本實驗主要使用三種反應終 點,包含溶氧變化量及利用藻類細胞密度變化 量計算所得到的最終產量及生長率。 本 研 究 預 計 使 用 20 種 除 草 劑 是 根 據 HRAC 所作的分類中,在三大不同作用機制下 所含的10 項化學上的相異結構分類選出的。 實驗的結果指出,以desmetryne為毒性最強 者,而最低則是tebutam。而兩者之間的EC50差 值可達到約103倍以上;而在三種不同試驗參數 裡,尤以生物質量(Final Yield)最為敏感,其 次為溶氧變化量(△DO),最後才是生長率 (Growth rate)。以抑制光合作用系統Ⅱ的除草 劑毒性大多較高,但少數幾個的毒性卻低於幹 擾細胞分裂型的除草劑。此外,抑制生長素類 型的除草劑,在毒性上明顯是最低。 本研究至今已完成 15 種除草劑之毒性評 估,接續將完成其餘除草劑之毒性評估試驗及 數據分析等工作。 關 鍵 詞 : Pseudokirchneriella subcapitata; Herbicides; Phytotoxicity AbstractThe work reported here was done to examine the effect of herbicides by using a close-system BOD bottle test and to assess the phytotoxicity on non-target organisms such as algae. (Pseudokirchneriella subcapitata).
The toxic test was ended based on DO, final yield and growth rate. 20 herbicides in 10 different chemical structure classes embracing 3 different modes of action according to Herbicide Resistance Action Committee were tested.
The results indicate that desmetryne is the most toxic and tebutam is the least toxic to the Pseudokirchneriella subcapitata. EC50 difference
between the two toxicants can be up to more than about 103 times; among three kinds of different experimental parameters, biomass (Final Yield) is the most sensitive particularly, secondly in order is dissolve oxygen (△DO), and growth rate is the last.
In addition, experimental results indicated that the acute toxicity of the photosynthesis-inhibiting Ⅱ herbicides were higher, but few of them were lower than those of the cell division inhibitor. However, the like auxenic-type herbicides are very weakly photoxic to algae, their acute toxicities were the lowest.
Keywords: Pseudokirchneriella subcapitata, Herbicides; Phytotoxicity
二、研究緣起 不論在生理或經濟層面,水都有著無法取 代的重要性,隨著環境的變遷及時代潮流的進 步,水污染的情況日趨複雜及嚴重。農業活動 也是造成水體污染的來源之一,由於為了提高 農作物生產而使用農藥、肥料等來增加收成 量,如殺蟲劑、除草劑和殺真菌劑等。其中, 除草劑在農業上通常是用來減少或破壞環境中 的雜草,來避免和作物間營養及光線的競爭, 但除草劑卻有相當麻煩的副作用,就是可能會 經由噴灑漂流、溢流等進入生態系統,或是經 雨水沖洗和溶解,由坡面逕流帶入各類水體 中,農藥進入水體後不僅直接危害水中生物, 而且可經由食物鏈聚集於水產品中再危害人 體。除草劑於表面水體的污染會直接對水生植 物產生毒性,對動物及其他生態系統的間接影 響也將是可以預期的(Ma et al., 2003)[1] 。 除 草 劑 抗 性 執 行 委 員 會 (Herbicide
Resistance Action Committee)在 2002 年時將除 草劑針對所作用的機制及化學上的不同而做了 分類,本篇所含的20 種除草劑主要是包括抑制 光合作用型、幹擾植物體細胞分裂型和生長素 類型(Table 1)。(HRAC, 2002)[2] 在C類當中的Triazines類除草劑會藉著佔據D1 蛋白質上的活性位置(QB-binding niche)來幹 擾植物光合作用。(WSSA, 1994)[3] 阻礙植物體 的光合作用光反應系統Ⅱ(PSⅡ)中,電子傳 遞鏈(electron transport chain)的運行,最終使 得光能無法轉換成能提供植物生長足夠的能 量,而造成植物體的死亡。(Wright and Corbett, 1979; Pfister and Arntzen, 1979)[4,5]
當施用此類 除草劑於植株上,除草劑會與電子傳送過程口 之QB (PSⅡ secondary electron acceptor)上的
D1 polypeptide相結合,改變QB 氧化還原電
位,降低其與電子之親和力,使QA 降低電子
傳遞效率,一旦電子傳遞受到阻礙,植株之光 合作用便無法正常進行,進而影響植株之生理 反應而影響植株之正常生長,以達到藥劑除草 之效用。(Dodge, 1989; Fuerst and Norman, 1991; Fuks et al., 1992; Nakamuraet et al., 2003; Follak and Hurle, 2003;)[6-10] 大部分 Chloroacetamides 類除草劑的作用機制 都很相似,靠著透過幹擾細胞分裂與增大而產 生的生長抑制,是針對植物體早期的生長,不 過這類的除草劑僅對幼苗的效果較顯著,對種 子的發芽作用反而起不了太大的功效。 生長素類型除草劑會藉由引誘ACCase的 活性來刺激乙烯的生成,在易受影響的雙子葉 植物中,乙烯的增加會引起離層酸(ABA)的 累積;在易受影響的草本植物中,會造成組織 薄膜中氰化物(HCN)量的上升,而上述的情 形則會影響植物生長,產生葉的上偏性、生長 妨礙及老化。(Ma, 2002)[11] 在大部分毒性研究中,幾乎是以動物界為 試驗物種當作探討的對象,其實以往報告中也 有不少主要針對各類藻種作實驗物種所進行的 研究,如green algae(Selenastrum capricornutum 或 Scenedesmus subspicatus ) 或 diatom , diatomophyta ( Navicula accommoda ) 、 cyanophyta (Oscillatoria limnetica)等,乃是較為
常見的農藥毒性試驗物種;(Nygaard et al., 1986;
Herman et al., 1990; Oya and Alec, 1996; Piere-Yves et al.,1996)[12-15] 可是對於這方面的 實驗實例還是相當缺乏,無法完善的表達出確 實的反應結論。Lewis(Lewis, 1992 and 1995) [16,17] 曾對於藻類試驗與魚毒、植物做比較性研 究,發現藻類試驗可判定為較敏感的物種,且 反應的時間可以更為縮短;加上有成本上的考 量,也較為經濟。 藻類是水生生態系統中的初級生產者,也 是其他水生食物鏈的基本,在在顯示了以藻類 來做為生物指標的重要性。在生態系統中,水 生植物扮演著非常重要的角色,可以藉由轉換 太陽能及二氧化碳為有機物來維持生長。有機 物則是水中生態系統中像食草動物或雜食動物 的食物來源之一。除此之外,水生植物在養份 的攝取、儲存、釋放及沈澱上也相當重要。 (Fairchild et al., 1998)[18] 來自人類活動的幹擾,像是將毒性物質帶 入水生態系中,會改變水中植物群落的結構及 功能。(Amblard et al.,1990; Havens and Health, 1990)[19,20]
污 染 物 的 不 同 敏 感 性 , 像 是 有 機 氯 殺 蟲 劑 (Thomas et al., 1986)[21] 、工業有機物(Klaine and Lewis, 1995)[22] 、金屬(Bartlett et al., 1974; Greene et al., 1988)[23,24] 等。Thomas et al. (Thomas et al., 1986)[21] 所做的評估試驗中發 現,月牙藻相對於其他物種,如水蚤、蚯蚓或 Microtox等生物試驗來的較敏感。Klaine and Lewis(Klaine and Lewis, 1995) [22]
兩位學者也指 出水生植物比其他動物系的生物來的敏感性較 佳。
以往,利用藻類做為生物指標的監測方法 中,大多是批次式開放培養的實驗系統來做為 實驗方法;(Galassi and Vighi, 1981; Herman et al., 1990)[25,26]傳統的批次式的試驗(U. S. EPA,OECD, ASTM ,ISO等)(U. S. EPA, 1996; OECD, 1984; Versteeg, 1990; ISO, 1987)[27-30]
, 在這樣的環境條件之下,假使所要檢測的化學 物品或是製劑具有相當的揮發能力,在試驗的 期間則可能會因為毒性物質的散失而造成實驗 的誤差,影響結果。OECD也建議當在測試揮 發性有機物的實驗時,應該使用密封的暴露系 統。(OECD, 2000)[31] 針對此項缺失,本研究做了進一步的改 善,利用BOD瓶來製造出密閉環境系統的毒性 試驗方法,用以評估具有揮發性或半揮發性的 化學物質或製劑,利用量測藻類的溶氧變化量 (△DO)及細胞密度(Cell Density)來做為反 應參數,求得各毒性物質的EC50值與劑量反應 曲線關係圖以瞭解化學物質對藻類所產生的影 響與毒性關係。然而在提供所需的碳源的部 分,事先將去離子水以CO2-N2混合氣體曝 氣,一方面除去水中溶氧,另一方面便是增加 碳源,讓營養液中能含有足夠的碳源使藻類生 長不會受到抑制。此種方法能大大降低測試物 質因揮發性而可能產生的誤差,大大的提升實 驗的準確性。Lin et al.,(Lin et al., 2005)[32]
Chen and Lin,(Chen and Lin, 2005)[33]
and Chen et al.(Chen et al., 2005) [34]等以金屬及有機物, 如:氯酚、腈類、醛類等所得到的研究結果皆 都表現出密閉式藻類毒性試驗和其他傳統試驗 方法比較之後所呈現出的高度敏感性,另外, 簡易的實驗設計、步驟以及較短的實驗時間也 都是本方法的優點之ㄧ。並將所顯現出的結果 與除草劑過去各別的文獻資料做比較,得到以 利用此新的測試方法和以藻類做為測試物種 時,實驗的敏感性及準確度差別。 三、材料與方法 毒性試驗 經由每天更換新鮮的進流基質,並量測槽 中細胞數量、溢流率、及觀察粒徑分析儀中藻 類細胞之分佈情形(細胞平均體積;MCV), 以判定連續式培養槽是否達到穩定狀態。以連 續3 天之細胞數量、MCV 等參數皆在控制的範 圍且粒徑分析儀中藻類細胞之分佈為一常態分 佈,即可認定為系統達到穩定狀態。範圍約在: 細胞數量(1.7×10⁶~1.9×10⁶ cells/mL)及粒徑 分 析 儀 中 藻 類 細 胞 之 分 佈 情 形 (MCV 在 39~46µm3 之間)即可。 毒性試驗的營養鹽參考U.S. EPA建議配 製,適當地修正濃度作為本試驗的營養鹽;以 含0.5% CO2 的N2 氣體(流量為 600 mL/min) 對營養鹽進行曝氣,降低水中的溶氧值並提高 其CO2 含量,再以 0.1N的NaOH 和HCl將營養 鹽的pH值調整至 7.5 ± 0.1,完成營養鹽的配製。 從培養母槽(steady state 狀態)取出之藻 液與上述之營養鹽混合成所需濃度,接下來再 加入不同之毒物濃度(含一組控制組及六組處 理組)的試驗瓶,一組實驗做三重複組;此時 須注意各瓶中的營養鹽濃度與初始細胞密度應 該相同,本實驗之初始細胞密度設定在 15,000 cells/ mL,進行毒性試驗,且另外再量測開始 之溶氧值(Initial DO,在此要注意曝氣的時間 及狀況,盡量讓初始溶氧降為最低)。 經過48 hr 的毒性物質曝露後,量測各加入 不 同 毒 物 濃 度 後 的 試 驗 瓶 之 溶 氧 值 (Final DO),扣除起始之溶氧值得淨溶氧值(ΔDO), 同時測量瓶中細胞密度以求得藻類生長率。 數據分析 實驗一開始先進行range finding的測試,濃 度範圍須至少橫跨3 個order,再逐步縮小至確 定的試驗濃度值,當濃度確定後,至少進行 2
次的藻類密閉式毒性試驗,當實驗結果的差距
在10%內才算完成實驗,以求得更準確的實驗
數據。將實驗所測出之各參數值(如淨生長細 胞數及淨產氧量)與對應之有機物濃度帶入模 式(probit)中計算,得到各模式的劑量-反應 曲 線 及EC50值 。NOEC 是 使 用 Dunnett’s test
(one-tail)所得到的。 四、結果與討論 本實驗主要是針對具有不同程度揮發性的 除草劑,經由密閉式的藻類毒性試驗的方法, 分別量測實驗前後的溶氧與細胞密度變化量, 作為反應終點,並利用求得的數據,以溶氧增
加量(△DO)、生物質量(Biomass, Final Yield)
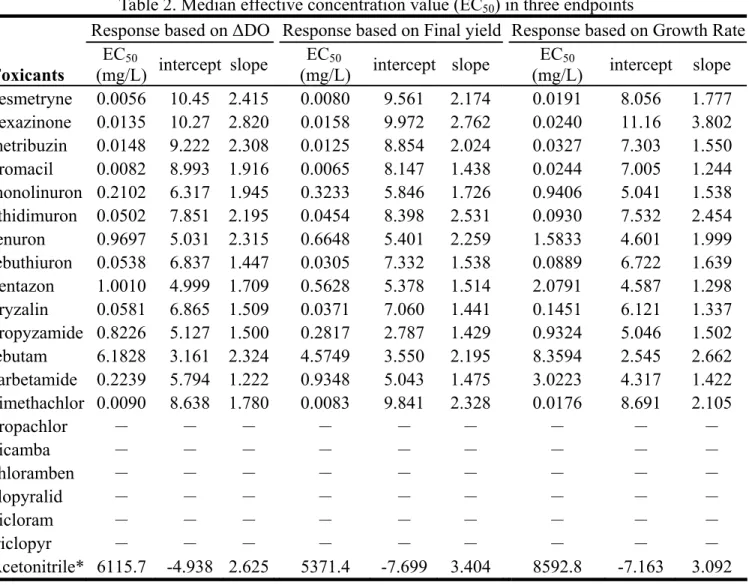
及生長率(Growth rate)作為實驗參數,求得 毒性物質的EC50值和劑量反應曲線。 由於試驗所選擇的毒性物質多為半揮發性 有機物,在實驗時為了避免於儲存階段經由揮 發所造成的誤差,因此,在進行毒性試驗之前 必須先以HPLC進行濃度的定量分析。本研究的 每一毒性試驗皆是設定1 個控制組及 6 個不同 濃度的處理組(除了monolinuron之外),隨著 濃度增加,毒性物質對於藻類的生長抑制情況 也愈趨明顯。將經過計算後的數值代入Probit 模式中,求得描繪劑量反應曲線圖所需之斜率 (β)與截距(α),另外還可求得各個參數的 EC50值。最後將此二值(α, β)代入程式中, 即可畫出以毒物濃度為橫軸,抑制率為縱軸的 劑量反應曲線,由圖中的曲線顯示狀況可以檢 查實驗的數據是否為一良好、準確的劑量反應 關係。 Table 2 是以不同除草劑經由Probit模式分 析藻類毒性試驗所得到的數據。就所得到的結 果來看,先以溶氧變化量作為反應參數來比較 的話,屬於C1 類的desmetryne為毒性最強的毒 物(EC50 = 0.0056 mg/L),毒性最弱的除草劑 為O類的tebutam(EC50 = 6.183 mg/L);若以 Final Yield為反應參數時,毒性最強的除草劑為 C1 類的bromacil(EC50 = 0.0065 mg/L),而 tebutam仍為較不毒的除草劑(EC50 = 4.575 mg/L);當以Growth rate為反應參數的情況下, K3 類的dimethachlor為毒性最高的化合物(EC50 = 0.0176 mg/L),tebutam的毒性仍是最低的 (EC50 = 8.359 mg/L)。可以發現到,不同參數 下所表現出的敏感度在毒性濃度愈低時,差異 性愈大,對於毒性較弱,濃度較高的除草劑, 三種反應參數的敏感性之間反而沒有明顯的差 別。 將不同參數的數據比較之後,可察覺到普 遍以Final Yield為參數時所得到的EC50值較為 敏感(佔 67%),其次是△DO(佔 33%),而 由Growth rate所得到數據呈現出來的,則是屬 於敏感性最低的參數。
Fig 1(Based on DO)、Fig 2(Based on Final yield and Growth rate)是經由模式所描繪出的劑 量反應曲線關係圖,Table 2 中斜率高者,表示 生物體所能忍受的最高濃度到完全抑制濃度只 存在狹小的區間內;這個情況當中,若濃度上 有稍加變化,生物受體的反應就會大幅的增 加,在進行這類毒性物質實驗濃度數據的處裡 方面則需多加注意。 若是以不同類別的除草劑來觀察結果,針 對三種不同的參數來比較,C 類和 K 類的除草 劑分別有1/3 的毒性物質是呈現△DO 參數比較 敏感,有2/3 是以 Final Yield 為參數得到的敏 感性最高。 這個結果和當初選擇C、K、O 三類除草劑 的假設並不相同。C 類是抑制光合作用系統型 的作用機制,起初假設可能和溶氧的變化關係 較為明顯,但是實驗結果卻僅有三分之一的除 草劑在△DO 這個參數所呈現出的敏感性較 高;其餘的毒性物質仍是以Final Yield 參數較 好。顯示C 類除草劑雖是抑制光合作用為主, 產生的氧氣量的確會受到明顯的影響。但是, 無法行完整的光合作用將會導致植物生長所需 的能量不足,也可能是造成細胞分裂無法完全 的原因。於是,在細胞密度變化量的反應參數 上表現出特殊的敏感性,比起原本假設中的情 況高出了許多。 而K 類除草劑的作用機制原本就和細胞分 裂有關,因此在以Final Yield 為反應參數時會 呈現較高的敏感度是可以預期的,本實驗研究
結果也証實了這項假設。 若是以組別間的毒性來討論的話,C1 類組 間的毒性差異並不大,不過C2 類間確有了明顯 的不同(以△DO來說,fenuron 和 ethidimuron 差了20 倍)。C3 類的 bentazone並不高,是所 有C類中毒性最低的,和Fairchild et al.(Fairchild et al., 1997)[35] 、Ma et al.(Ma et al.,2003) [1]、 Reboud(Reboud, 2002)[36] ,等利用不同藻種所做 出來的研究結果是相同的。K1 及K2 類的毒性 明顯較K3 類來的低,其中dimethachlor的毒性 更是比tebutam要高出 500 倍以上。 在本篇研究中分別以三種不同的試驗參數 (溶氧產生量、細胞密度變化量及生長率)來
討論 BOD 瓶藻類毒性試驗的 NOEC 值(No
Observed Effect Concentration)。NOEC 值的判 定通常和實驗濃度的取決、重複組的數量和選 定參數有所關聯。一般NOEC 值是由統計方法 中的Dunnett’s test 方法來做分析的,若重複組 間的差異變小,與處理組的差距便較為明顯, 所求得的NOEC 值也較為準確,通常較不嚴謹 的實驗易出現較高的NOEC 值。Table 3 列出了
由Dunnett’s test 所得到的 NOEC 值,在 NOEC
值的比較方面,三種不同參數有著相同 NOEC 值的毒性物質僅有三種,其他數據不是無法 比較就是溶氧產生量和細胞密度的變化量 較生長率要來得敏感,而溶氧產生量和細胞 密度變化量兩種參數的敏感度是差不多的,在 生長率方面僅有三種毒性物質的NOEC 值小於 實驗濃度的最小值,而溶氧產生量和細胞密度 變化皆都有70%的 NOEC 值較實驗時的最低濃 度還要來得低。以對於本研究的毒性物質而言, NOEC 值能提供更佳的保護標準。而整個 分析中,可能會導致高變異性的原因可能來自 於所使用的藻類未達穩定狀態、或試驗過程不 夠嚴謹以及毒性物質濃度設定不理想,都會產 生分析上的偏差。 五、結論 在本實驗的數據結果可觀察到,其中以 desmetryne 為 毒 性 最 強 者 , 而 最 低 則 是 tebutam。而兩者之間的EC50 差值可達到約 1,000 倍以上;而在三種不同試驗參數裡,尤以 生物質量(Final Yield)最為敏感,其次為溶氧 變化量(△DO),最後才是生長率(Growth rate)。和細胞分裂有關的除草劑不論在動物或 植物上皆產生了相當的抑制效果,但是對植物 的毒性仍是較強的。而在抑制光合作用型的除 草劑上即可明顯的比較出,這類型的除草劑主 要是針對植物光合作用的幹擾,因此對於動物 類的毒性試驗敏感度較差,比起本實驗所使用 的綠藻類更是低了有105倍之多。將本實驗的除 草劑和眾多物種比較上來看,整體上,月芽藻 明顯表現出較為靈敏的情況;這也證明瞭本實 驗物種在對於水體毒性研究上,具有被選擇的 優越性。另外本研究的實驗方法只要以往二分 之一的試驗時間以及較少量測試物種就可以得 到良好的實驗結果再現性與敏感度。 本研究至今已完成 15 種除草劑之毒性評 估,接續將完成其餘5 種除草劑之毒性評估試 驗、數據分析及結果討論等工作。
Table 1. Herbicide resistant weeds of this investigation
HRAC
Group Mode of Action Chemical Family Herbicides CAS NO.
HPLC λ value (nm) C1 Inhibition of photosynthesis at photosystem II Triazines Desmetryne 1014-69-3 200 Triazinones Hexazinone Metribuzin 51235-0402 21087-64-9 206 207 Uracils Bromacil 314-40-9 201 C2 Inhibition of photosynthesis at photosystem II Ureas Monolinuron Ethidimuron Fenuron Tebuthiuron 1746-81-2 30043-49-3 101-42-8 34014-18-1 200 202 253 218 C3 Inhibition of photosynthesis at photosystem II Benzothiadiazinone Bentazon 25057-89-0 236 K1 Microtubule assembly inhibition Dinitroanilines Oryzalin 19044-88-3 208 Benzamides Propyzamide Tebutam 23950-58-5 35256-85-0 200 203 K2 Inhibition of mitosis / microtubule organisation Carbamates Carbetamide 16118-49-3 200 K3 Inhibition of VLCFAs (Inhibition of cell division) Dimethachlor 50563-36-5 203 Propachlor 1918-16-7 215
O Action like indole acetic acid (synthetic auxins)
Benzoic acids Dicamba
Chloramben 1918-00-9 133-90-4 200 200
Pyridine carboxylic
acids Clopyralid Picloram Triclopyr 1702-17-6 1918-02-1 55335-06-3 212 203 200
Table 2. Median effective concentration value (EC50) in three endpoints
Response based on ∆DO Response based on Final yield Response based on Growth Rate
Toxicants EC50 (mg/L) intercept slope EC50 (mg/L) intercept slope EC50 (mg/L) intercept slope desmetryne 0.0056 10.45 2.415 0.0080 9.561 2.174 0.0191 8.056 1.777 hexazinone 0.0135 10.27 2.820 0.0158 9.972 2.762 0.0240 11.16 3.802 metribuzin 0.0148 9.222 2.308 0.0125 8.854 2.024 0.0327 7.303 1.550 bromacil 0.0082 8.993 1.916 0.0065 8.147 1.438 0.0244 7.005 1.244 monolinuron 0.2102 6.317 1.945 0.3233 5.846 1.726 0.9406 5.041 1.538 ethidimuron 0.0502 7.851 2.195 0.0454 8.398 2.531 0.0930 7.532 2.454 fenuron 0.9697 5.031 2.315 0.6648 5.401 2.259 1.5833 4.601 1.999 tebuthiuron 0.0538 6.837 1.447 0.0305 7.332 1.538 0.0889 6.722 1.639 bentazon 1.0010 4.999 1.709 0.5628 5.378 1.514 2.0791 4.587 1.298 oryzalin 0.0581 6.865 1.509 0.0371 7.060 1.441 0.1451 6.121 1.337 propyzamide 0.8226 5.127 1.500 0.2817 2.787 1.429 0.9324 5.046 1.502 tebutam 6.1828 3.161 2.324 4.5749 3.550 2.195 8.3594 2.545 2.662 carbetamide 0.2239 5.794 1.222 0.9348 5.043 1.475 3.0223 4.317 1.422 dimethachlor 0.0090 8.638 1.780 0.0083 9.841 2.328 0.0176 8.691 2.105 propachlor - - - - - - - - - dicamba - - - - - - - - - chloramben - - - - - - - - - clopyralid - - - - - - - - - picloram - - - - - - - - - triclopyr - - - - - - - - - Acetonitrile* 6115.7 -4.938 2.625 5371.4 -7.699 3.404 8592.8 -7.163 3.092 * Acetonitrile is used as a solvent
0 0.2 0.4 0.6 0.8 1 1.2 0.0001 0.001 0.01 0.1 1 DesmetryneConc. (mg/L) Inhi bi ti on rate
Fig 1. The dose-response of desmetryne on P. subcapitata.(based on DO)
0 0.2 0.4 0.6 0.8 1 1.2 0.0001 0.001 0.01 0.1 1 Desmetryne Conc. (mg/L) Inhi bi ti on rate
Fig 2. The dose-response of desmetryne on P. subcapitata. (based on Final yield O and Growth rate▲)
Table 3. NOECs and EC50 for herbicides
Response based on ∆DO Response based on Final Yield Response based on Gowth Rate
Toxicants EC50 (95%C.I.) NOEC EC50 (95%C.I.) NOEC EC50 (95%C.I.) NOEC
desmetryne 0.0056 (0.005~0.006) <0.002 0.0080 (0.007~0.009) <0.002 0.0191 (0.018~0.021) 0.002 hexazinone 0.0135 (0.107~0.018) <0.00486 0.0158 (0.014~0.019) <0.00486 0.0240 (0.019~0.039) 0.00486 metribuzin 0.0148 (0.013~0.017) <0.003 0.0125 (0.010~0.015) <0.003 0.0327 (0.025~0.043) 0.003 bromacil 0.0082 (0.007~0.010) <0.003 0.0065 (0.005~0.008) <0.003 0.0244 (0.019~0.031) <0.003 monolinuron 0.2102 (0.190~0.232) <0.06 0.3233 (0.278~0.369) 0.06 0.9406 (0.858~1.042) 0.15 ethidimuron 0.0502 (0.043~0.059) <0.008 0.0454 (0.040~0.052) <0.008 0.0930 (0.082~0.108) 0.008 fenuron 0.9697 (0.777~1.203) <0.2 0.6648 (0.529~0.800) 0.2 1.5833 (1.272~2.027) 0.2 tebuthiuron 0.0538 (0.035~0.082) <0.003 0.0305 (0.024~0.039) <0.003 0.0889 (0.068~0.118) 0.0085 bentazon 1.001 (0.0769~1.367) <0.125 0.5628 (0.459~0.689) <0.125 2.0791 (1.881~2.304) <0.125 oryzalin 0.0581 (0.027~0.112) <0.003 0.0371 (0.027~0.048) <0.003 0.1451 (0.108~0.195) 0.005 propyzamide 0.8226 (0.661~1.032) 0.054 0.2817 (0.179~0.406) <0.054 0.9324 (0.652~1.339) 0.054 tebutam 6.1828 (4.394~9.439) <0.73 4.5749 (2.519~8.730) <0.73 8.3594 (6.351~13.27) <0.73 carbetamide 0.2239 (0.182~0.268) <0.1 0.9348 (0.778~1.119) <0.1 3.0223 (2.542~3.696) 0.1 dimethachlor 0.0090 (0.007~0.012) <0.001 0.0083 (0.007~0.010) <0.001 0.0176 (0.015~0.021) 0.001 propachlor - - - - - - dicamba - - - - - - chloramben - - - - - - clopyralid - - - - - - picloram - - - - - - triclopyr - - - - - -
* the unit is mg/L; NOEC is conducted by Dunneet’s test; C.I.=confidence interval -Experiments have not been finished yet
六、參考資料
1. Ma, J., Lin, F., Wang, S., Xu, L.,
2003. Toxicity of 21 Herbicides to the
Green Alga Scenedesmus quadricauda. Bull. Environ. Contam. Toxicol. 71, 594–601.
2. Herbicide Resistance Action
Committee ( HRAC ) , 2002.
Classification of Herbicides According to Mode of Action. http://www.plantprotection.org/HRAC
.
3. Weed Society of America., 1994. Herbicide Handbook, 6th ed. Champaign, IL, USA.
4. Wright, K., Corbett, J.R., 1979. Biochemistry of herbicides affecting photosynthesis. Z. Naturforsch C. 34, 966-972.
5. Pfister, K., Arntzen, C.J., 1979. The mode of action of photosystem II –specific inhibitors in herbicide-resistant weed biotypes. Z. Naturforsch C. 34, 996-1009.
6. Dodge, A.D., 1989. Herbicides and plant metabolism: Herbicides interacting with photosystem Ⅱ . Cambridge University Press. Cambridge.
7. Fuerst, E.P., Norman, M.A., 1991. Interactions of herbicides with photosynthetic electron transport. Weed Sci 39, 458-464.
8. Fuks, B., Homble, F., Eycken, F.V.,
Figeys, H., Lannoye, R.L., 1992.
Photoacoustic spectroscopy as a tool for monitoring herbicide effects on triaine-resistant and –susceptible biotypes of black nightshade(Solanum nigrum). Weed Sci 40, 371-377. 9. Nakamura, C., Hasegawa, M.,
Nakamura, N., Miyake, J., 2003.
Rapid and specific detection of
herbicides using a self-assembled photosynthetic reaction center from purple bacterium on an SPR chip. Biosens. Bioelectron. 18, 599-603. 10. Follak, S., Hurle, K., 2003. Effect of
airborne bromoxynil–octanoate and metribuzin on non-target plants. Eviron. Pollut. 126, 139–146.
11. Ma, J., 2002. Differential Sensitivity to 30 Herbicides Among Populations of Two Green Algae Scenedesmus obliquus and Chlorella pyrenoidosa. Bull. Environ. Contam. Toxicol. 68, 275–281.
12. Nygaard, G., Komarek, T., Kristiase,
J., Skulberg, O.M., 1986. Taxonomic
designation of thee bioassay alga NIVA-Chll (Selenastrum capricornutum) and some related strains. Opera Botanica. 90, 5-46.
13. Oya, S.O., Alec, G., 1996. Toxicity of 2,4-D Acid to Phytoplakton. Water Res. 30, 688-696.
14. Piere-Yves, C., Lucie, M., Rober,
AK., 1996. Comparative study of
effects of MCPA, Butylate, Atrazine, and Cyanazine on Selenastrum capricornutum. Eviron. Pollut. 92, 219-225.
15. Herman, D.C., Inniss, W.E.,
Mayfield, C.I., 1990. Impact of
volatile aromatic hydrocarbons, alone and in combination, on growth of the freshwater alga Selenastrum capricornutum. Aquat. Toxicol. 18, 87-100.
16. Lewis, M.A., 1992. Periphyton photosynthesis as an indicator of effluent toxicity: Relationship to effects on animal test species. Aquat. Toxicol. 23, 279-288
17. Lewis, M.A., 1995. Use of freshwater plats for phytotoxicity testing : A review. Environ. Pollut. 87, 319-336 18. Fairchild, J.F., Ruessler, D.S.,
Carlson, A.R., 1998. Comparative
sensitivity of five species of macrophytes and six species of algae to atrazine, metribuzin, alachlor, and metolachlor. Environ. Toxicol. Chem. 17, 1830–1834.
19. Amblard, C., Couture, P., Bourdier,
G., 1990. Effects of a pulp and paper
mill effluent on the structure and metabolism of periphytic algae in experimental streams. Aquat. Toxicol. 18, 137–162.
20. Havens, K.E., Heath, R.T., 1990. Phytoplankton succession during acidification with and without increasing aluminum levels. Environ. Pollut. 68, 129–145.
21. Thomas, J.M., Skalski, J.R., Cline,
J.F., McShane, M.C., Simpson, J.C., 1986. Characterization of chemical
waste site contamination and determination of its extent using bioassays. Environ. Toxicol. Chem. 5, 487–501.
22. Klaine, S.J., Lewis, M.A., 1995. Algal and plant toxicity testing. In Hoffman DJ, Rattner BA, Burton GA Jr, Cairns J Jr, eds, Handbook of Ecotoxicology. CRC, Boca Raton, FL, USA, pp 163–184.
23. Bartlett, L., Rabe, R.W., Funk,
W.H., 1974. Effects of copper, zinc,
and cadmium on Selenastrum capricornutum. Water Res. 8, 179–185.
24. Greene, J.C., Miller, W.E., Debacon,
M., Long, M.A., Bartels, C.L., 1988.
Use of Selenastrum capricornutum to assess the toxicity potential of surface and ground water contamination caused by chromium waste. Environ. Toxicol. Chem. 7, 35–39.
25. Galassi, S., Vighi, M., 1981. Testing toxicity of volatile substances with algae. Chemosphere 10, 1123–1126. 26. Halling-Sorensen, B., Nyholm, N.,
Baun, A., 1996. Algal toxicity tests
with volatile and hazardous compounds in air-tight test flasks with
CO2 enriched headspace.
Chemosphere 32, 1513-1526.
27. U.S. Environmental Protection
Agency, 1996. Ecological Effect Test
Guildlines. OPPTS 850.5400. Algal Toxicity, Tiers II and I.
28. Organization for Economic
Cooperation and Development
(OECD ) , 1984. Alga, growth
inhibition test. OECD-Guidline No. 201; 07/06/1984 and Official Journal of European Communities, 92/69/EEC: C.3.
29. Versteeg, D.J., 1990. Comparsion of short- and long-term toxicity test results for the green alga, Selenastrum capricornutum. ASTM STP 1091: 40-48.
30. International Organization for
Standardization (ISO), 1987. Water
quality- Algal growth inhibition test. Draft International Standard ISO/DIS 8692. Geneva, Switzerland.
31. Organization for Economic
Cooperation and Development
(OECD), 2000. Guidance document
on aquatic toxic testing of difficult substances and mixtures. Environmental Health and Safety Publications Series on Testing and Assessment, No. 23. Paris, France. 32. Lin, J.H., Kao, W.C., Tsai, K.P.,
Chen, C.Y., 2005. A novel algal
toxicity testing technique for assessing the toxicity of both metallic and organic toxicants. Water Res. 39, 1869-1877.
33. Chen, C.Y., Lin, J.H., 2005. Toxicity
of chlorophenols to Pseudokirchneriella subcapitata under
Air-Tight test environment. Chemosphere (accepted).
E.R., 2005. Individual and combined
toxicity of nitriles and aldehydes to Raphidocelis Subcapitata. Environ. Toxicol. Chem. 24, 1067-1073.
35. Fairchild, J.F., Ruessler, D.S.,
Haverland, P.S., Carlson, A.R., 1997.
Comparative Sensitivity of Selenastrum capricornutum and Lemna minor to Sixteen Herbicides. Arch. Environ. Contam. Toxicol. 32, 353–357.
36. Reboud, X., 2002. Response of Chlamydomonas reinhardtii to Herbicides: Negative Relationship Between Toxicity and Water Solubility Across Several Herbicide Families. Bull. Environ. Contam. Toxicol. 69, 554-561.
37. Moreno-Garrido, I., Lubián, L.M.,
Soares, A.M.V.M., 2000. Influence of
cellular density on determination of EC50 in microalgal growth inhibition
tests. Ecotox. Environ. Safe. 47, 112-116.
38. U.S. Environmental Protection
Agency, 2005. http://www.epa.gov/cgi-bin/ecotox_qu ick_search. 39. St-Laurent, D., Blaise, C., MacQuarrie, P., Scroggins, R., Trottier, B., 1992. Comparative
assessment of herbicide phytotoxicity to Selenastrum capricornutum using microplate and flask bioassay procedures. Environ. Toxicol. Water Qual. 7, 35–48.
40. Hickey, C.W., 1991. Microtesting appraisal of ATP and cell recovery toxicity end points after acute exposure of Selenastrum capricornutum to selected chemicals. Environ. Toxicol. Water Qual. 6, 383-403.