國
立
交
通
大
學
環境工程研究所
碩
士
論
文
鍛燒溫度對釩離子摻雜二氧化鈦光觸媒物化與光催
化還原二氧化碳特性研究
The physicochemical properties and photocatalytic behavior of the
V-doped TiO
2calcined at different temperatures for CO
2reduction
研 究 生:林宸嶢
指導教授:張淑閔 副教授
I
致謝
大學畢業之後,有幸考上了交大環工所,並有幸的進入了環境奈米實
驗室,因此開啟了我的碩士生涯;歷經了兩年的寒暑,我從青澀的大學畢
業生,蛻變為能夠獨當一面的研究生,我能有這麼深遠的進步,一切都要
歸功於我的指導教授 張淑閔老師,老師教導了我很多這領域的知識,並讓
我能夠獨立思考,對自己的實驗進行規劃與研究,並培養了我認真、負責
的態度,在此學生向老師致上最深的感謝。令承蒙清華大學董瑞安老師、
台灣大學吳紀聖老師和同步輻射中心詹丁山博士,對於我的論文研究給予
很多的建議與指導,讓我能夠完善我的論文實驗。
很高興能夠進來本實驗室,這裡就像一個大家庭一樣,有歡樂、有支
持、有鼓勵、有互助,讓我的研究所生涯感到充實且歡欣。在此我要感謝
棈榮學長對於我實驗的指導,品欣學姊教導我儀器上的操作,姿吟學姊很
有耐心的替我解開實驗上的疑惑,小
G 學姊嚴謹的指正我的錯誤,穎亞學
長在二氧化碳還原上的指導與幫忙,少了你們這些親切又可靠的學長姐,
就沒有今天的我;還有我的好同學
Ashley 跟 Jiphi,少了你們,實驗室就少
了很多歡笑聲,我也少了很多支持的動力;還要感謝可愛又俏皮的學弟
Jeremy,你的逗趣,讓我在這實驗室裡不會感到孤單與乏味;最後還要感
謝我的家人,無怨無悔的支持著我,你們的鼓勵與愛護,讓我能夠全心全
力的完成學業,你們是我最強大的後援,也是讓我努力的原動力,由衷的
感謝你們,也很愛你們。
僅以本文獻給所以幫助我與關心我的大家。
宸嶢 謹誌
中華民國 100 年 8 月
II
中文摘要
近年來,利用光觸媒進行光還原二氧化碳產生燃料之議題備受矚目,其中,有很多 研究著重於參雜不純物至光觸媒二氧化鈦裡,藉由不純物減少電子電洞再結合的速率, 有效提升二氧化鈦進行光還原二氧化碳的效率。本研究利用溶膠-凝膠法(sol-gel)製備摻 雜釩離子的二氧化鈦,探討不同鍛燒溫度(200 °C-700 °C)與不同釩離子濃度(0.01 wt%與 1.00 wt%)對二氧化鈦光觸媒結構以及光還原二氧化碳的影響。研究結果顯示 TiO2經300 °C 鍛燒後呈現銳礦鈦的結構,鍛燒溫度超過 600 °C 會產生金紅石,而在 V/Ti 比例高於 1 %時,會使金紅石相在500 °C 時,提早產生,另外,當鍛燒溫度高於塔曼溫度時,釩會 往表面遷移而形成V2O5晶相,SIMS 實驗發現,高濃度釩在鍛燒 600 °C 時表面釩的濃 度為鍛燒200 °C 時的 7.6 倍,由 EPR 及 XAS 發現,在鍛燒溫度較低的樣品中,內部有 三價與四價的釩參雜在二氧化鈦晶格中,而隨著鍛燒溫度增加,釩的價態會逐漸轉變為 五價的型態,當鍛燒溫度增加到600 °C,可由 GI-XRD 觀察到明顯的表面 V2O5晶相產生,UV-VIS 光譜可發現參雜高濃度釩的樣品可明顯降低 TiO2能隙至1.6 eV。在 300-500
°C 鍛燒溫度下,觸媒對 0.01 mM Rhodamine B 光降解活性依次為 0.01 at.% V-doped TiO2> pure TiO2 > 1.00 at.% V-doped TiO2。在光還原二氧化碳的實驗裡,500 °C 鍛燒的
樣品有最高還原活性,甲烷為還原反應中唯一可測得產物,單純 TiO2在反應第一小時
有最高 CH4量子產率 2.98 %,其次為 1.00 at.% V-doped TiO2 (2.65 %) 與 0.01at.%
V-doped TiO2 (2.44 %),然而,於 8 小時反應後,各觸媒產生甲烷的量子產率依序為 1.00
at.% V-doped TiO2 (0.66 %) >單純 TiO2 (0.39 %)~0.01 at.% V-doped TiO2 (0.39 %)。EPR 光
譜發現,表面電荷於 CO2與H2O 分子間的轉移迅速,因此具低還原電位的中間產物是
限制光催化還原效率的關鍵,表面缺陷造成傳導帶下低還原能力的能階決定釩摻雜二氧
III
Abstract
In this study, the physicochemical properties and photoreduction behavior of the TiO2 samples doped with 0.01 and 1.00 at.% V ions and calined at different temperatures were investigated. The pure TiO2 exhibited anatase phase at 300 °C and underwent phase transition to rutile one at 600 °C. Incorporation of V ions decreased the transition temperature to 500 °C. Calcination greatly increased the surface V/Ti ratio of the doped TiO2 by 7.6 times as the temperature increased from 200 to 600 °C. The increase in the surface concentration of the V ions also led to the formation of V2O5 moiety. Doping 1.00 at.% V ions dereduced the bandgap energy of the TiO2 from 3.1-3.3 to 1.6 eV. For oxidation of Rhodamine B, the photocatalysts exhibited the activity in the order of 0.01 at% V-doped TiO2 > pure TiO2 > 1.00 at. % V-doped TiO2. The samples calcined at 500 °C showed the highest activity for CO2 reduction over other temperatures. CH4 was the only detectable product in the reduction systems. After 1 hr irradiation, the pure TiO2 had the highest quantum efficiency (2.98 %) for CH4 generation, followed by 1.00 at.% V-doped TiO2 (2.65 %) and 0.01 at.% V-doped TiO2 (2.44 %). However, the quantum efficiency of the photocatalysts for CH4 yield after 8 hr irradiation was in the order of 1.00 at.% V-doped TiO2 (0.66 %) > pureTiO2 (0.39 %)~0.01 at.% V-doped TiO2 (0.39 %). The EPR results showed that interfacial charge transfer from the photocatalysts to the adsorbed CO2 and H2O is efficient. Thus, the reduced intermediates determined the low reduction efficiency of CO2 to CH4. The impurity levels locating below the conduction band result in slow reduction kinetics., and the presence of V2O5 moiety at the surface inhibited the reoxidation of CH4.
IV
Index
致謝………..I 中文摘要 ... II Abstract..………III Index………..IV Table Index ... VI Figure Index ... VIIChapter 1. Introduction ... 1
1-1 Motivation ... 1
1-2 Objectives ... 2
Chapter 2. Background and Theory ... 3
2-1 Photocatalysis and Photocatalysts ... 3
2-1-1 TiO2 photocatalysts ... 3
2-1-2 Modified TiO2 photocatalysts... 8
2-2 V-doped TiO2 photocatalyst ... 10
2-2-1 Physicochemical properties of V/TiO2 ... 10
2-2-2 Photocatalytic behavior of V/TiO2 ... 12
2-3 Photoreduction of CO2 ... 14
2-3-1 Reduction behavior ... 14
2-3-2 Reaction mechanism in liquid phase ... 17
2-3-3 Reaction mechanism in gas phase ... 17
Chapter 3. Materials and Methods ... 19
3-1 Materials ... 19
3-2 Preparation of vanadium doped TiO2 using a sol-gel method ... 19
3-3 Characterization ... 20
V
3-3-2 UV/Vis diffuse reflectance spectroscopy (UV/Vis-DRS) ... 20
3-3-3 Time-of-Flight Secondary Ion Mass Spectrometer (ToF-SIMS) ... 21
3-3-4 Inductively Coupled Plasma Mass Spectrometry (ICP-MS) ... 21
3-3-5 X-ray diffractometry... 22
3-3-6 X-ray photoelectron spectroscopy (XPS) ... 22
3-3-7 Electron paramagnetic resonance (EPR) ... 23
3-3-8 Gas chromatograph (GC) ... 24
3-3-9 X-ray absorption (XAS) ... 24
3-4 Photocatalytic reduction of CO2 ... 25
Chapter 4. Results and Discussion ... 30
4-1 Chemical compositions ... 30
4-2 Microstructures ... 38
4-3 UV-Visible absorption ... 44
4-4 Photocatalytic activity ... 48
4-5 The discussion of photoreduction and oxidation activity ... 59
Chapter 5. Conclusions ... 67
References ... 68
Appendix A. XPS Analysis ... 76
Appendix B. EPR Analysis ... 79
Appendix C. Degradation of RhB ... 80
VI
Table Index
Table 2-1 The development of titanium dioxide. ... 9
Table 2-2 Summary of some important reports on photoreduction of CO2. ... 16
Table 4-1 The bulk and surface V/Ti atomic ratios of doped TiO2. ... 33
Table 4-2 EPR Parameters of Paramametic Swcies in the pure TiO2 and V-doped TiO2. ... 36
Table 4-3 The crystalline properties, surface areas and bandgaps of the pure TiO2 and V-doped TiO2 calcined at different temperatures. ... 41
VII
Figure Index
Figure 2-1 Simplified diagram of the photocatalytic processes occurring on an illuminated
semiconductors. ... 4
Figure 2-2 Schematic photoexcitation in a solid followed by deexcitation events. ... 4
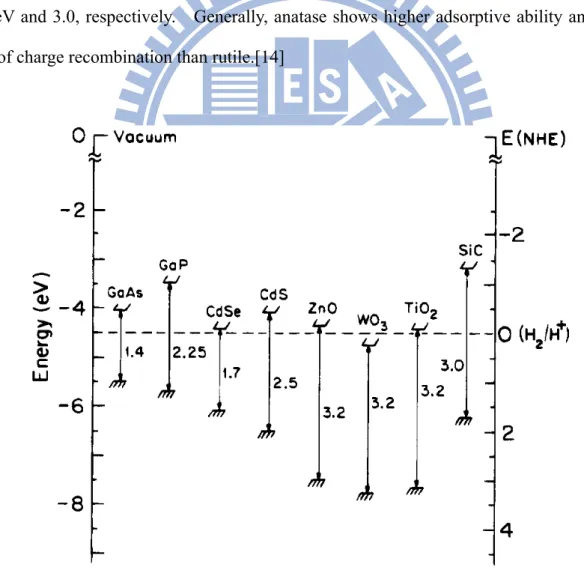
Figure 2-3 The band edge position of various semiconductors. ... 6
Figure 2-4 Structure of rutile and anatase TiO2. ... 7
Figure 2-5 Proposed V site transformations for V/TiO2 in reactant/product gas (A) and for mesoporous V-TiO2 by changing the molar ratio of V/Ti (B).[H for models a and c indicates the presence/absence of hydrogen cannot be determined. ... 11
Figure 2-6 The structure of vanadium attached to the TiO2 surface. ... 11
Figure 2-8 Band model of Ti1-xVxO2 film electrodes at bias potential in an electrolyte solution. ... 13
Figure 2-9 The bandedge positions of the different semiconductor materials and redox potentials of the different chemical species. ... 16
Figure 2-10 The photocatalytic reduction of CO2 with H2O on the titanium oxide. ... 18
Figure 3-1 A photograph of the reactor for photocatalytic reduction. ... 27
Figure 3-2 An apparatus design for photocatalytic reduction of CO2. ... 28
Figure 3-3 A photograph of the lamping system. ... 29
Figure 4-1 The XPS spectra of (a) 1.00 at.% V-doped TiO2 at 200 °C, (b) 1.00 at.% V-doped TiO2 at 700 °C and (c) 4.00 at.% V-doped TiO2 at 200 °C. ... 34
Figure 4-2 The V K-edge XA spectra of the 1.00 at.% V-doped TiO2. ... 34
Figure 4-3 EPR spectra of 1.00 at.% V-doped TiO2 at different calcination temperature at 77K in the dark. ... 35
Figure 4-4 EPR spectra of 0.01 at.% V-doped TiO2 at different calcination temperature at 77K in the dark. ... 35
Figure 4-5 The XRD patterns of the pure TiO2 at different calcination temperatures. ... 39
Figure 4-6 The XRD patterns of the 0.01 at.% V-doped TiO2 at different calcination temperatures. .. 40
VIII
Figure 4-8 The differential weight loss curves of the pure, the 0.01 at.% and 1.00 at.% V-doped TiO2.
... 42 Figure 4-9 The GI-XRD patterns of the 1.00 at.% V-doped TiO2 at different calcination temperatures.
... 42 Figure 4-10 The GI-XRD patterns of the 0.01 at.% V-doped TiO2 at different calcination temperatures.
... 43 Figure 4-11 The microstructures of the V-doped TiO2 transformed from low to high calcination
temperatures. ... 43 Figure 4-12 UV-Vis DRS spectra of (a)the pure TiO2 and (b) the 0.01 at.% V-doped TiO2 at different
calcination temperatures. ... 46 Figure 4-13 UV-Vis DRS spectra of the 1.00 at.% V-doped TiO2. ... 47
Figure 4-14 The electronic structure of 1.00 at.% V-doped TiO2. ... 47
Figure 4-15 The rate constants of the pure and the V-doped TiO2 calcined at different temperatures. 52
Figure 4-16 The photoreduction of CO2 by (a) pure TiO2 and (b) 0.01 at.% V-doped TiO2 at 400, 500,
600 °C, respectively, to produce CH4. ... 53
Figure 4-17 The photoreduction of CO2 by 1.00 at.% V-doped TiO2 at 400, 500, 600 °C, respectively,
to produce CH4. ... 54
Figure 4-18 The quantum efficiency of the pure TiO2, 1.00 and 0.01 at.% V-doped TiO2 (a) after 1-hr
irradiation and (b) after 8-hr irradiation. ... 55 Figure 4-19 The pictures of pure TiO2, 0.01 at.% V-doped TiO2 and 1.00 at.% V-doped TiO2 at 400
°C before and after photocatalystic reaction, respectively. ... 57 Figure 4-20 The pictures of pure TiO2, 0.01 at.% V-doped TiO2 and 1.00 at.% V-doped TiO2 at 500
°C before and after photocatalystic reaction, respectively. ... 58 Figure 4-21 EPR spectra of the pure TiO2 at different calcination temperature at 77K under UV
irradiation. (a) Raw data and (b) the data normalized with surface areas. ... 62 Figure 4-22. EPR spectra of the (a) 1.00 at.% V-doped TiO2 and (b) the 0.01 at.% V-doped TiO2
calcained at different temperatures. All the spectra were recorded at 77 K under UV irradiation. ... 63 Figure 4-23 EPR spectra of the pure TiO2 at different atmosphere conditions. The data recorded
IX
Figure 4-24 The concept of photocatalytic reaction of different atmosphere. ... 65
Figure 4-25 EPR spectra of the 0.01 at.% V-doped TiO2 at different atmosphere conditions. The data recorded when the UV irradiated in the beginning and after 40 mins irradiation. ... 66
Figure 4-26 The electronic structures of V2O5 at the surface of TiO2. ... 66
Appendix A-1 The XPS spectra of the 1.00 at.% V-doped TiO2 at 200 °C. (a) survey and (b) Ti (2p). ... 76
Appendix A-2 The XPS spectra of the 1.00 at.% V-doped TiO2 at 700 °C. (a) survey and (b) Ti (2p). ... 77
Appendix A-3 The XPS spectra of the 4.00 at.% V-doped TiO2 at 200 °C. (a) survey and (b) Ti (2p). ... 78
Appendix B-1 EPR spectra of pure TiO2 at different calcination temperature at 77K in the dark. ... 79
Appendix C-1 The degradation of 0.01 mM RhB by (a)the pure TiO2 and (b)the 0.01 at.% TiO2. ... 80
Appendix C-2 The degradation of 0.01 mM RhB by 1.00 at.% TiO2. ... 81
1
Chapter 1. Introduction
1-1 Motivation
In the last century, the industrial development and energy needed caused people widely used the fossil fuels in power plants and transportation. Unfortunately, the burning of fossil fuels will be accompanied by carbon dioxide emissions. Recently, using sunlight to directly converse of CO2 and water vapor into fuels by photocatalysts has been considerable concerned.[1] TiO2 (Titanium dioxide) is the widely use for decomposition of environmental pollutants because it is cheap, highly chemical stable and nontoxic characteristics.[2] To enhance its photocatalytic activity, impurities including transition metal ions including Cr, V, Mn, Fe, or Co were doped into the TiO2 lattice to modify its electronic structures and microstructures.[3-5] The benefits of the modification of the photocatalytic activity include (1) to increase the wavelength response range; (2) the inhibition of recombination by increasing the charge separation; and (3) change in the selectivity or yield of a particular product.
Many researchers focused on the photoreduction of CO2 by metal-modify TiO2. Wu et
al.[6] coated Ag-TiO2 and Cu-TiO2, respectively, on the optical fiber and Vapor-phase CO2
was photocatalytically reduced to methanol. Wang et al.[7] shows that CdSe quantum dot (QD)-sensitized TiO2 heterostructures are capable of catalyzing the photoreduction of CO2 using visible light illumination (λ> 420 nm). Some studies indicate that doping some metal ions can increase CO2 adsorption. Adachi et al.[8] reported the Cu-TiO2 powders suspended in the solution reduce CO2 and yield 21.8 μl/g, 26.2 μl/g, and 2.7 μl/g methane, ethylene, and ethane, respectively.
Vanadium ions are one of the most interesting dopants which make TiO2 visible. Klosek[3] reported that vanadium-doped TiO2 extended the wavelength range of the catalyst
2
into 365-450 nm and highly improved the photocatalytic activity of TiO2 under solar light irradiation. Choi et al.[9] showed that V4+ in TiO2 lattices effectively decreased the electron-hole recombination. Wachs et al.[10] reported that V2O5 crystals were observed on the surface of TiO2 when the temperature was higher than its Tammann temperature. The p-n junction between the V2O5 and TiO2 promoted the photocatalytic activity. Bronkema et
al. [11] showed that CO2 adsorbed on V-TiO2 is higher than pure TiO2. It means that there
is more efficiency of photoreduced CO2. However, the physicochemical and photocatalytic properties of photoreduction of CO2 by vanadium ions doped TiO2 have not been documented yet.
1-2 Objectives
In this study, we aim to investigate the effects of V-doped TiO2 on photoreduction of CO2 to hydrocarbon fuel in the gas phase. The doped materials were prepared by sol-gel method. We will find out the best ability to promote the photoreduction of vanadium doping concentration, calcination temperature, the mechanism and physicochemical properties of photoreduction of CO2 by V-doped TiO2.
3
Chapter 2. Background and Theory
2-1 Photocatalysis and Photocatalysts
2-1-1 TiO2 photocatalysts
In 1972, photocatalysis of TiO2 nanoparticles has been found that can be used for degrading pollutions in water or air. Afterward, many investigations have been carried out with the aim of enhancing photocatalytic efficiencies of the process. In order to improve the efficiency of photoactivity, impurities including transition metal ions including Cr, V, Mn, Fe, or Co were doped into the TiO2 lattice to modify its electronic structures and microstructures. [3-5, 12] Nowadays, TiO2 has been widely used in industrial application such as solar energy cell[13], photocatalysis[14], gas sensors[15] and CO2 photoreduction.[16]
The energy difference between the energies of the valence band and the conduction band of electron energy in semiconductors is called the band gap. Generally, semiconductor can be excited by energy in terms of photon energy, hν. A photon will excite an electron from the valence band to the conduction band, thereby the excited semiconductor has electrons and holes pairs for further redox reactions.[17-19] This process also shows in Figure 2-1.
When the heterogeneous photocatalyst absorbs UV energy which is higher or equal to the band gap energy of semiconductors, it will generate the electron-hole pair (e--h+ pair). While several situations of the electron-hole pair may occur. The electron-hole pair can recombine in the bulk or on the surface of the particle in a few nanoseconds. The electron-hole pair can migrate to the photocatalyst surface and then be trapped in surface states. The electron-hole pair trapped in surface states can proceed the redox reaction with the compounds adsorbed on the catalyst. Figure 2-2 shows the basic electron transitions in an activated semiconductor.
4
Figure 2-1 Simplified diagram of the photocatalytic processes occurring on an illuminated semiconductors.[20]
5
Thermodynamically, the adsorbed pollutants can be photoreduced by conduction band (CB) electrons if they have redox potentials more positive than the flatband potential of the CB. Also, they can be oxidized by holes in the valence band (VB) if they have redox potentials more negative than the flatband potential of the VB. The proposed mechanisms can be expressed by the following set of simplified equations step by step.[20]
Step I: Band gap illumination (hv) onto a photocatalyst causes the electronic transitions.
+ − + ⎯→ ⎯ e h TiO hv 2
Step II: Organic molecule adsorbed on the catalyst surface and lattice oxygen (OL2-).
ads IV IV IV L IV L R R Site OH Ti O H Ti OH Ti H O Ti O 1 1 2 2 → + − → + − + → + − − − −
where R1 represents an organic molecule, R1ads represents an adsorbed organic molecule Step III: Photogenerated holes oxidize the adsorbed OH- and water and electrons react with adsorbed O2. − • − + + + • + • + − − → + → + → + + − → + − − → + − 2 2 1 1 2 O Ti O Ti Ti e Ti R h R H OH Ti h O H Ti OH Ti h OH Ti IV III III IV ads ads IV IV IV IV
The free radicals attack the organic molecule under different conditions: Case I
Case II Case III Case IV
In recent years, numerous photocatalyst materials, such as TiO2, ZnO, ZnS, SnO2 and CdS, have been widely discussed and applied in dealing with water pollution or air pollution.
2 1 2 1 2 1 2 1
R
R
OH
R
Ti
R
OH
Ti
R
R
OH
R
Ti
R
OH
Ti
IV IV ads ads ads IV ads IV→
+
+
→
+
−
→
+
+
→
+
−
• • • •6
Figure 2-3 shows the redox potentials of various semiconductors. The titanium dioxide has been attracting more attention due to its non-toxicity, chamical stability, high photocatalytic activity, optical properties, low cost and suitable band gap energy.[21, 22]
TiO2 has two polymorphs: anatase and rutile. Figure 2-4 shows the crystalline structures of the anatase and rutile TiO2. Each Ti4+ ion is surrounded by an octahedron of six O2- ions. In the anatase structure, each octahedron contacts with 8 neighboring octahedrons, while in the rutile structure each octahedron contacts with 10 neighbors. The metastability of the anatase phase can transfer leads phase transformation to the rutile phase when calcination temperature is higher than 550 °C. The band gap of anatase and rutile are 3.2 eV and 3.0, respectively. Generally, anatase shows higher adsorptive ability and lower rate of charge recombination than rutile.[14]
7
8
2-1-2 Modified TiO2 photocatalysts
Photocatalytic activity of a particular semiconductor system for the stated purpose was measured by some factors like the efficiency of the photocatalytic process, the stability of the semiconductor under illumination, the wavelength range response, and the selectivity of the products. Therefore, the limitations of a particular semiconductor as a photocatalyst for a particular use can be overcomed by modifying the semiconductor. There are three benefits of modifications to photocatalytic semiconductor systems: (1) inhibiting e--h+ recombination by increasing the charge separation and increasing the efficiency of the photocatalytic process; (2) increasing the wavelength response range and (3) changing the selectivity or yield of a particular product.
The typical modifications include doping transition metal ions (Cr, V, Fe)[3-5] or non metal ions (C, N)[23, 24] into TiO2 lattice and combining TiO2 with another semisonductor (CdSe)[7]. The modifications change the microstructures and electronic structures, so that alter the physicochemical properties and photocatalytic acitivity. Among those researches, doping vanadium seems to be an effective route in the theoretical viewpoint. Zhao et al. and Wu et al. [25, 26] found that V-doped TiO2 resulted in a red shift of the absorption band edge. Anpo et al. [27] modified TiO2 catalysts by bombarding V, Cr, Mn, Ni, or Fe, respectively, with high-energy metal ions. The metal ion-implanted TiO2 showed the V ions had the highest effectiveness in the red shift. Table 2-1 lists some important literatures of TiO2 and V-doped TiO2.
9
Table 2-1 The development of titanium dioxide.
Year Authors The results and findings Ref.
1972 Fujishima et al. First developed electrochemical photolysis of water at a
semiconductor electrode.
[28]
1992 Davidson et al. Investigated temperature-induced diffusion V ions into the TiO2 by ESR techniques
[29]
1994 Choi et al. Summarized metal-ion dopants in quantum-sized TiO2 [9]
1995 Linsebigler et al. Summarized the mechanisms of photocatalysis of TiO2 [17] 1999 Litter et al. The mechanisms of photocatalysis of metal ions doped in TiO2 [20] 1999 Zhao et al. Sol-gel preparation of Ti1-xVxO2 solid solution film electrodes
with conspicuous photoresponse in the visible region [25] 2001 Rodella et al. Chemical and structural characterization of V2O5/TiO2 catalysts [30] 2002 Zhao et al. Photoelectrochemical properties of sol-gel-derived Ti1-xVxO2 [31] 2004 Wu et al. A visible-light response vanadium-doped titania nanocatalyst
by sol–gel method [26]
2005 Anpo et al. The preparation and characterization of highly efficient titanium oxide-based photofunctional materials
[27]
2006 Kemp et al. Characterisation of transition metal-doped TiO2 [4]
2007 Bouras et al. The structural of pure and metal-ion-doped nanocrystalline titania for photocatalysis
[5]
2008 Izumi et al. Photo-oxidation over mesoporous V-TiO2 catalyst under visible light monitored by vanadium K β 5,2-selecting XANES spectroscopy
[32]
2010 Xu et al. Photocatalytic activity of vanadium-doped titania-activated
carbon composite film under visible light [33]
2010 Hoffmann et al. Combinatorial doping of TiO2 with platinum (Pt), chromium (Cr), vanadium (V), and nickel (Ni) to achieve enhanced photocatalytic activity with visible light irradiation
[34]
2011 Chang et al. Surface doping is more beneficial than bulk doping to the
photocatalytic activity of vanadium-doped TiO2
10
2-2 V-doped TiO2 photocatalyst
2-2-1 Physicochemical properties of V/TiO2
Transition metal doping can change the physicochemical properties of TiO2. In order to understand the structure of vanadium in titanium dioxide, FT-Raman can help us to understand the structure of the vanadium doped TiO2 catalysts. Figure 2-5 and Figure 2-6 show the structure of bulk and surface doped materials. There are two forms of VOX species attached to the TiO2 surface for surface doped materials: monomeric vanadyl and polymeric vanadates.[30, 36, 37] In addition, the potentially active oxygen sites proposed to be interface V-O-Ti, surface Ti-O-Ti (638 cm-1), bridging V-O-V( 822 cm-1), and vanadyl V=O (1030 cm-1). When the number of vanadium in the polyvanadates increase, the number of terminal V=O (930 cm-1) decreases and forms the number of accommodate V-O-V (822 cm-1) linkages.[30, 36, 37] It shows that the vanadium ions are preferred to perform V2O5 under higher vanadium concentration. The doped vanadium ions diffused to the sample surface and formed V2O5 crystals when the calcination temperature was higher than their Tammann temperature(i.e. 209°C).[29, 38]
11
Figure 2-5 Proposed V site transformations for V/TiO2 in reactant/product gas (A) and for mesoporous V-TiO2 by changing the molar ratio of V/Ti (B).[H for models a and c indicates the presence/absence of hydrogen cannot be determined.[37]
12
2-2-2 Photocatalytic behavior of V/TiO2
When doping the impurity into TiO2, the defect can trap an electron or a hole alone and decrease the recombination time. Generally, The photochemical mechanisms, including charge recombination, charge-trapping, and migration mechanism, in the existence of transition metal ion dopants is showed as Figure 2-7 where Mn+ is a metal ion dopant, R is an electron donor, and O is an electron acceptor:
Figure 2-7 The photochemical mechanism in the present of transition metal ions.[9]
The addition of moderate transition metals into TiO2 can increases the rate of photocatalytic oxidation, because the electron scavenges by the transition metal ions at surface through the following reaction: Mn+ + ecb- → M(n-1)+. The transition metal ions prevent electron-hole recombination and result in an increase rate of formation of OH‧
13
radical. In addition, the valence of the transition metal ions can also affect charge trapping. If the dopants act as holes trapping and electrons trapping, it can decrease the rate of recombination. For example, V4+ can act as both an electron trap and a hole trap in TiO2 lattice. Thus, the photoactivity of V4+ is significantly higher than that of V5+ since V5+ can only trap electrons.[9]
Figure 2-8 Band model of Ti1-xVxO2 film electrodes at bias potential in an electrolyte solution.[31]
Besides, the atomic ratio of V/Ti can affect the electronic structure. Figure 2-8 shows the band model of Ti1-xVxO2 at bias potential at various atomic ratio of V/Ti. The filled V 3d level acted as a donor level in the band gap. For V/Ti between 0 and 0.05 samples, the recombination time was longer than without V sample. That is because the V 3d level in the band gap inhibited the electron-hole recombination. However, when the amount of the V increased (V/Ti 0.1), the donor level≧ may connect with the conduction band. The crystals may shorten the distance between the V 3d level and the top of the valence band. Summary, changing the atomic ratio of V/Ti affect the electronic structure of materials.[31]
14
2-3 Photoreduction of CO2
2-3-1 Reduction behavior
Fossil fuels are the most important source of energy in the world because of their stability and high energy density (33GJ/m3 for gasoline). Unfortunately, Due to mass consumption of fossil fuels, it could release a large amount of CO2 which is a kind of greenhouse gas. Many researchers suggest that the average global temperature will increase by about 6 °C in the end of this century. Hansen et al. used paleoclimate data to find out that an average global temperature change of 6 °C can lead to melting the ice in Antarctica and Rising sea levels.[40] Therefore, fossil fuels depletion and global warming have become the urgent environmental problems in the world.
In order to reduce the amount of CO2, scientists use a lot of methods to collect CO2 or convert CO2 into hydrocarbon fuels. Biomass to fuel conversion shows the most promising way to biofuel production. Chisti et al. [41] shows that the microalgae have a oil content of more than 30%. Unfortunately, microalgae has some drawbacks: the energy conversion efficiency of photosynthesis is only approximately 1% and the microalgae required great land and water areas. Thermochemical has been used in converting CO2 into CO. Galvez et al. and Bamberger et al.[42, 43] use Zn/ZnO cycle and CeO2, respectively, to reduce CO2 to CO. However, a number of materials challenges associated with large energy requirement in the reaction need to be solved for its development.
15
Using solar energy to convert CO2 and water vapor into hydrocarbon fuels by photocatalysts become an attractive prospect. Be able to reduce carbon dioxide by using the photocatalysts, the conduction band of photocatalyst must be higher than the reduction potential of CO2. The excited electronic from the conduction band can be transferred to CO2 and then reduced CO2. Inoue et al.[44] suggested that conversion of CO2 to methane was given by O H CH e H OH CH OH CH e H HCHO O H HCHO e H HCOOH HCOOH e H CO H O h O H aq 2 4 3 3 2 ) ( 2 2 2 2 2 2 2 2 2 2 2 2 1 2 + → + + → + + + → + + → + + + → + − + − + − + − + + +
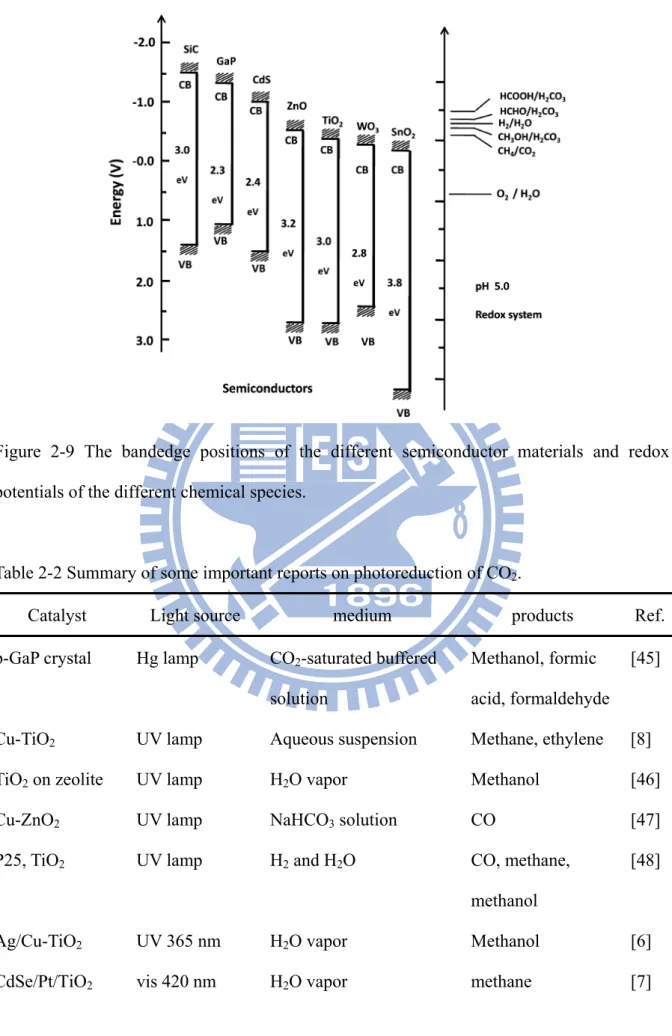
which e- and h+ mean photogenerated electrons and holes, respectively. Figure 2-9 shows the bandedge positions of the different semiconductor materials and redox potentials of the different chemical species. If the conduction band edge lies at a higher position than the redox potential, that is believed to be responsible for the high rates of product formation. The reaction also need a hole-scavengers to inhibit the recombination of hole–electron pairs. Scientific studies on photoreduction of CO2 by semiconductor are listed in Table 2-2.
16
Figure 2-9 The bandedge positions of the different semiconductor materials and redox potentials of the different chemical species.
Table 2-2 Summary of some important reports on photoreduction of CO2.
Catalyst Light source medium products Ref.
p-GaP crystal Hg lamp CO2-saturated buffered solution
Methanol, formic acid, formaldehyde
[45]
Cu-TiO2 UV lamp Aqueous suspension Methane, ethylene [8]
TiO2 on zeolite UV lamp H2O vapor Methanol [46]
Cu-ZnO2 UV lamp NaHCO3 solution CO [47]
P25, TiO2 UV lamp H2 and H2O CO, methane,
methanol
[48]
Ag/Cu-TiO2 UV 365 nm H2O vapor Methanol [6]
17
2-3-2 Reaction mechanism in liquid phase
Some reseachers focus on the CO2 reduction by photocatalysts in the liquid phase. Halmann et al. used the SrTiO3 catalyst powder suspended in a liquid phase through which CO2 was bubbled, to produce formic acid, formaldehyde, and methanol by natural sunlight.[49] Sayama et al. reported that use of 1% Cu-loaded ZrO2 catalyst for photocatalytic reduction of CO2 to produced CO in NaHCO3 solutions under UV irradiation.[47] Tseng et al. used Cu-loaded titania to photoreduce CO2 to produce methanol. The methanol yield was Greatly increased by adding NaOH because NaOH in liquid could act as strong hole-scavengers, form OH radicals and enhance the solubility of CO2.[50] Pressure is also a very important parameter on photocatalytic reduction of CO2 in solutions. Takayuki showed that the optimum value of CO2 pressure on photoreduction can produce the highest methanol.[51] In summary, adjusted some important Parameters in photoreaction of solution phase, like the solubility, the optimum value of CO2, and high active hole-scavengers, can increase the photoreduction of CO2 to produce hydrocarbon fuels.
2-3-3 Reaction mechanism in gas phase
In recent years, more and more attention has been focus on the photocatalytic reduction of gaseous CO2. The general selection of hole-scavengers are H2 gas or water vapor. The photoactivity of CO2 reduction are effective by H2. Lo et al.[48] reduced CO2 with H2 and H2O to produce methane, ethane and CO. But hydrogen is artificial production which need Additionally input the energy. Therefore, a lot of researchers focus on the photoreduction of CO2 with H2O. Wang et al.[7] shows that CdSe quantum dot (QD)-sensitized TiO2 heterostructures are capable of catalyzing the photoreduction of CO2 using visible light illumination (λ> 420 nm) in the presence of H2O. However, carbon dioxide and water vapor
18
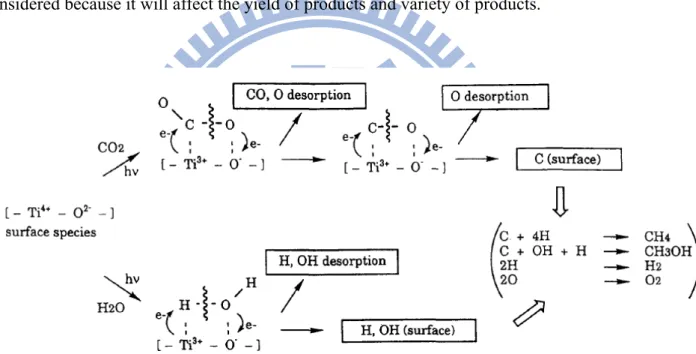
are competitive adsorptions. In Figure 2-10, Anpo et al.[46] showed the reaction mechanism of the photoreduction of CO2 with H2O on the anchored titanium oxide catalyst. H2O and CO2 molecules interacted with the excited state of photoinduced (Ti3+-O-)* species, the decomposition of H2O and the reduction of CO2 proceed competitively, depending on the ratio of CO2 to H2O. These interactions resulted in the formation of OH radicals, H atoms and carbon species, and these intermediate radical species react with each other to form CH4 and CH3OH. In summary, the choice of hydrogen and water vapor to be the hole-scavenger can effect the mechanism of photoreduction of CO2. The ratio of CO2 to H2O must be considered because it will affect the yield of products and variety of products.
19
Chapter 3. Materials and Methods
3-1 Materials
The precursors of titania and vanadium were titanium isopropoxide (TTIP, Acros, 98 %+) and vanadium (V) oxytriisopropoxide (VTIP, Aldrich, 99 %+), respectively. 2-propanol (C3H7OH, J.Backer, 100 %) was used as solvent to dissolve the precursors. Rohdamine B (RhB, C28H31N2O3Cl, Sigma Aldrich, Dye content 95 %) was used to test the activities of the photocatalysts. Hydrogen acid (HCl, Crown, 35~37 %) was used to adjust the pH values of the hydrolyzed sol solution.
3-2 Preparation of vanadium doped TiO2 using a sol-gel method
In the beginning, VTIP and TTIP were dissolved in 70 mL isopropanol to obtain the V/Ti atomic ratios of 1×10⁻⁴ and 1×10⁻². Afterward, 2 mL hydrochloric acid (24.5%, HCl) was injected into mixed solution at 4°C with stirring at 250 rpm for 9 hours to complete the hydrolysis of the VTIP and TTIP. Then, the solutions underwent gelation at ambient temperature for 4 hours. The doped TiO2 powders were obtained after solvent was evaporated at 100°C for 2 days followed by 150°C for 3 hours. The powders were then calcined under air at various temperatures (200~ 700°C).
20
3-3 Characterization
3-3-1 Specific surface area
TriStar 3000 gas adsorption analyzer was used to measure the BET (Brunauer, Emmett, and Teller) surface area of catalysts by N2 physisorption. The surface area of the samples was estimated according to the N2 adsorption data by the BET model. Before the N2 adsorption, the sample was dried at 90 °C for 3 h and degassed at 120 °C for 6 h.
3-3-2 UV/Vis diffuse reflectance spectroscopy (UV/Vis-DRS)
The wavelength response range of the samples was recorded using an UV-vis spectrometer (HITACHI U-3010). The Al2O3 was used to be the reference. The spectra were recorded from 700 to 200 nm at a scanning rate of 300 nm/min. The bandgap of samples can be calculated by transformed the spectra into absorption according to Kubelka-Munk equation.[52] S k R R R F = − = 2 ) 1 ( ) ( 2 (3-1)
21
3-3-3 Time-of-Flight Secondary Ion Mass Spectrometer (ToF-SIMS)
ToF-SIMS (ION-TOF, Munich, Germany) was used to analyze the surface composition of the sample. The primary ion source was a pulsed Ga+ source operated at 25 keV. The sputter time was 120 s. The pressure of the main chamber was around 10-9 mbar. The surface atomic ratio was calculated by sub-equation
RSF I I m i i = ρ (3-2)
Where RSF (relative sensitivity factor) is the conversion factor from secondary ion intensity to atom density, the unit of RSF is atoms/cm3,ρi is the impurity atom density in atoms/cm3, Im is the matrix isotope (Ti, m/z= 50.8) secondary ion intensity in counts/s and Ii is the impurity isotope (V, m/z= 47.9) secondary ion intensity in counts/s.
3-3-4 Inductively Coupled Plasma Mass Spectrometry (ICP-MS)
Bulk chemical compositions for V/Ti weight ratio was analyzed by Inductively coupled plasma mass spectrometry (ICP-MS, Perkin Elmer, SCIEX ELAN 5000). It is based on coupling together an inductively coupled plasma as a method of producing ions (ionization) with a mass spectrometer. All the samples were digested with acid solution coupled with microwave.
22
3-3-5 X-ray diffractometry
The X-ray powder diffractometer (XRPD, MAC Sience, MXP18) was used to examined the crystal structure and grain size by using the CuKα radiation (λ= 0.15405 nm) and the operating conditions are at an accelerating voltage of 30 kV and an emission current of 20 mA. The range of the scanning 2θ is from 15° to 80° at sample width of 0.02° and scanning speed is 4°/min. The crystalline size (D) of all samples was estimated from Scherrer’s equation:[53] θ β λ cos × × = K D (3-3)
Whereλis the x-ray wavelength (Cu Kα= 0.15406 nm), β is the width of the peak (full width at half maximum, FWHM), K is the Scherrer constant and θis the Bragg angle. The weight ratio of rutile phase (WR) can be estimated by the sub-equation
R A R R A A A W + = 884 . 0 (3-4)
where AA is intensity of anatase (101) peak and AR is intensity of rutile (110) peak.
3-3-6 X-ray photoelectron spectroscopy (XPS)
The X-ray photoelectron spectroscopy (XPS, ESCA PHI 1600 spectrometer) was used to identify the surface chemical compositions and chemical state by using the AlKα radiation (1486.6 eV). All the analytical process in the chamber was controlled under ultrahigh vacuum at the pressure below 1.4 ×10⁻⁹ Torr. The collection step sizes in wide range scan
23
and high-resolution analysis are 1.0 eV and 0.1 eV, respectively. The C 1s peak at 284.8 eV was used to be the reference. The integrated peak areas of spectra were estimated using sensitivity factors to determine the surface atomic ratios. The equation for atomic ratio is calculated by the sub-equation
2 2 1 1 2 2 1 1 2 1 ASF A ASF A ASF I ASF I n n = = (3-5)
where n means the atomic numbers, I means the intensity of species on XPS spectra, A is the peak area, ASF stands for the atomic sensitive factor of element and Arabic number represents elemental types.
3-3-7 Electron paramagnetic resonance (EPR)
The electron paramagnetic resonance spectrometer (EPR, Bruker EMX-10/12) was used to examine the photo-induced charge carriers at X-band frequency. The measurements were carried out at 77 K in darkness or under irradiation. The conditions of the instrument were set at a center field of 3500 G and a sweep width of 2000 G. The microwave frequency was 9.49 GHz and the power was 1.0 mW.
24
3-3-8 Gas chromatograph (GC)
The gaseous sample after photolysis was analysed using gas chromatography (GC, Thermo TRACE GC Ultra) using a FS Cap Supel-Q PLOT column of 30 m length with a diameter of 0.53 mm. Helium was used as a carrier gas. Thermal conductivity detector (TCD) and flame ionization detector (FID) were used for analyzing the gaseous samples, such as CH4, CH3OH.etc.
The calibration curve is used to determine the concentration of the CH4 production. First, the pure N2 gas purged the reactor for 1 hour to ensure the air was eliminated. After closed the valves, 10 μL CH4 was injected into the reactor. Then, 20 μL, 50 μL, 100 μL, 200 μL, 300 μL, 400 μL and 500 μL of gas in reactor were detected by GC to establish the calibration curve. Appendix D-1 shows the calibration curve of CH4.
3-3-9 X-ray absorption (XAS)
The X-ray absorption (XAS) spectra was used to identify the valence of the vanadium ions within the TiO2 lattice recorded at BL 16A at Taiwan Synchrotron Radiation Research Center (NSRRC). The measurements were carried out at Ambient temperature. The V K-edge spectrum was received using a fluorescence mode. The linear absorption coefficient (μ) was estimated in term of the ratio between incident (I0), fluorescence intensities (If). The
following equation can be expressed by sub-equation:
25
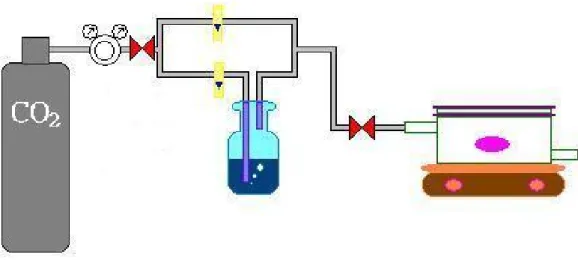
3-4 Photocatalytic reduction of CO2
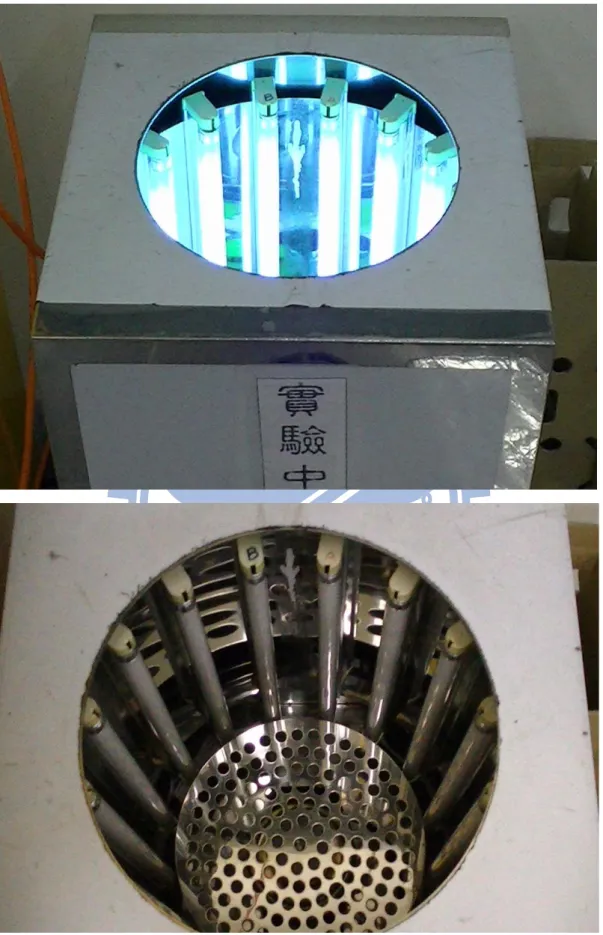
First, the 0.05 g samples were loaded on the Glass fiber filter paper(ADVANTEC GC-50), then filter paper was placed in the middle of reactor. The reactor has the size of 50 mm (length) × 74 mm (diameter) and the total volume of 220 ml. The reactor was covered by a quartz glass that can let UV light passing through as shown in Figure 3-1. Carbon dioxide (99.9%) is splitted into two pipelines, which one is for dry CO2 and the other one flowed through the DI water for humidification. The different split ratios of these two streams can be adjusted the humidity in the system, which was set about 90% in this study (as shown in Figure 3-2). In our case, the catalysts were pretreated by heated (heating) at 120 °C for 1h in air and were irradiated with the UV light (λ<305nm) for 12 hours. The magnet stirred to homogenize the gaseous system through the photocatalysis. Prior to the photoreduced experiments, the humidified CO2 gas purged the reactor for 1 hour to ensure the air was eliminated. After that, the valves located at outlet and inlet of the reactor were closed. Then, UV irradiation of the catalysts was carried out under irradiation of 16 UV lamps (8 W) at 305 nm for 8 hours. Figure 3-3 displays the photograph of the photocatalytic system.
Quantum efficiency is generally used to universally evaluate the photocatalytic performance of a certain photocatalyst and system design. The quantum efficiency therefore depends on both the collection of charges and the absorption of light. Since eight moles of electrons are required to produce 1 mol of methane from CO2, the quantum efficiency of a photocatalyst for photocatalytic conversion of CO2 to CH4 is expressed as Equation 3-7.
quantum efficiency (%) = × 100 (3-7) 8 × moles of methane yield moles of incident UV photon
26
The equation for moles of UV photon absorbed by catalyst is calculated by the sub-equation.
In our study, the absorbed photon flux detected by photometer is 1.2 × 10⁻⁴ W/cm2. The surface area received UV-light is 8.042 cm2. T means the radiation time. The each photon energy at 305 nm wavelength is 6.517 × 10⁻¹⁹ J.
moles of incident UV photon = (3-8) Absorbed photon flux (W/cm 2) × SA (cm2) × T (s)
27
28
29
30
Chapter 4. Results and Discussion
4-1 Chemical compositions
To understand the chemical states and chemical compositions of the vanadium ions at the surface sites and in the bulk lattice of the doped TiO2, the V-doped TiO2 samples calcined at different temperatures were characterized using SIMS, ICP-MS, XPS, XAS, and EPR. Table 4-1 lists the bulk and surface V/Ti ratios of 1.00 and 0.01 at.% V-doped TiO2. The total V/Ti ratios in the 1.00 at.% V-doped TiO2 calcined at 200 and 500 °C were 1.03 × 10⁻², which were similar to the added one, indicating the non-volatility of the vanadium ions in the TiO2 matrix. Although the surface V/Ti ratio at 200 °C (1.17 × 10⁻²) was close to the total ratio (1.03 × 10⁻²), the surface V/Ti ratio increases when the calcination temperature increased and reaches 7.6 times when the calcination temperature increased to 600 °C (8.86%). The total V/Ti ratios in the 0.01 at.% V-doped TiO2 calcined at 200 and 500 °C were 1.15 × 10⁻⁴ and 1.04 × 10⁻⁴ , respectively, also indicating the non-volatility of the vanadium ions in the TiO2 matrix. The surface V/Ti ratios in the 0.01 at.% V-doped TiO2 increases 2.95 times when the calcination temperature increased from 200 (1.15 × 10⁻⁴) to 600 °C (3.39×10⁻⁴), which were similar to the 1.00 at.% V-doped TiO
2. This phenomenon reveals the diffusion of the vanadium ions from the inside lattice to the surface. Davidoson and Che[29] reported that metal ions migrate to the surface of matrix above the Tammann temperature at which the thermal vibrations of cations are strong enough for lattice diffusion. Since the Tammann temperature of V2O5 is 209 °C, some vanadium ions migrated from bulk lattice toward to surface lattice of TiO2 above this temperature in this study.
Figure 4-1 shows the V 2p XP spectra of the 1.00 at.% and 4.00 at% V-doped TiO2 calcined at different temperatures. The V 2p photoelectron lines of the 1.00 at.% V-doped TiO2 were insignificant after calcination at 200 °C. Whereas, the sample showed the V 2p3/2
31
and 2p1/2 peaks centered at 517.5 and 524.3 eV, respectively, at 700 °C.[54] Similar result was found in the 4.00 at.% V-doped TiO2 sample at 200 °C. These phenomena reveal that V5+ ions were mainly at the TiO2 surface, and again prove that their concentration increased with calcination temperature. Figure 4-2 shows the V K-edge XA spectra of the 1.00 at.% V-doped TiO2. The XAS shows the pre-edge absorptions of the V3+, V4+ and V5+ ions at 5469.9, 5470.3 and 5470.6 eV, respectively, indicating the reduced V ions within the TiO2 lattice.[35, 55-57] The intensity variation is noteworthy. The intensity increases with increasing calcination temperature. The result shows the square-pyramidal symmetry (as in V2O5) gradually formatted when increasing calcination temperature.[58] The rising-edge energy values shift from 5481.5 to 5482 eV. The result indicates the valence state of vanadium transformed to higher state.[56, 59-61] The V3+ and V4+ ions contributed a large portion at low temperatures, and they were gradually transformed to the V5+ state at elevated temperatures. Since the transformation occurred along with the thermal induced migration of the V ions, the oxidation of V3+/V4+ was possibly resulted from their interaction with O2 in the atmosphere when the reduced ions diffused to the surface. The XAS shows the near-edge appeared two peaks at 5492 and 5550 eV when calcination temperature above 600 °C. According to the literature, at temperature above to 600 °C, the V4+ ions are incorporated within the rutile structure.[62]
Figure 4-3 shows the EPR spectra of the 1.00 at.% V-doped TiO2 at different calcinations temperatures in the dark at 77K. In this study, the hyperfine structure of V4+ ions were resulted from the interaction between the vanadium nucleus spin (I=7/2) and the unpaired 3d1 electron. The peaks at 300 and 400 °C show the following EPR parameters: g⊥=1.959, A⊥ =57 G and g∥=1.917 , A∥=173 G. [63-65] This results indicate that there are V4+ ions in
the anatase phase of the V-loaded sample. When the calcination temperature increases from 300 to 600 °C, the intensity of the peaks are decreased. The results indicate that the phase transformed to the rutile phase. However, the peaks at 500 and 600 °C show another
32
following EPR parameters: gxx ,gyy =1.913, Axx = 31 G, Ayy= 43 G and gzz =1.956 , Azz =152
G.[63, 66] This results indicate that there are V4+ ions in the rutile phase of the V-loaded sample. Because the XPS spectrum indicates the vanadium on the surface are V5+ ions, V4+ ions are indicated in the bulk of TiO2.[62] Figure 4-4 shows the EPR spectra of the 0.01 at.% V-doped TiO2 at different calcinations temperatures before and after UV irradiation at 77K. The peaks at 300 and 400 °C show the following EPR parameters: g⊥=1.986.[67] This results indicate that there are V4+ ions in the interstitial sites in the anatase phase of the V-loaded sample. This signals decrease when the calcination temperature increased from 300 to 600 °C. The results indicate that the phase transformed to the rutile phase. However, The peaks at 500 and 600 °C indicate another following EPR parameters: gxx ,gyy
=1.913, Axx = 31 G, Ayy= 43 G and gzz =1.956 , Azz =152 G. This results show that there are
V4+ ions in the rutile phase of the V-loaded sample. Table 4-2 lists the g=factor of EPR.
33
Table 4-1 The bulk and surface V/Ti atomic ratios of doped TiO2.
Added V/Ti ratios calcination temperature Bulk V/Ti ratios (ICP-MS)
Surface V/Ti ratios (SIMS) 1.00 at.% V/Ti 200 °C 1.03×10⁻² 1.17×10⁻² 1.00 at.% V/Ti 300 °C 1.08×10⁻² 2.08×10⁻² 1.00 at.% V/Ti 400 °C 1.07×10⁻² 4.48×10⁻² 1.00 at.% V/Ti 500 °C 1.03×10⁻² 8.51×10⁻² 1.00 at.% V/Ti 600 °C 1.14×10⁻² 8.86×10⁻² 0.01 at.% V/Ti 200 °C 1.15×10⁻⁴ 1.15×10⁻⁴ 0.01 at.% V/Ti 300 °C 0.94×10⁻⁴ 1.21×10⁻⁴ 0.01 at.% V/Ti 400 °C 1.38×10⁻⁴ 1.89×10⁻⁴ 0.01 at.% V/Ti 500 °C 1.04×10⁻⁴ 2.56×10⁻⁴ 0.01 at.% V/Ti 600 °C 1.26×10⁻⁴ 3.39×10⁻⁴
34 526 524 522 520 518 516 514 6000 8000 10000 12000 14000 (c) (a) (b) O Satellite V5+ 2P 1/2:524.3 eV V5+ 2P 3/2:517.5 eV Intensity eV
Figure 4-1 The XPS spectra of (a) 1.00 at.% V-doped TiO2 at 200 °C, (b) 1.00 at.% V-doped TiO2 at 700 °C and (c) 4.00 at.% V-doped TiO2 at 200 °C.
5450 5460 5470 5480 5490 5500 5510 0.0 0.5 1.0 1.5 2.0 2.5 3.0 3.5 200 oC 300 oC 400 oC 500 oC 600 oC V5+: 5470.6 eV V4+: 5470.3 eV V3+: 5469.9 eV
N
orm
alized absorption
E(eV) 700 oC35 2800 3000 3200 3400 3600 3800 4000 4200 0 10000 20000 30000 40000 50000 60000 70000 80000 90000 100000 600 oC 500 oC 400 oC 300 oC 200 oC in ten sity G
Figure 4-3 EPR spectra of 1.00 at.% V-doped TiO2 at different calcination temperature at 77K in the dark. 3000 3500 4000 -30000 -20000 -10000 0 10000 20000 30000 40000 50000 60000 600 oC 500 oC 400 oC 300 oC 200 oC in te n sity G
Figure 4-4 EPR spectra of 0.01 at.% V-doped TiO2 at different calcination temperature at 77K in the dark. gzz =1.956, Azz =152 G gxx ,gyy =1.913 Axx = 31 G, Ayy= 43 G 2800 3200 3600 4000 4400 400 oC 300 oC G g∥ =1.917, A∥ =173 G g⊥ =1.959, A⊥ =57 G gzz =1.956, Azz =152 G gxx ,gyy =1.913, Axx = 31 G, Ayy = 43 G g⊥ =1.986
36
Table 4-2 EPR Parameters of Paramametic Swcies in the pure TiO2 and V-doped TiO2.
g factor assignment Ref.
EPR Parameters of Ti3+ (electron center) Radicals g1=1.990; g2=1.990; g3=1.960 Ti 3+ (hydrated anatase) [68] g1=1.961; g2=1.992; g3=1.992 Ti 3+ (colloidal TiO 2) [69] g⊥=1.990; g∥=1.957 Ti 3+ (anatase) [70] g⊥=1.975; g∥=1.940 Ti 3+ (rutile) [70] g⊥=1.925; g∥=1.885 Ti
3+ ( surface Ti3+ in colloidal TiO
2 ) [71]
EPR Parameters of Oxygen Related Signals (hole center) g1=2.004; g2=2.009; g3=2.023
g⊥=2.022; g∥=2.004
g1=2.003; g2=2.008; g3=2.035
organic peroxyl (e.g., ROO.
) carboxyl radical of cysteine (CH3)3N+CH2OO. [72] g1=2.003; g2=2.009; g3=2.024 g1=2.003; g2=2.009; g3=2.025 g1=2.003; g2=2.009; g3=2.021 Ti4+-O2- on anatase [68, 69, 72] g1=2.002; g2=2.009; g3=2.034 g1=2.002; g2=2.003; g3=2.034 Ti4+-O 2H [72] g1=2.002; g2=2.016; g3=2.028 g1=2.004; g2=2.018; g3=2.030 g1=2.007; g2=2.019; g3=2.027 Ti4+-O2--Ti4+-O- (Os-) [69, 72] g1=2.002; g2=2.007; g3=2.011 g1=2.003; g2=2.009; g3=2.014 g1=2.003; g2=2.003; g3=2.009 Ti4+-O3- [72] g1=2.003; g2=2.013; g3=2.024 g1=2.007; g2=2.014; g3=2.024 g1=2.002; g2=2.012; g3=2.016 g1=2.004; g2=2.014; g3=2.018 Ti4+-O--Ti4+-OH- (OB-) [72] g1=2.001; g2=2.009; g3=2.021 O2-. (on anatase) [73]
37
EPR Parameters of V4+ sites in TiO2 g⊥=1.981; g∥=1.924 g1=1.906; g2=1.960; g3=1.960 g1=1.917; g2=1.959; g3=1.959 V4+ (in anatase) [63, 67] g1=1.913; g2=1.913; g3=1.956 g1=1.912; g2=1.914; g3=1.956 V4+ (in Rutile) [63, 66] g1=1.923; g2=1.986; g3=1.965 g1=1.923; g2=1.967; g3=1.940
38
4-2 Microstructures
To examine the effect of the thermal-induced migration on the crystalline phase, grain size, specific surface area and bandgap, the samples were analyzed by using XRD and BET. Figure 4-5 to Figure 4-7 shows the XRD patterns of the pure, 1.00 at.% and 0.01 at.% V-doped TiO2 at different calcination temperatures, respectively. The anatase and rutile phase were indentified from the their typical (101) and (110) diffraction peaks at 25.4 and 27.5° 2θ positions, respectively. Table 4-3 lists the crystalline structures, surface areas and bandgaps of the pure and V-doped TiO2 after the calcination at different temperatures. The pure TiO2 contained anatase phase above 200 °C. The phase transformation from anatase to rutile took place at 600 °C. However, the incorporation of V ions into the TiO2 lattice accelerated the phase transformation and resulted in a lower phase transit temperature of 500 °C. The decreased stability of anatase phase was presumably due to the formation of V2O5 on the surface. The differential weight loss curves (shown in Figure 4-8) of the V-doped TiO2 show two peaks at 606 and 830 °C for 1.00 at.% and 0.01 at.% V-doped TiO2, respectively, indicating the formation of V2O5 moiety.[74-76] We further used GIXRD to analyze the surface structures of the doped TiO2 and the results were shown in Figure 4-9 and Figure 4-10. The 1.00 at.% V-doped TiO2 contained a weak V2O5 diffraction at 19.12° 2θ position at 300 °C. This V2O5 diffraction peak became intensive at 600 °C, which is in agreement with the observation in the thermogravimetric analysis data. Amores and Balikdjian provided a model of “sintering-induced phase transition” to describe the thermal behavior that V ions lowered phase transit temperature.[77-79] In their model, surface V species causes inefficient heat dispersion during sintering and promotes nucleation of rutile phase at the surface boundaries. Thermal induced coalescence causes the surface areas of the pure TiO2 decreasing from 131 to 1 m2/g as the temperature increased form 200 to 600 °C. The V-doped TiO2 exhibited similar surface areas (1-124 m2/g for 0.01 at.% V-doped TiO2;
39
2-135 m2/g for 1.00 at.% V-doped TiO2) at the same temperature range. Incorporation of V ions only slightly inhibited the sintering effect because of their low concentrations. The 0.01 at.% V-doped TiO2 didn’t exist any V2O5 diffraction at 19.12° 2θ position. Low concentrations of V ions don’t have enough capacity to lead to the formation V2O5 moiety does not have enough capacity from 200 to 600 °C.
Figure 4-11 schematically illustrates the microstructures of the V-doped TiO2 transformed from low to high calcination temperature. At lower temperatures, V3+/V4+ ions disperses homogenously and interstitially within the TiO2 lattice, while the V5+ ions mainly stay at the surface. Thermal treatment induces the migration of V3+/V4+ ions moving from the inside TiO2 matrix to its surface lattice and transforming to V5+ ions. As the concentration of the accumulated V5+ ions over its solubility in the TiO2 matrix, they segregate from the TiO2 matrix to form V2O5 moiety.
20 30 40 50 60 70 80 0 100 200 300 400 500 600 700
(a)
Anatase Rutile 700 oC 600 oC 500 oC 400 oC 300 oC 200 oCIntensity (A.U.)
2θ
40 20 30 40 50 60 70 80 0 100 200 300 400 500 600 700 800
(b)
Anatase Rutile 700 oC 600 oC 500 oC 400 oC 300 oC 200 oCIntensity (A.U.)
2
θ
Figure 4-6 The XRD patterns of the 0.01 at.% V-doped TiO2 at different calcination temperatures. 20 30 40 50 60 70 80 0 100 200 300 400 500 600
(c)
Anatase Rutile 700 oC 600 oC 500 oC 400 oC 300 oC 200 oCIntensity (A.U.)
2
θ
Figure 4-7 The XRD patterns of the 1.00 at.% V-doped TiO2 at different calcination temperatures.
41
Table 4-3 The crystalline properties, surface areas and bandgaps of the pure TiO2 and V-doped TiO2 calcined at different temperatures.
Samples calcination
temperature Crystal phase D
a (nm) SAb (m2/g) Band gap pure TiO2 200 °C A 2.4 131 3.3 eV 300 °C A 4.6 104 3.3 eV 400 °C A 8.1 68 3.2 eV 500 °C A 23.0 10 3.1 eV 600 °C A/R (26/74) 26.4/30.0 2 3.0 eV 700 °C R 35.4 1 3.0 eV 0.01 at.% V-doped TiO2 200 °C Ad 4.7 124 3.2 eV 300 °C A 4.4 111 3.2 eV 400 °C A 7.4 78 3.1 eV 500 °C A/Re (56/44) 26.9/30.1 14 3.0 eV 600 °C A/R (13/87) 49.2/37.8 2 3.0 eV 700 °C R 45.8 1 3.0 eV 1.00 at.% V-doped TiO2 200 °C A 2.6 135 1.6 eV 300 °C A 3.8 112 1.6 eV 400 °C A 6.8 75 1.6 eV 500 °C A/R (84/16) 19.5/24.7 12 1.6 eV 600 °C A/R (32/68) 26.4/28.9 8 1.6 eV 700 °C R 42.9 2 1.6 eV
42 200 400 600 800 830 oC 606 oC 1.00 %V/Ti 0.01 %V/Ti TiO2
D
iffe
re
n
ti
a
l w
e
ig
h
t l
o
ss (
A
. U
)
Temperature (
oC)
Figure 4-8 The differential weight loss curves of the pure, the 0.01 at.% and 1.00 at.% V-doped TiO2. 20 30 40 50 60 70 80 0 200 400 600 800 1000 V2O5 (19.12o) 600 oC 500 oC 400 oC 300 oC 200 oC In te n sity (A .U .) 2θ
Figure 4-9 The GI-XRD patterns of the 1.00 at.% V-doped TiO2 at different calcination temperatures.
43 20 30 40 50 60 70 80 0 200 400 600 800 1000 1200 1400 600 oC 500 oC 400 oC 300 oC 200 oC Inte n sity ( A .U .) 2θ
Figure 4-10 The GI-XRD patterns of the 0.01 at.% V-doped TiO2 at different calcination temperatures.
Figure 4-11 The microstructures of the V-doped TiO2 transformed from low to high calcination temperatures.
Calcination temperature
V
3+and V
4+ions which were
44
4-3 UV-Visible absorption
To examine the electronic structures of the photocatalysts, the optical properties of the pure and V-doped TiO2 samples were characterized in terms of UV-vis diffuse reflectance spectroscopy (DRS). Figure 4-12 displays the optical absorbance of the pure TiO2 and the 0.01 at.% V-doped TiO2 at different calcination temperatures from wavelength of 900 to 200 nm. The bandgap energy of TiO2 ranged 3.1-3.3 eV (absorption edge at 376-400 nm) below 600 °C, corresponding to the anatase.[17] There were two bands below 405 nm. One broad band was ranged between 300-350 nm and centered at 340 nm which was denoted to lower CB.[80, 81] The other band centered at 233 nm was indicated to upper CB. When the calcination temperature was higher than 600 °C, the bandgap energy of TiO2 shifted to 3.0 eV (413 nm) and lower CB center was ranged between 300-420 nm shifted to 362 nm because of generation of rutile phase decreased the bandgap range.[82] The result can be ascribed to the formation of larger particles size therefore it decrease the quantum size effect.[82, 83] The spectra of the 0.01 at.% V-doped TiO2 shows similar absorption behavior relative to the pure TiO2. The effect of the V ions with trance amounts on the electronic structure of TiO2 sample was little to be detected. Figure 4-13 displays the optical absorbance of the 1.00 at.% V-doped TiO2 at different calcination temperatures. The bandgap energy of the 1.00 at.% V-doped TiO2 extended to 1.6 eV (779 nm). Chang et al.[35] reported that the occupied states of the V3+ and V4+ ions are located at 0.43 eV and 1.0 eV, respectively, below the bottom of the conduction band. Thus, the long wavelength absorption could be resulted from the conduction band →semi-occupied V4+ state transition or the band-tail transition. This phenomenon of narrow bandgap to band-tail transitions result from the presence of amorphous structures in the V-doped TiO2 grain-boundaries.[35] Although some V2O5 crystals were distributed at the TiO2 surface, their contents were too small to be detected by UV-vis spectrum. Chang et al.[35] showed that the occupied states of the V3+ and V4+ ions
45
are located at 0.43 eV and 1.0 eV, respectively, below the bottom of the conduction band. The wavelengths for the V3+/V4+ to conduction band are 1240 to 3100 nm. Therefore, the wavelengths were too long to be measured in this study. Figure 4-14 illustrates the possible electronic structure for the 1.00 at.%V-doped TiO2. Chang at al.[35] indicated that the V3+ and V4+ ions in the TiO2 crystals lead to electron-hole recombination.
46 (a) 200 300 400 500 600 700 800 900 0 4 8 12 16 700oC 600oC 500oC 400oC 300oC 200oC Intensity wavelength(nm) (b) 200 400 600 800 0 7 14 21 28 200oC 300oC 400oC 500oC 600oC 700oC In tensity wavelength(nm)
Figure 4-12 UV-Vis DRS spectra of (a)the pure TiO2 and (b) the 0.01 at.% V-doped TiO2 at different calcination temperatures.
Kubelka-Munk (A.U.)
47 200 300 400 500 600 700 800 900 5 10 15 20 700oC 600oC 500oC 400oC 300oC 200oC Intensity Wavelength(nm) Figure 4-13 UV-Vis DRS spectra of the 1.00 at.% V-doped TiO2.
Figure 4-14 The electronic structure of 1.00 at.% V-doped TiO2. V3+
+
+
+
+
-
-
-
-V4+ VB CB 1 eV 0.43 eV
hν
Kubelka-Munk (A.U.)48
4-4 Photocatalytic activity
The photocatalytic activities of the pure TiO2 and V-doped TiO2 were examined in terms of the degradation of 0.01 mM RhB. Figure 4-15 shows the rate constants of the pure and the V-doped TiO2 samples calcined at different temperatures. At 300-600 °C, the activity of the TiO2 samples increased from 0.0216 to 0.445 with increasing temperatures. Similar trend in the activities was found in the V-doped TiO2-based systems till 500 °C. The 0.01 at.% and 1.00 at.% V-doped TiO2 showed their highest photocatalytic activities of 0.24 and 0.019 1/min, respectively, at 500 °C. The activities of both the doped TiO2 turned down at 600 °C. The temperature dependent activity was mainly governed by crystallinity and phase compositions. Smaller amounts of defects resulted at higher crystallinity led TiO2 performing better photocatalytic efficiency. In addition, anatase and rutile composites promoted the activity because of well charge separations.[17, 20] At 300-500 °C, 0.01 at.% V-doped TiO2 exhibited higher activity than the pure TiO2, indicating that trace amounts of V3+/V4+ ions within the lattice preserve larger numbers of effective charge carriers for photocatalysis. In contrast, the 1.00 at.% V-doped TiO2 performed the lowest activity. The lattice V3+/V4+ ions either trap electrons or holes. The trapped charge carries can not escape from the trapping sites and eventually annihilate inside the TiO2 matrix. Trace amounts of the impurities consume few charge carries from the bands to allow the remaining carriers successfully diffusing to the surface for interfacial transfer. However, over amounts of defects lead to severe electron-hole recombination, thus remarkably inhibiting the photocatalytic efficiency.[35]
For examining the photoreduction activities of the V-doped TiO2 the samples calcined at 400-600 °C were selected because their efficiencies for the photo-oxidation of RhB were higher than the samples calcined at the other temperatures. All these reactions were carried out under the same irradiation condition as that for photocatalytic oxidation of RhB. CH4
49
was the only product which was detectable in this study. Figure 4-16 shows the accumulated amounts of CH4 in the presence of the pure and the 0.01 V-doped TiO2. The pure TiO2 calcined at 500 and 600 °C exhibited similar trend in the CH4 generation. The yield of CH4 rose fast in the first hour and reached almost a steady state till the eight hour. Calcination at 500 °C resulted the pure TiO2 in a higher reductive activity than calcination at 600 °C. The CH4 yield of the TiO2 at 500 and 600 °C at the first hour was 0.66 and 0.54 μmol/g, respectively. The TiO2 calcined at 400 °C performed a relatively low CH4 yield (0.39 μmol/g) at the first hour. However, its CH4 yield continuously increased to 0.66 μmol/g after 2 hours. After that, the yield decreased with the irradiation time and reached 0.58 μmol/g after 8 hr irraditation. Because substantial CO2 and H2O vapor still existed in the photoreductive system, the inhibited generation of CH4 reveals its fast re-oxidation. Compared to the TiO2 calcined at 400 °C, the sample calcined at higher temperatures (500-600 °C) showed higher initial activities for CO2 reduction and retarded re-oxidation.
The photoreductive behavior of the 0.01 at.% V-doped TiO2 samples calcained at 500 °C was similar to that of the pure TiO2 at the same temperature. It produced 0.54 μmol/g of CH4 yield in the first hour and kept a steady accumulated yield in the last 7 hours. The sample calcined at 600 °C resulted in 0.35 μmol/g of CH4 yield in the first hours. The accumulated yield constantly increased with the irradiation time and reached 0.52 μmol/g at the eighth hour. Calcination at 400 °C exhibited the highest accumulated yield (0.57 μmol/g) at the third hour. Afterwards, the yield was maintained till the eight hour.
The yield of CH4 in the pure TiO2 and 0.01 at.% V-doped TiO2 systems either kept similar or decreased after the maximum has reached. However, the 1.00 at.% V-doped TiO2 samples show different phenomenon. The samples calcined at 400-600 °C all continuously increased the CH4 yield with the irradiation time (Figure 4-17). The yields of CH4 reached 0.77, 1.17 and 0.94 μmol/g in the presence of the samples calcined at 400, 500 and 600 °C, respectively.
![Figure 2-2 Schematic photoexcitation in a solid followed by deexcitation events.[17]](https://thumb-ap.123doks.com/thumbv2/9libinfo/8748277.205357/14.892.142.743.457.956/figure-schematic-photoexcitation-solid-followed-deexcitation-events.webp)
![Figure 2-4 Structure of rutile and anatase TiO 2 .[17]](https://thumb-ap.123doks.com/thumbv2/9libinfo/8748277.205357/17.892.111.730.109.842/figure-structure-rutile-anatase-tio.webp)
![Figure 2-6 The structure of vanadium attached to the TiO 2 surface.[39]](https://thumb-ap.123doks.com/thumbv2/9libinfo/8748277.205357/21.892.114.761.118.852/figure-structure-vanadium-attached-tio-surface.webp)
![Figure 2-7 The photochemical mechanism in the present of transition metal ions.[9]](https://thumb-ap.123doks.com/thumbv2/9libinfo/8748277.205357/22.892.106.779.415.920/figure-the-photochemical-mechanism-present-transition-metal-ions.webp)
![Figure 2-8 Band model of Ti 1-x V x O 2 film electrodes at bias potential in an electrolyte solution.[31]](https://thumb-ap.123doks.com/thumbv2/9libinfo/8748277.205357/23.892.121.779.356.822/figure-band-model-film-electrodes-potential-electrolyte-solution.webp)