行政院國家科學委員會專題研究計畫 期末報告
扶壁抑制深開挖引致連續壁位移的機制及分析研究
計 畫 類 別 : 個別型 計 畫 編 號 : NSC 100-2221-E-146-007- 執 行 期 間 : 100 年 08 月 01 日至 101 年 10 月 31 日 執 行 單 位 : 華夏技術學院資產與物業管理系 計 畫 主 持 人 : 謝百? 共 同 主 持 人 : 簡紹琦 計畫參與人員: 碩士班研究生-兼任助理人員:陳欣祥 碩士班研究生-兼任助理人員:隋昌斌 碩士班研究生-兼任助理人員:翁振漢 報 告 附 件 : 出席國際會議研究心得報告及發表論文 公 開 資 訊 : 本計畫可公開查詢中 華 民 國 101 年 12 月 08 日
中 文 摘 要 : 深開挖工程為了避免損及鄰近構造物,在施工前常採用一些 輔助措施,控制開挖引致之地盤位移,以達到鄰房保護的目 的。近年來,扶壁常被用來作為開挖之鄰房保護的輔助措 施;然而有關扶壁分析方法的研究,確相當的缺乏。因此有 關扶壁的分析及設計皆還停留在經驗的階段,有關扶壁分析 方法亟待進一步的研究。 有鑑於此,本研究的重點為設置扶壁之開挖案例的分析與預 測;本研究首先以三向度數值分析,進行設置扶壁之開挖案 例的模擬分析與驗證,建議適合的三向度數值模擬分析的方 法及參數的擇取原則,然後對一正在進行開挖作業的工程進 行預測,以驗證建議的方法及原則。根據分析比較的結果, 本研究的分析方法及參數的擇取原則,對壁體側向位移及地 表沉陷可提供合理的分析與預測;設置扶壁後,壁體最大側 向位移量約可減少 1/3~2/3;扶壁和土壤間之界面摩擦力會 影響壁體側向位移及地表沉陷,分析結果顯示,扶壁和土壤 間之界面摩擦力應較接近於現地土壤的剪力強度。 中文關鍵詞: 深開挖、扶壁、數值分析、壁體側向位移
英 文 摘 要 : In order to avoid the adjacent constructions from being damaged in deep excavation project, a certain auxiliary measurement is usually adopted in
restraining the ground movements due to excavation so as to protect the adjacent buildings. In recent
years, buttress wall has been adopted as an auxiliary measurement in protecting the adjacent buildings in excavation; however, it is still in lack of
regarding the study of analysis methodology of the buttress wall. Thus, concerning the analysis and designing of buttress wall is still staying in the empirical stage. Therefore, the further study of analysis methodology of buttress wall is required. For this reason, the study will focus on the analysis and prediction of excavation with buttress walls. This study first performs the simulation and analysis for an excavation case with buttress walls using three-dimensional numerical analysis. Based on the analytic experience, the reasonable methodologies of three-dimensional numerical analysis in simulation and decision principle of parameters are recommended. Then, a construction project who is excavating now is predicting to verify the methodologies and principle.
The comparison results show that using the
methodologies and principle in three-dimensional numerical analysis for analyzing excavation with buttress wall can get a well prediction for lateral wall deflections and ground settlements induced by excavation; the maximum lateral wall deflection can be reduced 1/3~2/3 by installing buttress walls; the lateral wall deflection will be affected by the
interface frictions between buttress and soil. 英文關鍵詞: deep excavation; buttress wall; three-dimensional
行政院國家科學委員會補助專題研究計畫
■ 成 果 報 告
□期中進度報告
扶壁抑制深開挖引致連續壁位移的機制及分析研究
計畫類別:■個別型計畫 □整合型計畫
計畫編號:NSC 100-2221-E-146-007-
執行期間:100 年 08 月 01 日至 101 年 10 月 31 日
執行機構及系所:華夏技術學院資產與物業管理系/所
計畫主持人:謝百鈎
共同主持人:簡紹琦
計畫參與人員:
陳欣祥、隋昌斌、翁振漢(Chandra Suciadi)
成果報告類型(依經費核定清單規定繳交):■精簡報告 □完整報告
本計畫除繳交成果報告外,另須繳交以下出國心得報告:
□赴國外出差或研習心得報告
□赴大陸地區出差或研習心得報告
■出席國際學術會議心得報告
□國際合作研究計畫國外研究報告
處理方式:
除列管計畫及下列情形者外,得立即公開查詢
□涉及專利或其他智慧財產權,□一年□二年後可公開查詢
中 華 民 國 101 年 12 月 01 日
扶壁抑制深開挖引致連續壁位移的機制及分析研究
The study of mechanism and analysis of buttress wall in restraining
diaphragm wall displacement caused by deep excavation
謝百鈎
華夏技術學院資產與物業管理系/所 Pio-Go Hsieh
Department/Graduate institute of Assets and Property Management, Hwa Hsia Institute of Technology 中文摘要 深開挖工程為了避免損及鄰近構造物,在施工前常採用一些輔助措施,控制開挖引致之地盤位移, 以達到鄰房保護的目的。近年來,扶壁常被用來作為開挖之鄰房保護的輔助措施;然而有關扶壁分析 方法的研究,確相當的缺乏。因此有關扶壁的分析及設計皆還停留在經驗的階段,有關扶壁分析方法 亟待進一步的研究。 有鑑於此,本研究的重點為設置扶壁之開挖案例的分析與預測;本研究首先以三向度數值分析, 進行設置扶壁之開挖案例的模擬分析與驗證,建議適合的三向度數值模擬分析的方法及參數的擇取原 則,然後對一正在進行開挖作業的工程進行預測,以驗證建議的方法及原則。根據分析比較的結果, 本研究的分析方法及參數的擇取原則,對壁體側向位移及地表沉陷可提供合理的分析與預測;設置扶 壁後,壁體最大側向位移量約可減少1/3~2/3;扶壁和土壤間之界面摩擦力會影響壁體側向位移及地表 沉陷,分析結果顯示,扶壁和土壤間之界面摩擦力應較接近於現地土壤的剪力強度。 關鍵詞:深開挖、扶壁、數值分析、壁體側向位移。 ABSTRACT
In order to avoid the adjacent constructions from being damaged in deep excavation project, a certain auxiliary measurement is usually adopted in restraining the ground movements due to excavation so as to protect the adjacent buildings. In recent years, buttress wall has been adopted as an auxiliary measurement in protecting the adjacent buildings in excavation; however, it is still in lack of regarding the study of analysis methodology of the buttress wall. Thus, concerning the analysis and designing of buttress wall is still staying in the empirical stage. Therefore, the further study of analysis methodology of buttress wall is required.
For this reason, the study will focus on the analysis and prediction of excavation with buttress walls. This study first performs the simulation and analysis for an excavation case with buttress walls using three-dimensional numerical analysis. Based on the analytic experience, the reasonable methodologies of three-dimensional numerical analysis in simulation and decision principle of parameters are recommended. Then, a construction project who is excavating now is predicting to verify the methodologies and principle. The comparison results show that using the methodologies and principle in three-dimensional numerical analysis for analyzing excavation with buttress wall can get a well prediction for lateral wall deflections and ground settlements induced by excavation; the maximum lateral wall deflection can be reduced 1/3~2/3 by installing buttress walls; the lateral wall deflection will be affected by the interface frictions between buttress and soil.
Keywords: deep excavation; buttress wall; three-dimensional numerical analysis; lateral wall deflection.
一、前言 進行開挖工程時,開挖區周圍某一範圍內的地盤,會因開挖的解壓力而產生位移,若位移量太大 時,在該範圍內的構造物將會因此而受損;為了避免因開挖而損及鄰近構造物,在設計深開挖工程時, 皆應考量到鄰房安全的問題,甚至採取必要的鄰房保護措施。 一般鄰房保護的方式可分為兩大類,一類為直接在鄰房基礎下方施作補強,以期當開挖引致地盤 沉陷時,可以保護鄰房構造物,避免其受損壞,然而當開挖的周圍有大量的鄰房時,這種方法可能無 法符合經濟上的考量,而且與鄰房的溝通協調也較為不易。因此在實務上大多採用另一種方式,即於
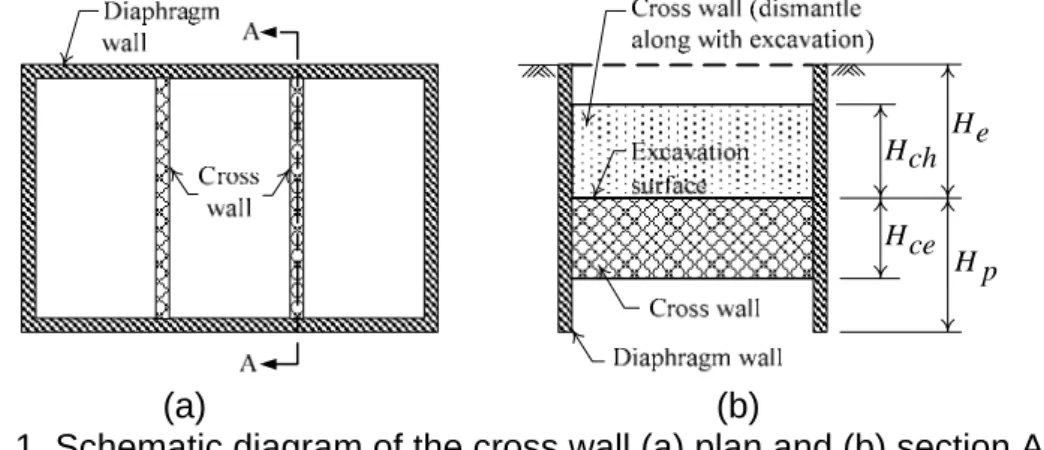
開挖區內設置輔助設施,以期減少開挖引致之地盤位移,進而達到鄰房保護的目的,例如地盤改良工 法、擋土及支撐結構增強工法及開挖區內設置地中壁,即是實務上常採用的方法。 扶壁是另一種設置於開挖區的鄰房保護輔助設施,在台灣的深開挖工程上亦常採用。扶壁的構築 方式,乃是於開挖之前使用相同於地下連續壁的施工方式,施作一道有限長度的混凝土壁體,扶壁的 一端與開挖擋土連續壁銜接,另一端為自由端,並不連接至連續壁,如圖1 所示。 扶壁抑制連續壁側向位移的基本構想,係希望藉由扶壁與連續壁連接,形成類似於鋼筋混凝土中 的 T 型梁,增加整體擋土系統的撓曲勁度。除此之外,由於扶壁僅一端連接連續壁,當連續壁產生位 移時,會推著扶壁往前移動,因此可藉著扶壁與土壤間之摩擦抵抗,增加側向的抵抗力,如圖2 所示, 以減少連續壁之側向位移,進而可減少開挖區外側之地盤沉陷,降低開挖工程對鄰房的影響,達到鄰 房保護的功用。 根據台北盆地一些設置扶壁之深開挖案例的現地監測資料顯示,扶壁對連續壁之變位可提供抑制 的效果;圖3 為台北盆地兩個設置扶壁之開挖案例[1,2],最後開挖階段之連續壁最大側向位移量(hm), 與其他無設置任何鄰房保護設施之經驗結果[3]的比較,圖中顯示,其中一個案例[1]由於地層全部為軟 弱的黏土層,因此在無設置扶壁之一側的hm,已達台北盆地的經驗上限值,在設置扶壁的一側,監測 所得扶壁旁的hm較無設置扶壁的一側減少許多,因此扶壁似乎提供了減少連續壁側向位移的效果。另 外一個案例[2],設置扶壁後之hm,落於台北盆地的經驗下限值;圖 4 為該案例假設不設置扶壁時, 考慮連續壁角隅效應[4]影響之連續壁hm預測值,和設置扶壁後之監測值的比較,設置扶壁後之hm較 不設置扶壁時小,因此扶壁似乎也提供了減少連續壁側向位移的效果。 雖然如此,目前有關扶壁機制、行為特性及分析、設計的研究,卻是相當的缺乏,扶壁實際的機 制及行為,是否能如基本構想一般,仍具有相當的爭議。因此有關扶壁的分析及設計,皆尚停留在經 驗的階段,尚無適當而嚴謹的分析模式可供使用,故亟待進一步的研究,以提供設置扶壁之分析及設 計使用。 圖1 扶壁示意圖 (a)平面圖 (b)A-A剖面圖 圖2 扶壁的支承與摩摖抵抗
0 10 20 30 40 H (m) 0.00 0.04 0.08 0.12 0.16 0.20 無鄰房輔助設施[3] 無扶壁[1] ) (m hm 有扶壁[1] H hm 005 .0 H hm 002 . 0 有扶壁[2] 圖3 開挖案例設置和無設置扶壁之壁體最大側向位移量與經驗值比較 ) (cm hm
圖4 開挖案例設置扶壁和不設置扶壁之成效比較 欲探討扶壁之機制及行為,首先必須能合理且有效的模擬分析設置扶壁之開挖;有關開挖工程設 置扶壁後之連續壁位移,根據歐章煜和王怡文[5]的研究,其係屬三向度行為,所以要分析設置扶壁後 之連續壁位移、或有關扶壁配置之設計,應採用三向度數值分析程度進行;有鑑於此,本研究在這年 度的重點工作即為扶壁之案例的分析與研究;本研究首先收集採用扶壁之深開挖案例,包括開挖幾何 條件、地質條件、扶壁幾何條件及監測資料等,然後對該開挖案例進行三向度數值分析研究,以研究 設置扶壁之開挖工程的適當的模擬分析方法,並將分析結果與監測結果進行比較,驗證模擬分析方法, 並建立相關參數的擇取原則;然後對一設置扶壁並正在進行開挖的工程,在其開挖之前,先行以三向 度數值分析程式進行連續壁側向位移的預測,再配合工程開挖的進行,逐階的與現地各階開挖後之壁 體側向位移監測結果進行比較,以進行該開挖工程的回饋分析,據以驗證設置扶壁之開挖的連續壁側 向位移分析模式及參數擇原則,提供工程分析設計使用。 二、三向度數值分析之模擬 本研究採用三向度有限元素法程式 PLAXIS 3D[6]作為數值分析的工具。分析時,結構材料,包 括連續壁、地中壁、扶壁及逆打工法之樓板支撐等構材所用的混凝土,以及臨時鋼支撐之鋼構 材,採用線彈性模式模擬;土壤的應力─應變模式採用 HS (Harding soil)模式[7]。 2.1 結構材料模擬與參數決定 本研究結構材料採用線彈性模式;其中連續壁、地中壁、扶壁及樓板支撐採用板元素模擬,所需 輸入的參數包括構材之密度()、彈性模數(E)、柏松比()及厚度(t);臨時鋼支撐採樑元素模擬,所需輸入的參數包括構材之 E、、面積(A)、y 軸慣性矩(Iy)、z 軸慣性矩(Iz)。
進行數值分析時,結構參數中之、t、A、Iy、及 Iz 皆採用實際設計值,混凝土及鋼材之分別取
0.2 及 0.3;鋼構材之標稱彈性模數(Est)採用 2.0×10⁵MPa;混凝土標稱彈性模數(Ec, MPa)採用 ACI(ACI 318-95)[8]的建議,以下式估計: Ec 4700 fc' (1) 其中 fc為混凝土抗壓強度(MPa)。 數值分析時採用的彈性模數,因為考慮現場建造施工的影響,需給予適度的折減;混凝土彈性模 數折減為80%,即折減係數(R)為 0.8;鋼支撐勁度採用 R 等於 0.5 進行折減。 2.2 土壤參數之決定 本研究以PLAXIS 3D 進行分析時,土壤的應力─應變模式採用較高階的 HS 模式。 HS 模式所需輸入的參數中,單位重(t)、凝聚力(c’)、摩擦角(’) 等,皆由試驗獲得;膨脹角( ) 假設為 0、柏松比( )取 0.2;K0以Jaky[9]及 Ladd 等人[10]的建議的方法計算;除此之外,HS 模式尚 須輸入表示和主軸差載重引起之塑性應變有關的參數 ref E50 、和主壓縮引起之塑性應變有關的參數 ref oed E 、 和彈性解壓─再壓有關的參數 ref ur E 及ur,以及勁度和應力關係之冪次方m。 由於 ref E50 、 ref oed E 、 ref ur E 、m 並不易得到,一般傳統的試驗報告並無提供這參數,因此目前的分析都 是根據經驗公式決定,對於砂土層HS 模式之勁度,Khoiri 和 Ou[11]已有進行相關的研究並建議擇的原 則,因此本研究砂土層HS 模式之勁度,採用 Khoiri 和 Ou[11]的建議: m ref ref p E E E3 503 50 (3/ ) (2) 其中 E 以 2000N (kN/m2)估計[12],然後取 ref ref ur E E 3 50 、 ref ref oed E E 50 、m=05。 然而對於粘土層m 取經驗值 1.0;然而對於 ref E50 、 ref oed E 、 ref ur E ,目前的一些經驗公式,所提供的數 據並不一致,以致使用上有許多的困擾。因此本研究整理二種粘土層 ref E50 、 ref oed E 、 ref ur E 的決定方法,此 外,再另行推導一種決定方法,共三種決定方法,用以進行參數的決定,並利用於三向度的數值分析 中,以確定合理且適合的土壤參數擇取原則。三種 ref E50 、 ref oed E 、 ref ur E 的決定方法如下: 1.方法 I 根據理論關係,可推導得到 ref ur E 和彈性膨脹線的斜率()之關係: ) 2 1 ( ) 1 ( 3 0 ur ref ref ur p e E (3) 3 3 2 1 ref ref ref ref p (4)
然後再根據Calvello and Finno[13]的經驗公式,決定 ref ur ref E E50 1/3 及 ref ref oed E E 0.7 50 。 2.方法 II 根據PLAXIS 3D[6]使用手冊的建議, ref oed E 及Eurref可分別利用oedometer 試驗之壓縮指數(C )及回脹c 指數(C )決定如下: s c ref ref oed C p e E 2.3(1 0) (5) ) 1 ( ) 1 )( 2 1 ( ) 1 ( 3 . 2 0 ur s ur ur ref ref ur C p e E (6) 然後計算 ref oed ref E E50 1.25 3.方法 III 前面兩個方法中,方法I 是根據三軸試驗的結果,方法 II 則是利用 oedometer 試驗的結果;因此 利用 oedometer 試驗結果推導三軸試驗的 ref ur E 時,根據 oedometer 試驗的條件,公式(6)中之 ref p 應以 ref 1 取代:
) 1 ( ) 1 )( 2 1 ( ) 1 ( 3 . 2 0 1 ur s ur ur ref ref ur C e E (7) ref oed E 和 ref E50 的決定仍和方法II 相同。 根據oedometer 試驗的條件可推得 ref 1 和 ref p 之關係: ref ref p ) 1 1 ( 3 1 (8) 實際以 PLAXIS 3D 分析時,一般假設pref 100kPa;粘土層之 約為 0.2,因此分析時,可假設
kPa ref 200 1 。 三、設置扶壁之案例三向度數值分析之模擬和驗證 為了確認設置扶壁之開挖工程三向度數值分析的適當的模擬分析方法,本研究利用一設置扶壁作 為鄰房保護輔助設施,且施工及監測品質皆相當良好之開挖案例─UPIB[2]進行三向度數值模擬分析, 並將分析結果和監測結果進行比較,以驗證分析參數適用性與分析方法的合理性。 3.1 工程概況 UPIB 為一地下 7 層、地上 30 層之鋼構造建築物,基地開挖長寬分別約為 121.8m 及 66.1m, 基地平面如圖 5 所示[2],基地四周為道路或空地。擋土壁採用厚 1.5m 之連續壁,平均深度約 57.5m,並貫入礫石層約 6m 深,設計之混凝土 fc為 27.5MPa;最後開挖深度為 32.5m,採逆打 工法,分 9 階開挖,其中在第 1、2 階開挖後,分別採用版厚 25cm 及 20cm 之 1FL 及 B1FL 樑 板系統做為支撐系統,第 3~7 階開挖後,分別採用 61cm 厚之 B2FL~B6FL 無樑板系統做為支 撐系統(fc為 27.5MPa),第 8 階開挖後,主要採用 3-H400×400×13×21mm 做為臨時斜撐,間距 約 6.4m,斜率約為 4.6:6,之後再進行第 9 階開挖;圖 6 表示開挖階段及樓板與鋼支撐位置。 UPIB 座落於台北盆地地質分區之 K1 區[14]。岩盤約位於深度 66.7m 處,土層依其性質約 可區分為四層,各層之土壤主要性質如圖 6 所示。地下水位約位於地表下 3m,大致呈靜水壓 分佈,礫石層之深層地下水壓的水位面則約位於地表下 10m。 為減少因為開挖所引致之壁體側向位移及地表沉陷,本工程除於開挖基地之南北走向設置 3 道厚度 1.0m、深度 45m、間距 26m 之地中壁外,於四周連續壁角隅間或與地中壁之間隔跨距 較大處,分別設立 10 道厚度 1.0m、深度 55m 之扶壁,其中東、西兩側分別設立長度(b)12m 及 15m 之扶壁 3 道,南、北兩側分別設立 b 為 6m 之扶壁 3 道及 1 道,如圖 5 所示。地中壁及扶 壁在深度(D)1.5m 以上回填現地土壤,D 等於 1.5m~22m 及 22m 以下分別澆置強度 13.7MPa 及 24.0MPa 之混凝土,並隨著開挖的進行逐階敲除。 圖5 UPIB開挖基地平面圖及監測儀器配置
本工程設置 12 支傾斜管(SO-1,SI-2~SI-12),其管底均穿過礫石層且進入岩盤約 5m,以確 保底部處於没有側向位移的狀態,並於基地周圍佈設沈陷釘 168 根。由於基地西側係單純的設 置扶壁,且基地形狀較規則,因此將做為本研究模擬分析及比較的對象;圖 5 中表現本研究主 要比較的兩個監測斷面:SI-9-SEC9 斷面及 SI-10-SEC10 斷面。 3.2 數值分析之網格 本研究主要模擬分析及比較的對象係西側之扶壁連續壁系統;進行三向度數值分析時,取 1/4 區塊對稱分析,如圖 5 所示的「分析區塊」。分析之網格如圖 7 所示;網格邊界條件的設定 為底面邊界採用鉸支承,四周邊界採用滾支承。 3.3 材料的模擬 本研究分析時,土壤的應力─應變模式採用 HS (Harding soil)模式[7];結構材料採用線彈性模式模 擬。表1 列出連續壁、地中壁、扶壁等結構之資料及參數、表 2 列出樓板及鋼支撐之資料及參數。 t t t t c C s C c C Cs 圖6 UPIB開挖階段及土層分佈圖 圖7 UPIB分析用網格
表1 UPIB 之連續壁、地中壁、扶壁之資料及參數 結構 D(m) t(m) (t/m3) E(MPa) 連續壁 0~57.5 1.5 2.4 19718 0.2 1.5~22 1.0 2.4 13917 0.2 地中壁 22~45 1.0 2.4 18420 0.2 1.5~22 1.0 2.4 13917 0.2 扶壁 22~55 1.0 2.4 18420 0.2 表2 UPIB 之樓板及鋼支撐之資料及參數 階段 He(m) Hs(m) E(MPa) t(m) s(m) A(m2) Iy(10-4m4) Iz(10-4m4) 1 3.5 0* 19718 0.2 0.25 - - - - 2 6.35 4.4* 19718 0.2 0.20 - - - - 3 10.45 9.0* 19718 0.2 0.61 - - - - 4 14.8 13.4* 19718 0.2 0.61 - - - - 5 18.15 16.8* 19718 0.2 0.61 - - - - 6 21.5 20.2* 19718 0.2 0.61 - - - - 7 26.05 24.8* 19718 0.2 0.61 - - - - 8 29.4 29.0+ 100000 0.3 6.4 0.066 19.99 6.72 9 32.5 *樓板支撐; +3-H400×400×13×21 臨時鋼斜撐,斜率約為 4.6:6
表3 方法 I~方法 III 所決定之 UPIB 土層參數值
方法I (kPa) 方法II (kPa) 方法III (kPa) 土壤 種類 深度 (m) 參數 m ref ur
E E50ref Eoedref Eurref E50ref Eoedref Eurref E50ref Eoedref
Fill 0-3 1.0 20416 6805 4764 10154 1341 1073 20308 2681 2145 CL 3-6.8 1.0 23171 7724 5407 11572 1588 1271 23144 3176 2541 6.8-10.2 1.0 22576 7525 5268 11300 1582 1266 22599 3164 2531 10.2-14 1.0 21910 7303 5112 10989 1566 1253 21978 3133 2506 14-18.8 1.0 21070 7023 4916 10590 1538 1230 21181 3076 2461 18.8-21.2 1.0 20650 6883 4818 10389 1522 1217 20779 3043 2435 21.2-24.5 1.0 20072 6691 4684 10112 1497 1198 20224 2994 2395 24.5-28.2 1.0 19425 6475 4532 9799 1468 1174 19598 2935 2348 28.2-32.6 1.0 18654 6218 4353 9426 1430 1144 18851 2861 2289 CL 32.6-37.1 1.0 25241 8414 5890 12730 1903 1522 25461 3806 3045 37.1-41.5 1.0 24250 8083 5658 12245 1848 1478 24489 3696 2957 41.5-47.1 1.0 22988 7663 5364 11625 1776 1421 23250 3552 2841 47.1-51 1.0 22109 7370 5159 11193 1725 1380 22385 3449 2760 SW/GW 51-66.7 0.5 118793 39598 39598 118793 39598 39598 118793 39598 39598 3.4 分析結果探討 3.4.1 土壤參數的影響及決定 如圖6 所示,UPIB 的土層除在 Gl.-51m~-66.7m 為級配良好之砂土/礫石層外,在 GL. -51m 以上都 為粘土層,開挖行為主要受此粘土層的影響;本研究分析時,土壤的應力─應變模式採用 HS 模式,表 3 分別列出以 2.2 節所述之三種方法所得土壤之 ref E50、 ref oed E 及 ref ur E ,可發現方法 II 計算所得土壤之Eurref 約 僅是方法I 之一半;而方法 III 計算之土壤 ref ur E 和方法I 的結果是相同的。 圖8 為利用方法 I 和方法 II 計算 HS 模式的土壤勁度,分析所得扶壁側(西側)壁體側向位移和地表 沉陷與監測結果之比較;圖9 為利用方法 I 和方法 III 之土壤參數,分析所得與監測結果之比較。圖 8 和圖9 中同時也表示了 UPIB 若不設置扶壁時,壁體側向位移和地表沉陷的分析結果。 圖8 顯示不論是 SI-9-SEC9 斷面或是 SI-10-SEC10 斷面,方法 I 的分析之壁體側向位移和地表沉陷
都和監測值都相當接近,然而方法 II 的結果則明顯大於方法 I 及監測值,因此方法 I 應是一個較合適 的參數決定方法。圖8 同時也顯示,在 SI-9-SEC9 斷面及 SI-10-SEC10 斷面處,方法 I 及監測值皆明顯 的小於無設置地中壁的分析結果,壁體最大側向位移量和地表最大沉陷量皆約減少了 2/3。因此 UPIB 設置扶壁可達到減小地盤位移的功效。 250 200 150 100 50 0 Wall deflection (mm) 60 50 40 30 20 10 0 0 10 20 30 40 50 60 70 80 90 100 110 120 130 Distance from wall (m)
-12 -8 -4 0 32.5m SEC9 SI‐9 (a) SI-9-SEC9 斷面 250 200 150 100 50 0 Wall deflection (mm) 60 50 40 30 20 10 0 Depth (m ) 0 10 20 30 40 50 60 70 80 90 100 110 120 130 Distance from wall (m)
-12 -8 -4 0 S e ttlement ( m m) 32.5m SEC10 SI‐10 (b) SI-10-SEC10 斷面 圖8 方法 I 和方法 II 所得最後開挖階段之分析和與監測位移量比較 (a) SI-9-SEC9 斷面 (b) SI-10-SEC10 斷面 圖9 方法 I 和方法 III 所得最後開挖階段之分析和與監測位移量比較
另一方面,圖9 中顯示,方法 III 及方法 I 的分析結果與監測值相當接近,明顯的較方法 II 好。因
此以方法III 計算 HS 模式之土壤勁度也可得到好的壁體側向位移和地表沉陷分析結果。除此之外,方
法I 計算之 ref
E50 、Eoedref 約為方法III 的 2 倍,但兩種方法的分析的結果差異卻不太,因為對開挖工程而
言,主要影響壁體側向位移和地表沉陷之分析結果的是 ref ur E ,而 ref E50 及 ref oed E 對分析結果影響不大。 因此要合理的分析開挖工程,有效的決定 ref ur E 是主要的重點,而方法I 及方法 III 都是合理而可行 的方法。 3.4.2 界面元素的影響及決定 扶壁可能的機制之一,是當連續壁產生位移時,會推著扶壁往前移動,藉著扶壁與土壤間之摩擦 抵抗,增加側向的抵抗力,如圖 2 所示,藉以減少連續壁之側向位移及開挖區外側之地表沉陷。因此 合理的扶壁和土壤之界面行為的模擬是必須的。 在數值分析時,有關結構體和土壤之界面的行為,一般是以界面元素模擬,並將結構體和土壤界 面間的摩擦力乘上一折減係數(R),以模擬兩者間之摩擦抵抗。 本研究為了探討結構體和土壤界面間之摩擦力,對壁體側向位移及地表沉陷的影響,以 2.2 節所 述之方法 I 計算 HS 模式之土壤勁度,然後對連續壁、地中壁及扶壁與土壤間之界面元素,分別取 R 等於1.0、0.75 及 0.5 進行分析,以探討 R 的影響及合理的數值。 圖10 為 UPIB 之 SI-9-SEC9 斷面,在 R 分別等於 1.0、0.75 及 0.5 時,分析所得之壁體側向位移及 地表沉陷。圖中顯示 R=0.5 的位移量明顯較 R=1.0 及 0.75 的結果大,這是因為 R=0.5 時,代表扶壁和 土壤界面間有較小的摩擦阻抗,所以產生較大的側向位移。而根據圖10 的比較結果,R=1.0 的分析結 果較符合現地監測結果,因此扶壁和土壤間之界面摩擦力應較接近於現地土壤的剪力強度,採 R=1.0 進行分析,應是較為合理且可行的。 圖10 不同界面元素折減係數所得分析和與監測位移量比較 四、設置扶壁之開挖工程的分析預測與驗證 本研究和設計、施工及監測水準皆極優良的顧問公司、施工廠商合作,針對一個平面形狀規則、 現在正要進行開挖作業之開挖工程(簡稱驗證工程),配合本研究的需要,單純採用扶壁作為鄰房保護輔 助措施,並在適當之位置設置監測儀器,以期掌握及取得品質可靠、良好、並可應用於分析研究之監 測結果。然後利用前節之扶壁三向度數值分析的方法,先行進行分析預測,再與實際開挖後之監測結 果進行比較,以驗證設置扶壁之開挖工程的模擬分析方法,以及相關參數的擇取原則。 4.1 驗證工程之工程概況 驗證工程基地開挖長寬分別約 65m 及 44m,基地平面如圖 11 所示。擋土壁採厚 1.3m 之連 續壁,平均深度約 43.5m,設計之混凝土 fc為 27.5MPa;最後開挖深度為 26.45m,採逆打工法, 分 8 階開挖,其中在第 1、2 階開挖後,分別採用 25cm 厚樓版做為支撐系統,第 3~7 階開挖後, 分別採用 40cm 厚樓板做為支撐系統(fc為 27.5MPa);圖 12 表示開挖階段及樓板與鋼支撐位置。
圖11 驗證工程開挖基地平面圖及監測儀器配置 圖12 驗證工程開挖階段及土層分佈圖 驗證工程地層在 GL.-39.6m~-54.9m 處為級配良好礫石,其上為砂粘土互層,依性質約可區 分為 6 層,各層土壤之主要性質如圖 12 所示。地下水位約位於 GL.-5.7m,大致呈靜水壓分佈。 由於基地鄰近周圍有許多建築物,為減少因為開挖所引致之壁體側向位移及地表沉陷,本工 程於開挖基地四周共設置之 13 道深度 35m 之扶壁,其中 11 道之長度為 5m、厚度為 0.6m,另
2 道長度為 7m、厚度為 0.8m,如圖 11 所示。扶壁在深度 GL.-20.2mm 以上及以下分別澆置 fc 為 13.7MPa 及 27.5MPa 之混凝土,並隨著開挖的進行逐階敲除。 驗證工程設置 7 支傾斜管(SI1~SI7),其管底均穿過礫石層,且進入岩盤約 4.5m,以確保底 部處於没有側向位移的狀態,配置位置如圖 11 所示。 3.2 網格及材料參數 驗證工程進行三向度數值分析時,取 1/4 區塊對稱分析,如圖 11 所示的「分析區塊」。分析 之網格如圖 13 所示;網格邊界條件的設定為底面邊界採用鉸支承,四周邊界採用滾支承。 分析時,土壤、結構材料的應力─應變模式及模擬之元素皆和 UPIB 相同;對砂土層 HS 模式之勁 度採用Khoiri 和 Ou[11]的建議估計;粘土層 HS 模式之勁度的擇取方法同 UPIB 之方法 I。表 4 列出分
析時之土壤參數、表5 及表 6 列出分析時之結構資料及參數。 31.9 m 4He=105.8 m 21.5 m 105. 8 m 54.9 m 圖13 驗證工程分析用網格 表4 驗證工程土層參數值 土壤 種類 深度 (m) ref p (kPa) m ref ur E (kPa) ref E50 (kPa) ref oed E (kPa) Fill/CL 0-2.0 0.2 100 1.0 27241 9080 6356 Fill/CL 2.0-5.0 0.2 100 1.0 29314 9771 6840 SM 5.0-8.0 0.2 100 0.5 7343 2448 2448 SM 8.0-10.0 0.2 100 0.5 18308 6103 6103 SM 10.0-13.0 0.2 100 0.5 31485 10495 10495 SM 13.0-15.9 0.2 100 0.5 17589 5863 5863 CL/ML 15.9-17.7 0.2 100 1.0 29974 9991 6994 CL/ML 17.7-19.5 0.2 100 1.0 28699 9566 6696 SM 19.5-22.5 0.2 100 0.5 32801 10934 10934 SM 22.5-25.0 0.2 100 0.5 33174 11058 11058 SM 25.0-27.7 0.2 100 0.5 28689 9563 9563 CL/ML 27.7-30 0.2 100 1.0 32983 10994 7696 CL/ML 30.0-33.0 0.2 100 1.0 38296 12765 8936 CL/ML 33.0-36.8 0.2 100 1.0 33558 11186 7830 SM 36.8-39.6 0.2 100 0.5 31641 10547 10547 GM 39.6-54.9 0.2 100 0.5 118793 39598 39598
表5 驗證工程之連續壁和扶壁資料及參數 結構 D(m) t(m) (t/m3) E(MPa) 連續壁 0~43.5 1.3 2.4 19718 0.2 0~20.2 0.6 2.4 15573 0.2 扶壁 20.2~35 0.6 2.4 19718 0.2 表6 驗證工程之樓板資料及參數 階段 He(m) Hs(m) E(MPa) t(m) 1 2.5 0.2 19718 0.2 0.25 2 5.45 3.35 19718 0.2 0.25 3 8.55 6.55 19718 0.2 0.4 4 11.35 9.75 19718 0.2 0.4 5 14.3 12.7 19718 0.2 0.4 6 17.25 15.65 19718 0.2 0.4 7 20.2 18.6 19718 0.2 0.4 8 26.45 3.3 分析結果探討 圖14 為驗證工程設置扶壁後,在 SI5、SI6 及 SI7 三個傾斜管位置處之壁體側向位移的預測結果, 圖中同時表示了該工程若不設置扶壁,壁體側向位移的預測結果,顯示設置扶壁後,預測的壁體最大 側向位移量約可減少1/3;設置扶壁後,預測的最大的側向位移量可控制在 50mm 以內,對開挖深度達 26.45m 的深開挖工程而言,壁體最大側向位移量和開挖深度的比值約為 0.19%。根據 Ou et al.[3]的研 究,一般深開挖工程之壁體最大側向位移量和開挖深度的比值,約為 0.2%~0.5%之間,如圖 3 所示, 因此驗證工程設置扶壁後之位移量,落於一般深開挖工程之經驗值的下限之下。 驗證工程目前已完成第二階段的開挖作業,第一及第二階段開挖結束後,傾斜管 SI5、SI6 及 SI7 之實際監測結果如圖 15 所示;圖 15 同時表示了先前預測之第一及第二階段開挖後的壁體側向位移, 經監測值回饋比較的結果顯示,預測的結果和監測值大致符合,因此預測結果應是合理可行的,可繼 續將預測值和後續階段開挖後之監測值進行回饋比較。
Depth (m) Depth (m) Depth (m)
Depth (m) Depth (m) Depth (m)
(a) 第一階段
Depth (m) Depth (m) Depth (m)
(b) 第二階段 圖15 驗證工程預測之壁體側向位移與開挖後之監測結果比較 四、結論 本研究利用三向度數值分析,對設置扶壁之開挖案例及正在進行開挖之驗證工程,進行分析與比 較。綜合研究的結果,本研究有以下的結論: 1.經由實際設置扶壁之案例的分析與比較,粘土層 HS 模式之勁度 ref ur E ,採用和彈性膨脹線斜率的關係 計算,可得到較好的壁體側向位移及地表沉陷分析結果;若採用 ref ur E 和壓縮指數的關係計算,則以 ref 1
取代PLAXIS 手冊建議之關係式中的 ref p ,分析結果和監測結果才較為接近,否則可能會高估位移 量。 2.採用 HS 模式要合理的分析開挖之壁體側向位移和地表沉陷,合理且有效的決定 ref ur E 是主要的重點, 至於 ref E50 及 ref oed E 對分析結果影響不大。 3.根據設置扶壁之案例的分析結果,扶壁和土壤間之界面摩擦力,會影響開挖之壁體側向位移及地表 沉陷,界面摩擦力愈小,位移量愈大;分析結果顯示,扶壁和土壤間之界面摩擦力應較接近於現地 土壤的剪力強度,採 R 等於 1.0 進行分析,應較為合理且可行的。 4.根據案例的壁體側向位移監測與經驗值的比較,扶壁對連續壁之變位可提供抑制的效果,設置扶壁 後之位移明顯的較沒設置扶壁的位移量小;實際案例數值分析的結果也顯示,設置扶壁後之壁體最 大側向位移量及地表最大沉陷量皆減少了約1/3~2/3。 5.本研究建議了設置扶壁之開挖工程,三向度數值分析時之擋土結構系統的模擬、土壤參數的擇取原 則。依照這個模擬分析方法及原則,針對一設置扶壁且正在進行開挖作業的開挖工程,先行進行分 析,預測其壁體側向位移,經與實際開挖後之壁體側向位移比較,預測值和監值結果大致符合,因 此本研究建議的三向度分析模式,以及參數擇取原則,應可合理的用於設置扶壁之開挖工程的分析 預測,可提供工程分析設計使用。 五、計畫成果自評 本研究規劃為三年期研究計畫,本報告是第一年期的研究成果研究。本年度的主要研究工作,係 進行案例分析研究,以建立設置扶壁之深開挖工程,合理及有效的三向度數值分析模擬分析方法,以 及參數擇取原則,計畫皆按原規劃進行。 研究結果顯示,本研究的模擬分析方法及參數擇取原則,可有效的分析設置扶壁之開挖引致之壁 體側向位移和地表沉陷;開挖前的預測工作,也可提供良好的測預結果,因此在實務上,設置扶壁之 開挖工程,可利用本研究建議的模擬方法及原則,進行分析與設計,解決了目前有關扶壁的分析及設 計,皆尚停留在經驗的階段,尚無適當的分析模式可供使用的問題及因難。 本研究目前的成果,除可提供工程界實務的分析及設計時參考使用外,亦規劃整理成論文發表, 預計可整理成一篇論文,內容正在規劃及整理中。 參考文獻
1.Hwang, R. N., Moh, Z. C., and Wang, C. H. (2007), “Performance of wall systems during excavation for Core Pacific City,” Journal of GeoEngineering, Vol. 2, No. 2, pp. 53-60.
2.Ou, C. Y., Lin, Y. L., and Hsieh, P. G. (2006), “Case record of an excavation with cross walls and buttress walls,” Journal of GeoEngineering, Vol. 1, No. 2, pp. 79-86.
3.Ou, C. Y., Hsieh, P. G., and Chiou, D. C. (1993), “Characteristics of ground surface settlement during excavation,” Canadian Geotechnical Journal, Vol. 30, No. 5, pp. 758-767.
4.Ou, C. Y., Chiou, D. C., and Wu, T. S. (1996), ”Three-dimensional finite element analysis of deep excavation,” Journal of Geotechnical Engineering, Vol. 122, No. 5, pp. 337-345.
5.歐章煜、王怡文 (1997),深開挖工程改善壁體變形行為之措施研究,大地工程研究報告,GT97006, 國立台灣科技大學營建工程系,台北。
6.PLAXIS 3D (2010), Material Models manual.
7.Schanz, T., Vermeer, P. A., and Bonnier, P. G. (1999), “Formulation and verification of the Hardening-Soil Model,” Beyond 2000 in Computational Geotechnics. Brinkgreve, ed. Rotterdam: Balkema, pp. 281–290. 8.ACI committee 318 (1995, Building Code Requirements for Structural Concrete, (ACI 318-95) &
Commentary (ACI 318R-95)).
9.Jaky, J. (1944), “The coefficient of earth pressure at rest,” Journal of the Society of Hungarian Architects and Engineers, Vol. 78, No. 22, pp. 355-358.
10.Ladd, C.C., Foott, R., Ishihara, K., Schlosser, F., and Poulos, H.G. (1977), “Stress-deformation and strength characteristics,” Proceedings of the Ninth International Conference on Soil Mechanics and Foundation Engineering, Tokyo, Japan, Vol. 2, pp. 421-494.
11.Khoiri M., and Ou C. Y. (2013), “Evaluation of deformation parameter for deep excavation in sand through case histories,” Computers and Geotechnics, Vol. 47, No. 1, pp. 57-67.
12.Hsiung B. C. B. (2009), “A case study on the behaviour of a deep excavation in sand,” Computers and Geotechnics, Vol. 36, No. 5, pp. 665-675.
13.Calvello, M. and Finno, R. (2004), “Selecting parameters to optimize in model calibration by inverse analysis.” Computer and Geotechnics, Vol. 31, 410-424.
14.Huang, C. T., Lin, Y. K., Kao, T. C., and Moh, Z. C. (1987), “Geotechnical engineering mapping of the Taipei city,” Proceedings of the Ninth Southeast Asia Geotechnical Conference, Bangkok, Thailand, Vol. 1, pp. 3-109 to 3-120.
國科會補助專題研究計畫項下出席國際學術會議心得報告
日期: 2012 年 8 月 31 日
一、參加會議經過
由International Association of Structural Eng. & Mechanics (IASEM)和Korea Advanced
Inst. of Science & Technology (KAIST)主辦;Techno-Press Journals合作;Korea Federation
of Science and Technology Societies, Korea National Tourism Corporation, Seoul Convention
& Visitors Bureau Waterwayplus Corporation發起之2012年土木、環境和材料發展世界會議
(The 2012 World Congress on Advances in Civil, Environmental, and Materials Research),於
2012年8月26-30日在韓國首爾的COXE召開。
本次世界大會依照探討的主題,共有6個研討會,分別為如下
1.在風和結構方面的發展研討會(The 2012 International Conference on Advances in Wind
計畫編號
NSC 100-2221-E-146-007
計畫名稱
扶壁抑制深開挖引致連續壁位移的機制及分析研究
出國人員
姓名
謝百鈎
服務機構
及職稱
華夏技術學院
資產與物業管理系/研究所 教授
會議時間
2012 年 8 月 26 日至
2012 年 8 月 30 日
會議地點
COEX, Seoul, Korea
會議名稱
(中文)2012 年土木、環境和材料發展世界會議
(英文) The 2012 World Congress on Advances in Civil, Environmental,
and Materials Research
發表論文
題目
(中文)1.利用混凝土地中壁減少開挖引致之位移
2.利用電滲透化學處理夾砂層之粘土層的地盤改良
(英文)1.Use of Concrete Cross Walls to Reduce Movements Induced by
Deep Excavation
2. Ground improvement on Clay with Interbedded Sand Using
Electroosmotic Chemical Treatment
and Structures (AWAS’12));
2.大地力學和工程研討會所(The 2012 International Conference on Geomechanics and
Engineering (ICGE’12));
3.
耦合系統力學研討會 (
The 2012 International Conference on Advances in Coupled
Systems Mechanics (ACSM’12));
4. 薄 膜 在 水 處 理 的 發 展
研 討 會
(The 2012 International Conference on Advances in
Membrane Water Treatment (AMWT’12));
5.環境科學和技術
研討會(
The 2012 International Conference on Advanced Environmental
Science & Technology (AEST’12));
6.材料研究發展
研討會(
The 2012 International Conference on Advances in Materials
Research (ICAMR’12))。
希望合併這些研討會討論的主題及內容,提供了各種問題的思考路徑,及從中創造
更好的解決方案和機會,讓參與研討者思考那些領域將會的未來發展重點及方向。
本次會議共有600多篇的摘要投搞,最後有351篇品質較好的論文發表,並被收錄會
議摘要集及會議光碟中;來自世界各地超過40個國家的學者專家參與本次會議,並針對
各個議題進行技術及意見的交換與討論。
這次會議的大會也安排了9場相當精彩且精闢的Keynote lecture。這9場專題演講中提
出許多關於結構抵抗風的設計觀念、大地災害問題,並在資料處理、數值分析模擬、工
程設計、環境保護等方向進行發表及討論,對於過去之分析方法演變及未來的發展議題
提出許多新方向及思維,這些過去的回顧及新的觀點,讓與會人員獲益良多。在每場專
題演講後也皆引發與會人員許多想法及觀念,因此也引起相當熱烈及廣泛、深入的交流
與討論。
本次大會除每天安排著名學者進行精彩的專題演講外,亦分好幾個場次進行投稿論
文的發表及討論,讓每参與人員得以和發表論文的學者專家充分討論,對於許多議題有
許多新的見解,亦得以利用此機會和許多學者交換意見。
二、與會心得
本人參加此次會議,共發表二篇論文,分別為”Use of Concrete Cross Walls to
Reduce Movements Induced by Deep Excavation”及”Ground improvement on Clay with
Interbedded Sand Using Electroosmotic Chemical Treatment” , 領 域 屬 於 The 2012
International Conference on Geomechanics and Engineering (ICGE’12)。藉由參與報告及
討論,了解目前在工程力學及大地工程各項研究議題之發展,亦對於具潛力之研究
方向有所了解。對於個人未來研究方向有極大之幫助。
除此之外,對緊湊的會議討論及與會學者提出新議題,都讓本人獲益良多,而
對於研究的堅持程度,往往在討論中可以瞭解到教授們之專精及與會者對於問題的
執著,都是值得學習的地方。參與此次的會議,不僅對專業知識的精進有相當程度
之助益,亦認識了相當多同領域的專家,以及與各學校的教授及業界互相交流,對
地下工程災害事故的防控與處理這個領域之發展的認識,更是有相當大的幫助。
除此之外,本人亦發現,世界各國目前大地工程發展相當蓬勃,和大地工程有
關之各項重大工程陸續的展開,一些較大的城市的工程仍如火如荼的展開,工程量
相當的多,各種新的工法及技術亦發展得相當好。為了提供工程中之因難問題的解
決方法,而在研究上,亦有很大的進展,包括設計的觀念、方法,分析的工具等,
皆有新穎的做法和觀念。因此我們應更加鼓勵國內的研究人員,精進研究的成果,
提升國內工程的的設計與施工水準及品質。
三、考察參觀活動(無是項活動者略)
無
四、建議
無
五、攜回資料名稱及內容
會議論文摘要集、會議論文光碟片,可提供作為日後研究及教學參考資料。
六、其他
無
The 2012 World Congress on
Advances in Civil, Environmental, and Materials Research (ACEM’ 12)
Seoul, Korea, August 26-30, 2012
Use of Concrete Cross Walls to Reduce Movements Induced by Deep
Excavation
*Chang-Yu Ou
1), Pio-Go Hsieh
2)and Shao-Chi Chien
3)1)
Department of Construction Engineering, NTUST, Taipei 10672, Taiwan
2)
Department of Assets and Property Management, HWH, New Taipei City 23568, Taiwan
3)
Department of Information Tourism, AU, New Taipei City 25103, Taiwan
1)
ABSTRACT
In this study, an excavation case history, installed with cross walls case history, is presented. A three-dimensional numerical analysis for the excavation with cross walls was introduced. Both the observed and computed wall deflections for the studied case history were studied to demonstrate the effectiveness of cross walls in reducing lateral wall deflection induced by deep excavation. Results show that the maximum lateral wall deflection can be reduced by 77% at the cross wall section and 72% at the midpoint between two cross walls. A series of parametric study was performed to study the effect of cross wall depth on the lateral wall deflection. It is found that installation of the full cross wall depth can result in the best reduction in the lateral wall deflection. However, use of the cross wall height of 0.4~0.6 times the excavation depth and concrete cross wall embedment of 0.5~0.7 times the embedded diaphragm wall depth can yield the lateral wall deflection very close to that of full concrete cross wall depth.
1. INTRODUCTION
Since the density of buildings in urban areas in Taiwan is relatively high, deep excavations are often conducted next to buildings or public facilities. Necessary auxiliary measures are normally required to avoid the damage of adjacent buildings. Cross walls are common construction methods used in Taiwan for protection of adjacent buildings during excavation. The cross wall is built with concrete in an 1) Professor 2) Professor 3) Associate professor
excavation transversely before excavation, as shown in Fig. 1, using the same diaphragm wall construction technique, e.g., construction of guided walls, excavation of trench, casting of concrete and so on. Both ends of cross walls are connected with two opposite diaphragm walls. The function of cross walls in mechanism is similar to a lateral strut, but the cross wall exists before excavation. Because of the high compressive strength and stiffness of cross walls, it is expected to reduce the lateral wall deflection and ground settlement during deep excavation.
ch H ce H e H p H (a) (b)
Fig. 1. Schematic diagram of the cross wall (a) plan and (b) section A-A.
Though cross walls have been used in some excavations in Taiwan, studying on cross wall behavior is few and even documented case histories are rare. Current designs mostly remain in accordance with experiences, and the effect of reducing lateral wall deflection has not yet been verified. Moreover, cross walls can be constructed with full depth, that is, from the ground surface down to the bottom of the diaphragm wall or with partial depth, namely, from a certain depth below the ground surface down to a depth below the excavation surface. Therefore, a further study of allocations of cross walls on the reduction of lateral wall deflection is necessary.
In this study, a case history with good monitoring results is presented. A reasonable three-dimensional numerical analysis for the excavation with cross walls was introduced. Both the observed and computed lateral wall deflections for the studied case history were compared. Moreover, the same excavation but with the assumption that no cross walls were installed was analyzed to demonstrate the effectiveness of cross walls in reducing lateral wall deflection induced by excavation.
Finally, a series of parametric studies on the different depths of cross walls are performed using the three-dimensional numerical method to examine the influence of cross walls in reducing the lateral wall deflection. It is expected that with more understanding the effect of cross wall depth in reducing the lateral wall deflection, cross walls in excavations can be designed in a more compact way and to ensure the protection of adjacent buildings.
2. THE CASE HISTORY
2.1. Project overview
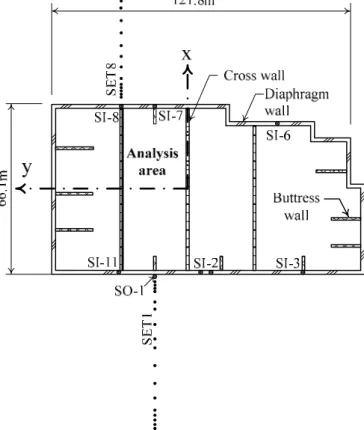
The case, situated in the Sinyi district of the Taipei city, is a 30-story structure with a seven-level basement. The excavation site was about 121.8 m long and 66.1 m wide. Fig. 2 shows the plan view (Ou 2006, Ou 2011). No buildings existed near the
excavation. The diaphragm wall, designed with 27.5 MPa of the compressive strength (f’c), was 1.5 m in thickness, and extended from ground surface down to a depth of 57.5 m, about 6.5 m penetrating into the silty sand /gravel formation. The excavation depth was 32.5 m, which was completed using the top-down construction method with seven levels of concrete slab as shown in Fig. 3. The concrete slabs 1FL and B1FL used the beam-plate system, which had thicknesses of 25 cm and 20 cm, respectively; the concrete slabs B2FL~B6FL used the flat slab system, which had a thickness of 61 cm. After excavating down to GL-29.4 m (GL refers to the ground surface level), 3-H400x400x13x21 mm steel struts, with a spacing of 6.4 m and slope of 4.6:6, were installed as temporary supports. The site was then excavated to GL-32.5 m.
Fig. 2. Plan view and the instrumentation of the case history.
To reduce the lateral wall deflection and ground settlement induced by excavation, 3 cross walls of 1.0 m in thickness and 26 m in intervals (L′ ) were constructed and their depths were between GL-1.5 m and GL-45m in the north-south direction. Ten buttress walls of 1.0 m thickness and 55 m depth, with lengths varying from 6 m to 15 m, were constructed where relatively large lateral wall deflection was expected (Fig. 2). The cross walls and buttress walls between GL+0 m to GL-1.5 m were backfilled with the in-situ soil, those between GL-1.5 m to GL-22 m were cast with 13.7 MPa concrete, and those below GL-22 m were cast with 24.0 MPa concrete. Both the cross wall and buttress wall were demolished with excavation process.
Many inclinometers were installed along the excavation sides. The inclinometers SI-8 and SO-1 and their corresponding settlement measurement sections, SET8 and SET1, were used to compare with analysis results (Fig. 2). The complete field observation data for this project are shown in Ou (2006).
2.2. Subsurface soil profile
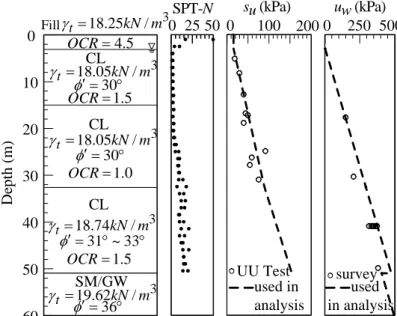
The bedrock is located at a depth of 66.7 m, and its SPT-N value is greater than 50. Above the bedrock are silty clay (CL) and silty sand with gravel (SM/GW). The groundwater table is located at GL-3 m. The porewater pressure in silty clay is generally hydrostatic, but the piezometric porewater pressure in the SM/GW was 10 m below the ground surface, i.e., at GL-10 m. The total unit weight (γt), effective internal friction angle (φ’), over-consolidation ratio (OCR), SPT-N value, undrained shear strength (su) and porewater pressure (uw) are shown in Fig. 4. As shown in the figure, the undrained shear strength of clay was obtained from the triaxial unconsolidated undrained (UU) test and the effective strength parameters for clay and sand/gravel were obtained from triaxial consolidated undrained test and the direct shear test, respectively.
Fig. 3. Locations of the slabs and steel strut for the case history.
0 25 50 SPT-N 60 50 40 30 20 10 0 De pth (m) Fill CL CL SM/GW 0 100 2000 250 500 su (kPa) uw (kPa) used in analysis used in analysis UU Test survey 3 / 25 . 18 kN m t= γ 3 / 05 . 18 kN m t= γ 3 / 74 . 18 kN m t= γ CL 3 / 05 . 18 kN m t = γ 3 / 62 . 19 kN m t= γ ° = ′ 36 φ 5 . 1 = OCR 0 . 1 = OCR 5 . 1 = OCR 5 . 4 = OCR ° = ′ 30 φ ° = ′ 30 φ ° ° = ′ 31 ~33 φ
2.3. Monitoring results
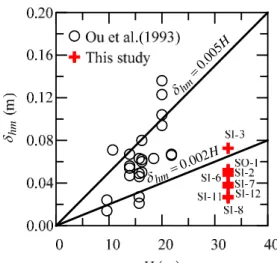
The relationship between the maximum wall deflections and excavation depths for excavations in soft clay in Taipei, under the plane strain condition and without remedial measures like soil improvement, has been studied by Ou (1993), as shown in Fig. 5. As shown in this figure, the maximum wall deflection (δhm) increases with the excavation depth (H). The wall deflection in soft clay is generally greater than that in sand. The ratio of the maximum wall deflection to excavation depth (δhm/H) is around 0.2% to 0.5%, in which the upper limit is mostly for clay, the lower limit for sand and those for the alternating layers of sand and clay fall in between the two limits. This figure represents general trend of wall deflections for excavations in Taipei. Fig. 5 also presents the maximum wall deflections obtained from the 8 inclinometers in the north-south direction at the final stage in this case history. Because the case was situated in clayey layer, the relationship should be close to upper limit. However, the observed results are actually below and near the lower limit, much smaller than those of the excavations with similar depths in Taipei (Ou 1993), also much smaller than those of the cases compiled by Clough (1990).
hm δ H hm 005 . 0 = δ H hm 002 . 0 = δ
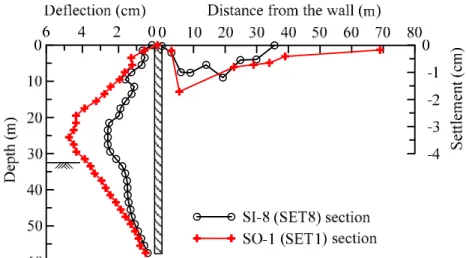
Fig. 5. Relationship between the maximum wall deflection and excavation depth. Fig. 6 shows the lateral wall deflection and ground settlement at the final stage of excavation at SI-8 (SET8), which was located at the section where the cross wall was installed. As shown in this figure, the wall deflection was extremely small, and the maximum wall deflection reached barely 2.61cm. The wall displayed a concave type of displacement, in which the maximum wall deflection occurs near the excavation surface while the wall below the excavation surface showed a linear type of displacement
because of the restraining effect of the cross wall. The ground settlements were also comparatively small, with a maximum value reaching 1.2 cm. As shown in Fig. 6, the
δhm/H was equal to 0.08%, much less the lower limit of the general trend for deep excavations in Taipei. This implies that the cross wall has a significant effect in reducing wall deflection and ground settlement.
Fig. 6 also shows the lateral wall deflections and ground settlement at the final stage of excavation at SO-1 (SET1) section, located at the midpoint between two cross walls. As shown in this figure, the wall deflection and the ground settlement were of the larger
magnitude than those at the SI-8 (SET8) section. The δhm was 4.74 cm. The ground settlement was also very small, with a maximum value being 1.34 cm. As shown in Fig. 6, the δhm/H was equal to 0.14%, which is also less than the lower limit of the general trend.
Fig. 6. The observed wall deflections and ground surface settlements at the final excavation stage for SI-8 (SET8) and SO-1 (SET1) sections.
3 NUMERICAL ANALYSIS
3.1. Parameters and mesh
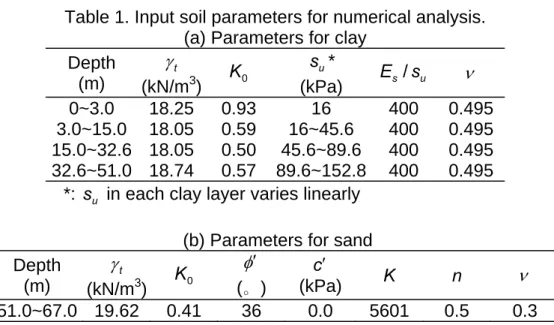
A three-dimensional finite difference computer program, FLAC3D (Itasca Consulting Group, Inc. 1997), is used as a basic numerical analysis tool. A pressure dependent linear elastic-perfectly plastic constitutive model with the plasticity plateau described by the Mohr-Coulomb strength criterion is adopted to simulate the behavior of both clay and sand. Table 1 lists the parameters used for analysis where the coefficient of earth pressure at rest (K0) was obtained according to Jaky (1944) and Alpan (1967); the normalized undrained Young’s modulus (Es/su, Es is Young’s modulus) for the Taipei silty clay was found around 400 (Lim 2010), and Poisson’s ratio (ν ) for clay under the undrained condition can be set equal to 0.495. For typical sand, it is normally assumed that ν =0.3. Considering that the Es of sand increases with the confining pressure, the Es can be estimated according to Janbu (1963)
, 3 n a a s P KP E ⎟⎟ ⎠ ⎞ ⎜⎜ ⎝ ⎛ ′ = σ (1)
where Pa is the atmospheric pressure, K is the stiffness modulus number, and n is the stiffness modulus exponent and σ’3 is the minor effective principal stress.
According to Ou (1994), n can be reasonably assumed to be 0.5. K can be estimated by the wave equation, in which the shear wave velocity of soil can be obtained from the cross-hole test or estimated by the relationship between the shear wave velocity and SPT-N value.
Table 1. Input soil parameters for numerical analysis. (a) Parameters for clay
Depth (m) t γ (kN/m3) K 0 u s * (kPa) E /s su ν 0~3.0 18.25 0.93 16 400 0.495 3.0~15.0 18.05 0.59 16~45.6 400 0.495 15.0~32.6 18.05 0.50 45.6~89.6 400 0.495 32.6~51.0 18.74 0.57 89.6~152.8 400 0.495
*: s in each clay layer varies linearly u
(b) Parameters for sand Depth (m) t γ (kN/m3) K 0 φ′ (。) c′ (kPa) K n ν 51.0~67.0 19.62 0.41 36 0.0 5601 0.5 0.3
The structural materials in this study, including the concrete diaphragm walls, cross walls, buttress walls and concrete slabs used in the top-down construction method and temporary steel struts, were simulated by the linear elastic model. The shell element was used for diaphragm walls, cross walls and buttress walls while the beam element was used for temporary steel struts and the concrete slabs. For simplifying the analyses, the excavation sites are assumed symmetric with respect to the center lines of the width and length of the sites. Therefore, only about one-quarter of the excavation area was adopted for analysis. When planning the meshes, the boundary in the horizontal directions (x and y directions) were placed at a distance of four times the excavation depth behind the wall, and the boundary in the depth direction (z direction) was placed at rock. The boundary of the bottom was restrained from both the vertical and horizontal movements while the vertical boundaries were restrained from the horizontal movement.
3.2. Analysis results
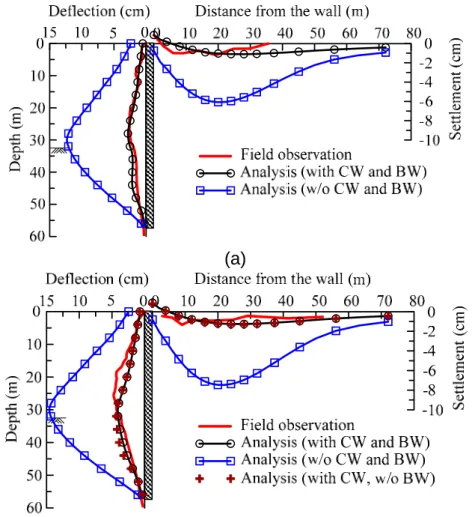
Fig. 7 shows the comparison of the observed wall deflections and surface settlements at SI-8 (SET8) and SO-1 (SET1) sections at the final excavation stage and those computed from the analyses. The analyses follow the exact construction sequence and allocation of cross walls and buttress walls. In addition, analyses of the case with the assumption of no cross walls and buttress walls (w/o CW and BW) are performed, and the results are shown in the same figures.
Fig. 7 shows that the computed wall deflections for excavations without cross walls are quite consistent with the excavations in Taipei as studied by Ou (1993). The computed wall deflections for the studied case, i.e., the excavation with cross walls, were quite close to the observed though poor computation for surface settlement was obtained because the small strain behavior of the soil far from the diaphragm wall was not taken into account. As long as the lateral wall deflection was concerned, the adopted simulation of construction sequence, constitutive models and selection procedure of parameters in this study can be justified.
(a)
(b)
Fig. 7. Comparison of wall deflections and surface settlements from field observation and those from analysis at final excavation stage (a) SI-8 (SET8) and (b) SO-1 (SET1) sections.
Fig. 7(a) also shows that the computed wall deflections and surface settlements at the cross wall installed section, i.e., SI-8 (SET8), was much smaller than those without cross walls and buttress walls. Installation of cross walls can substantially reduce lateral wall deflections and surface settlements. The maximum wall deflection and surface settlement at the final excavation stage were reduced by 77% and 80%, respectively, by the installation of such walls. Like Fig. 7(a), Fig. 7(b) also shows that the computed wall deflections and surface settlements at the midpoint of two cross walls, i.e., SO-1(SET1) section, were much smaller than those without cross walls and buttress walls. Installation of cross walls and buttress walls can substantially reduce lateral wall deflections and surface settlements for the section at the midpoint between cross walls. The maximum wall deflection and surface settlement at the final excavation stage were reduced by 72% and 83%, respectively, by the installation of cross walls. Furthermore, analysis of the excavation with only cross walls, i.e., no buttress walls, was carried out to examine the contribution of buttress walls at the midpoint of two cross walls, i.e., at SO-1(SET1) section, in reducing the lateral wall deflection and surface settlement. The computed results are also shown in Fig. 7(b). Little difference
between the case with cross walls and buttress walls and the case with only cross walls was found. Installation of additional buttress wall at the midpoint of two cross walls does not have any effect in further reducing the lateral wall deflection and surface settlement. Therefore, the effect of the buttress wall in reducing lateral wall deflections and surface settlements was insignificant.
4. PAREMETRIC STUDY
The influence of total depth of cross walls on the lateral wall deflection will be studied in terms of the cross wall height, referring to a measurement above the excavation surface (Hch) and embedded cross wall, referring to a measurement below excavation surface (Hce), as shown in Fig. 1. The concept of plane strain ratio proposed by Ou (1996) will be adopted to evaluate the effectiveness of cross walls on the lateral wall deflection. The plane strain ratio at the midpoint of two cross walls (PSRC) were defined as , , , ps hm middle hm C PSR δ δ = (2)
where δhm,middle is the maximum lateral wall deflection at the midpoint of two cross walls and δhm,ps is the maximum lateral wall deflection under the plane strain condition.
When designing cross walls, a smallest height ratio (Hch/He) and embedment ratio (Hce/Hp) should be adopted and meanwhile, its PSRC should also be close to those with full height and full embedment, that is, Hch/He =1 and Hce/Hp =1. Therefore, the critical height ratio, (Hch/He)cr, is defined as the height ratio (Hch/He) at which the resulting
PSRC was the same as that at Hch/He =1 for a specific He, L′ , and B. Similarly, the critical embedment ratio, (Hce/Hp)cr, is defined as the embedment ratio (Hce/Hp) at which the obtained PSRC was the same as that at Hce/Hp =1.
A basic assumed excavation was set up to perform parametric study to obtain (Hch/He)cr
and (Hce/Hp)cr for various excavations. This assumed case was of the rectangular
shape where the excavation width (B) was 40 m and excavation length (L) was infinite. The final excavation depth (He) was 20 m, which was completed in 7 stages. The temporary steel struts were installed at 1.0 m above the excavation surface and then excavation was conducted for the next stage of excavation. The diaphragm wall thickness was 1.0 m. The embedded diaphragm wall (Hp) was equal to He. The cross walls are with 20 m in interval (L′ ) and 1.0m in thickness. The compressive strength (f’c) of the diaphragm wall and cross wall was 27.5 MPa.
Moreover, the excavation was assumed to be in clay whose parameters were assumed the same as the third layer of above case history except the su was assumed to be equal to 0.3σ’v where σ’v was the effective vertical pressure. For parametric studies, the values of He, B, L′ , Hch and Hce were varied as shown in Table 2. Of them, L′=∞ implies the excavation was not installed with cross walls and the wall deflection would be under the plane strain condition, in which the maximum lateral wall deflection was represented by δhm,ps. This study performs the analysis of (Hch/He)cr and (Hce/Hp)cr for
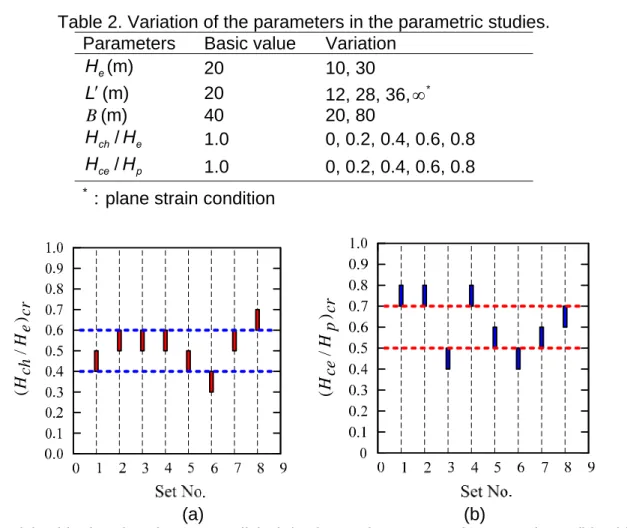
the total of eight sets of excavations. The results are shown in Fig. 8. It is found that (Hch/He)cr and (Hce/Hp)cr were generally in the range of 0.4~0.6 and 0.5~0.7, respectively.
Therefore, to have an economic design of a cross wall and also have a good reduction in wall deflection, it is reasonable to install the cross wall that both Hch/He and Hce/Hp are about equal to 0.6.
Table 2. Variation of the parameters in the parametric studies. Parameters Basic value Variation
e H (m) 20 10, 30 L′ (m) 20 12, 28, 36,∞ * B (m) 40 20, 80 e ch H H / 1.0 0, 0.2, 0.4, 0.6, 0.8 p ce H H / 1.0 0, 0.2, 0.4, 0.6, 0.8
*:plane strain condition
cr e H ch H ) / ( cr p H ce H ) / ( (a) (b)
Fig. 8. (a)Critical ratio of cross wall height for various sets of excavations (b)Critical ratio of cross wall embedment for various sets of excavations.
Fig. 9 shows the lateral wall deflections at the midpoint of two cross walls and at the cross wall section for the cases of Hch/He =1.0, Hce/Hp =1.0 and of Hch/He =0.6, Hce/Hp =0.6, when He =20 m, L′ =28 m and B=40 m. For comparison, results from the analysis for no cross walls are also shown on the same figure. The lateral wall deflections for those with cross walls with different depths were all much smaller than those of no cross walls. Installation of cross walls obviously can reduce the lateral wall deflections at the midpoint of two cross walls and at the cross wall section. The figure also shows that an excavation with Hch/He =1 and Hce/Hp =1 can yield the best reduction in lateral wall deflections. The lateral wall deflections at the cross wall section and at the midpoint of the two cross walls for the case of Hch/He =0.6, Hce/Hp =0.6 are quite close to those with full cross wall height and embedment. Use of the cross wall height and
embedment at the critical condition can result in the same reduction in lateral wall deflections as the full cross wall height and embedment.
0 . 1 / , 0 . 1 / e = ce p = ch H H H H 6 . 0 / , 6 . 0 / e = ce p = ch H H H H 0 . 1 / , 0 . 1 / e= ce p = ch H H H H 6 . 0 / , 6 . 0 / e = ce p = ch H H H H
Fig. 9. Comparison of lateral wall deflections between the condition of critical wall height and embedment and full depth for He=20 m, L′=28 m and B=40 m.
CONCLUSION
Based on the study presented in this paper, the following conclusions can be
drawn:1. From the plane view, the lateral wall deflection increased with the increasing distance from the cross wall. Such behavior was similar to the three dimensional behavior of the diaphragm wall near the corner in an excavation. To realistic simulation of cross wall, a three dimensional numerical analysis is required. 2. The cross wall was effective in reducing the lateral wall deflection and ground
settlement. The lateral wall deflection at the position where the cross wall was installed can be reduced to a very small amount. According to the case study, the maximum wall deflection and ground settlement compared to without cross walls and buttress walls was reduced by about 77% and 78% at the cross wall installed,
respectively, and about 67% and 81% at the midpoint of two cross walls, respectively. 3. Use of the cross wall height of 0.4~0.6 times the excavation depth and cross wall
embedment of 0.5~0.7 times the embedded diaphragm wall depth can yield the lateral wall deflection very close to that of full cross wall depth.
REFERENCES
Alpan, I. (1967). “The empirical evaluation of the coefficient K0 and K0R,” Soils Found., Vol. 7(1), 31-40.