*This work was supported by National Science Council under 1
System-Level Power Estimation Platform for
Net-work-on-Chip*
Kuei-Chung Chang, Chiu-Han Liao
Department of Information Engineering and Computer Science, Feng-Chia University
[email protected], [email protected]
Kuan-Hung Chen
Department of Electronic Engineering, Feng-Chia University
Abstract―Hardware designers are steadily decreasing
the size of chip structures and the supply voltages. Fur-thermore, system power management techniques imple-mented by the operating are used to reduce energy con-sumption. However, due to the fact that the number of gates and the clock frequencies are constantly increasing, overall power consumption is still a limiting design factor. Live power measurement is necessary for both hardware and software designer, but it requires too much time for simulation, especially for embedded systems. The major contribution of this paper is to present a simple method for rapidly estimating power consumption and find the hot spots in the network-on-chip(NoC) at run time. The platform, implemented by SystemC, allows early explora-tion of the performance and power consumpexplora-tion of NoC, which is able to handle arbitrary topologies and routing schemes. The simulator implements flit-level mes-sage-passing mechanism and supports application data specified as input trace files or generated at run-time by synthetic traffic generators.
Index Terms―Network-on-Chip, Low-Power, SoC,
Simulator.
I. INTRODUCTION
Deep-submicron technologies have clearly had a big impact on capacity and what can be designed on a single system-on-chip (SoC). With increased functionality, however, comes increased complexity for the design and verification process. Simultane-ously, the industry has been looking at ways to prove engineering productivity by offering im-proved register-transfer-level (RTL) verification tools with advanced features, such as con-strained-random test generation, functional
cover-age metrics and assertions made available through such languages as SystemVerilog. Along with those trends, the industry has introduced design and veri-fication tools that operate at higher levels of ab-straction, such as the electronic system level (ESL), supported through languages such as SystemC [1-3].
As technology scaling enables the integration of billions of transistors on a chip, economies of scale are prompting the move toward parallel chip archi-tectures with application-specific sys-tems-on-a-chip (SoC) leveraging multiple specific purpose cores on a single chip for better perform-ance at manageable design costs. As these parallel chip architectures scale in size, on-chip networks have become the main communication architecture, replacing dedicated interconnections and shared buses. NoC architectures have to deliver good la-tency-throughput performance in the face of very tight power and area budgets. Interconnection net-works consume 20%–36% of total system power in many large SoCs [4].
A. Related Work
Designing cost-sensitive embedded products such as smart phones and portable media player requires maximizing a platform's performance while minimizing energy use. The more efficient
version will result in a more cost-effective product. With power dissipation becoming an increasingly vexing problem across many classes of computer systems, measuring power dissipation of real, run-ning systems has become crucial for hardware and software system research and design. Live power measurements are imperative for studies requiring execution times too long for simulation. Especially for embedded systems, there is a high demand for optimization techniques that enable energy reduc-tion for software, since an increasing number of applications are powered by batteries. Therefore, recent studies have been focusing on developing techniques to reduce the energy consumption at various levels, including program optimization for low power [5-9].
There are two traditional methods used to ac-quire energy consumption information: simulations or measurements. Programmers find simula-tion-based energy estimation techniques convenient if appropriate simulation models are available [10-12]. For low-power software development, in-struction- or architecture-level energy simulators such as Wattch [10] and SimplePower [12] might be better solutions. However, those cycle-accurate simulators have a reputation for being slow. At present, power measurement tools are available for only the lower levels of the design - at the circuit level and the gate level. These are very slow and impractical to use to evaluate the power consump-tion of software, and often cannot even be applied due to lack of availability of circuit and gate level information of the embedded processors.
B. Contributions
Since all the facts show that power estimation is important, therefore, recent studies have focused their solutions on various levels, including program
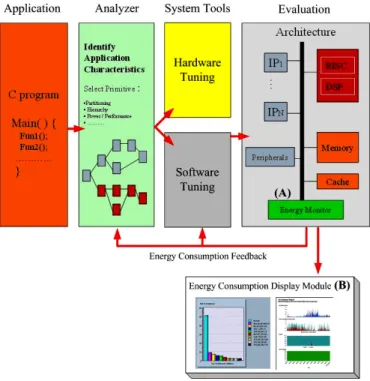
optimization for low power. The main contribution of this paper is that we design a simple and fast methodology for gathering live, per-unit power es-timates based on NoC component access counters and switching counters on the ESL simulation platform, shown as Figure 1. Our method has great performance than gate-level simulation. In this simulator we have to design a power model for on-chip interconnect components used by the analysis modules for power estimation. The power consumption of interconnect components can be estimated by the traffic information in the NoC with the proposed high-level power model. In addi-tion, we will build GUI display components to show simulation results.
Fig. 1: Basic idea of power estimation.
In this project, we use SystemC to implement the simulator kernel. SystemC provides a single language to define hardware and software compo-nents, it provides a single language to facilitate seamless hardware software co-simulation, and
provides a single language to facilitate step-by-step refinement of a system design down to the register transfer level for synthesis.
The rest of the paper is organized as follows. We describe the proposed high-level power estimation approach for NoC in Section II. The experimental results and case studies are shown in Section III. Finally, we summarize our findings in Section IV.
II. THE PROPOSED HIGH-LEVEL POWER
ESTIMATION PLATFORM A. System Architecture
Fig. 2: System Block Diagram
Figure 2 shows the architecture of the proposed System-Level Power Estimation Platform for On-Chip Interconnect Architecture (OCIPEP) sys-tem, which consists of four components, and each component is responsible to execute several func-tionalities. In this paper, we attempt to design an electronic system-level on-chip interconnect simu-lation framework, named On-Chip Interconnect Simulation Platform (OCISP), to early and fast
ex-plore the system information. We also provide a monitoring component, named Traffic Monitoring Component (TMC), to monitor and gather commu-nication traffic from the simulated interconnect ar-chitecture and either to display the information at run-time or store the information in files or data-base to provide off-line analysis and display. The platform will support tracing for debugging pur-poses on all its elements. In addition, it will also support logging of bus traffic for purposes of esti-mations. We attempt to design a subsystem, named Power Information Analysis Component (PIAC) to provide on-line and off-line analysis for the simula-tion. In addition, we also want to build a GUI-based display component, named Power In-formation Display Component (PIDC) to provide different displays to provide designers different views for their designs.
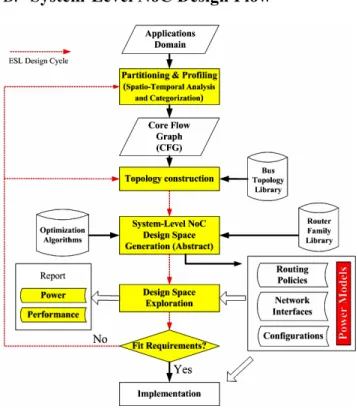
B. System-Level NoC Design Flow
The NoC is a structured interconnection archi-tecture such that it can be integrated into a design flow easily, as shown in Figure 3. First, the com-munication characteristics among partitioned cores can be derived by profiling embedded applications. Then, we can construct suitable communication topologies according to the profiling results and specific purposes, such as power and performance constraints. Using topology construction tools or topology templates in the library we can decide which cores should be connected in the same router such that the power consumption of communica-tions can be minimized. After constructing the in-terconnection topology, we can apply other optimi-zation mechanisms according to the application traffic characteristics and the interconnection ar-chitecture.
C. High-Level Power Measurement C1. Two-Phase Power Estimation
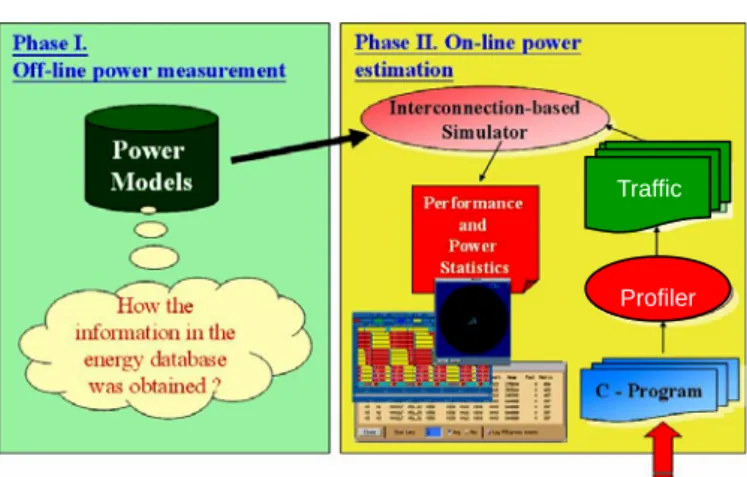
Fig. 4: Two-Phase Power Estimation
Figure 4 shows the two-phase power estimation approach. For high-level fast simulation we have to measure the power consumption of the key com-ponents in the network router previously. We store these power models in files for later simulations. In
phase 2, we will analysis the traffic characteristics in the interconnect architecture and gather access counts and bit switching activities. With the gath-ered information we can estimate the rough power consumption of each router.
C2. High-Level Power Model
We will monitor the access count of each com-ponent of the router during execution. We embed a counter outside the component to record the total access count. The value of the counter will be ac-cumulated if the input data and the control signal of the component changed. Switching activity and coupling activity cause dynamic energy consump-tion of CMOS circuits. The switching activity is largely dependent on the Hamming distance of data between current and previous clock cycles. The switching activity happens when the data bit is from 0 to 1 or from 1 to 0. Thus, it can be expected that the actual energy cost of executing a program may be different from the component's data inputs. The more bit switches, the more power consumed. We will keep the state of input data and control signal every cycle. We need to compare the data of current cycle with the data of previous cycle, so we can get the amount of bit switches. Coupling activ-ity is determined by averaging the coupling be-tween adjacent lines for an execution trace of a benchmark.
Based on these counter values, we can estimate the power consumption of each component used for communications by following formulation.
P(Ci) = (Caf*AF + Ccf*CF) * V2dd * f + Pleak ;
E(Ci) = T * P(Ci) ;
where P(Ci) is the power consumption of
com-Traffic
ponent Ci per access with different switching activ-ity factor(AF) and coupling factor(CF). Caf repre-sents the capacitance related to switching activity, and Ccf means the capacitance related to coupling activity. Pleak means the leakage power of the com-ponent. These characteristics can be measured by low-level power measurement tools off-line, such as PSPICE and Nanosim. They can precisely pre-dict the timing, power consumption, and function-ality of the designs.
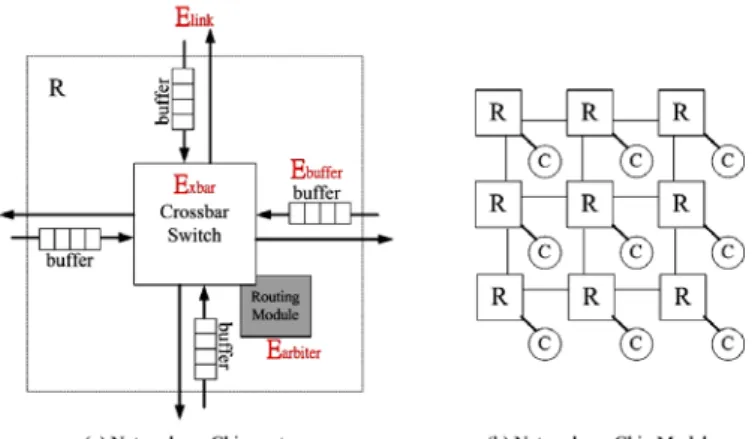
The energy model of the NoC router consists of four parts including Ebuffer, Exbar, Elink, and Earbiter, shown as Figure 5. We can get the total energy consumption Etotal of the communication architec-ture by following formulation.
Epacket = Ebuf_r + Ebuf_w + Exbar + Elink + Earbiter
+ Ebase ;
,where Epacket is the total energy consumption during the communication, the Ebase is the basic energy consumption except the power consumed by the accessed components. The Ebuf_r means the en-ergy cost reading packet from the buffer, and the
Ebuf_w means the energy cost writing packet in the
buffer. The main purpose of the proposed simulator is to provide a flexible high-level simulation plat-form to tune the communication characteristics quickly, such as topology, mapping, buffer size, buffer count, etc. It’s hard to achieve high accuracy for the power model; however, the relative power consumption in the router can be measured by low-level power simulators with high accuracy. The relative power consumption of each component in the router can be used in the simulator to find hot spots in the network efficiently.
Fig. 5: Power model of router in the NoC.
III. EXPERIMENTAL RESULTS
A. Experimental Environment
We design an evaluation flow as shown in Fig-ure 6 that starts from application specifications, continues through the topology construction of the application. At first we use the simplescalar to simulate applications and collect the data flow. Then the Read/Write analyzer will analyze the communication behaviors between the writer cores and reader cores, and it will generate a core flow graph. The test pattern generator will analyze the communication statistics between writers and read-ers, and then generates the simulation workloads for final simulations. The workload content in-cludes access address, write data, read data, and request, etc. After profiling, we get the communi-cation status of cores, and then generate the simula-tion patterns for Verilog simulator. Finally, we can get power and performance results to evaluate our design.
The power models for the arbiter, buffer, cross-bar, and the wire have been calibrated with Nanosim simulations of these components over different technologies.
Fig. 6: Evaluation flow of the experiments
B. Case Studies
Fig. 7: Simulated NoC.
In this section, we show the some case studies for power estimation. This experiment shows the power consumption of a 3x3 NoC. The count of simulated packets is about 1000 packets, and the injection rate is about 0.1 (packet/cycle/node). In this case study core 0 send 90% of the total re-quests to core 8 to simulate a high-communicative core pair, shown as Figure 7.
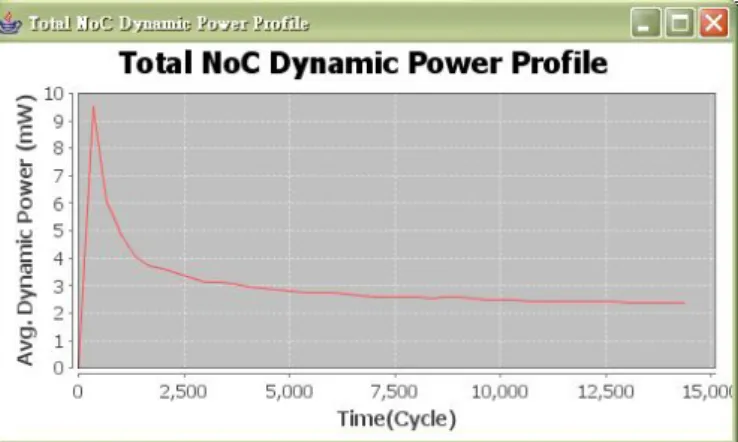
Figure 8 shows the overview of the platform. Figure 9 – Figure 11 show the result charts of power consumption of the case. Figure 9 shows the power consumption of separated router components. Form the figure we can find that some routers are
busy and the dynamic power consumption is higher than that of other routers. Figure 10 shows the power profile of each router in the NoC. Figure 11 shows the total dynamic power consumption of the NoC.
Fig. 8: Simulation platform overview.
Fig. 9: Power consumption of router components.
Fig. 11: Power consumption profile of the NoC.
C. Comparisons With Low-Level Experiments
Fig. 12: MPEG-4 decoder mapping topologies.
We take the MPEG-4 decoder as our case study, and Figure 12 shows the profiled core flow graph of MPEG-4 application and the experimental in-terconnection architectures with power-aware map-ping described in [13]. Figure 12(b) is the com-pared topology, and the power-aware topology generated by the proposed tool is shown as Figure 12(c). In the experiments, the ratio of the power saving approximates to 35% of the NoC compared
to the referenced topology. The power saving meas-ured by low-level power measurement in [13] ap-proximates to 29%. From the results we can find that the high-level simulator can identify the opti-mal communication architecture.
D. Discussions
The software simulator must use high level lan-guage to model the behavior of the core, compo-nents and the monitoring circuit, so the simulation speed depends on the speed of the computer. The proposed method has less accuracy than gate level simulation. However, our goal is not to get precise power consumption of each component, we just want to get relative power consumption of each accessed component in a NoC. By this way, pro-grammers can remove hot spots that could consume the maximum power between pairs of modules. Due to the flexibility of the ESL modeling, it makes the application be simulated and tuned in a reasonable and realistic way.
Clearly, high-level NoC power ignores many detailed activities of the component power; how-ever, the proposed approach enables a easy analysis framework that is much faster than cycle-accurate low-level power simulations.
IV. CONCLUSION
In this paper we present a run-time power meas-urement infrastructure based on using component power counters to estimate interconnect architec-ture power consumptions. Because our method has per-component power consumptions, we can get unit-by-unit power estimates in the router. If hard-ware vendors can see the competitive advantage of providing customers with detailed power informa-tion about their products, the proposed simulainforma-tion platform can get more accurate and different types
of the power consumption about each application. In the future we will build the integrated develop-ment environdevelop-ment for many-core NoC to let pro-grammers to develop power-aware multi-core ap-plications easily.
REFERENCE
[1] D. Gajski et al. “SpecC: Specification Language and Methodology,” Kluwer, Jan 2000.
[2] L. Cai and D. Gajski, “Transaction Level Mod-eling: An Overview,” Proc. CODES+ISSS, pp. 19-24, Newport Beach, CA, Oct. 2003.
[3] Chris Lennard and Nizar Romdhane, “Building a virtual-platform Design Ecosystem through Open System-level Integration Strategies”, Design Strategies and Methodologies, vol 5, no 4, pp. 52-57, 2006
[4] SOTERIOU, V. AND PEH, L.-S. Design-space exploration of power-aware on/off intercon-nection networks. In Proceedings of the IEEE International Conference on Computer De-sign (ICCD). 510–517, 2004.
[5] Naehyuck Chang, Kwanho Kim, and Hyung Gyu Lee. Cycle-accurate energy measurement and characterization with a case study of the arm7tdmi. IEEE Transactions on Very Scale Integration Systems, 10(2), April 2002.
[6] Robert P. Dick, Ganesh Lakshminara-yana,Anand Raghunathan, and Niraj K. Jha. Analysis of power dissipation in embedded systems using real-time operating systems. IEEE Transaction on computer-aided design of integrated circuits and systems, 22(5), 2003. [7] Canturk Isci and Margaret Martonosi. Run-time
power monitoring in high-end processors: Methodology and empirical data. In Proceed-ings of the 36th International Symposium on Microarchitecture, December 2003.
[8] D. Shin, H. Shim, Y. Joo, H. Yun, J. Kim, and N Chang. Energy monitoring tool for low-power embedded programs. IEEE Design and Test of Computers, 19(4), July 2002.
[9] Greg Stitt, Frank Vahid, Tony Givargis, and Roman Lysecky. A _rst-step towards an archi-tecture tuning methodology for low power. In Proceedings of the International conference on Compilers, architectures, and synthesis for embedded systems, pages 187-192, November 2000.
[10] Robert P. Dick, Ganesh Lakshminarayana, Anand Raghunathan, and Niraj K. Jha. Power analysis of embedded operating systems. In Proceedings of the 36th conference on Design automation conference, pages 312{315, June 2000.
[11] Tajana Simunic, Luca Benini, and Giovanni DeMicheli. Cycle-accurate simulation of en-ergy consumption in embedded systems. In Proceedings of the 36th ACM/IEEE confer-ence on Design automation conferconfer-ence, pages 867-872, June 1999.
[12] W. Ye, N. Vijaykrishnan, M. Kandemir, and M. J. Irwin. The design and use of simplepower: a cycle-accurate energy estimation tool. In Pro-ceedings of the 37th conference on Design automation, pages 340-345, June 2000.
[13] Kuei-Chung Chang, Jih-Sheng Shen and Tien-Fu Chen, “Tailoring Circuit-Switched Network-on-Chips to Application-Specific System-on-Chip by Two Optimization Schemes”, to appear in ACM Transaction on Design Automation of Electronic Systems,Vol. 13, No. 1, Article 12 , January 2008