Effect of doping metal ion on holographic storage characteristics
of PQ/poly(hydroxyethyl methacrylate-co-methyl methacrylate)
hybrids
Wei-Sheng Cheng
a, Wha-Tzong Whang
*a, Yu-Chia Chang
a, Po-Lin Chen
b,
Yi-Nan Hsiao
band Shiuan-Huei Lin
ba
Department of Material Science and Engineering,
b
Department of Electrophysics,
National Chiao Tung University, Hsin-Chu, Taiwan, R.O.C.
*E-mail:
[email protected]
ABSTRACT
Holographic Storage Characteristics of PQ/poly(methyl methacrylate) have been significantly improved by doping metallic ion Yb+3 and Er+3. The hybrid materials display significant enhancement in the holographic characteristics. The diffraction efficiency promote to 59% with Yb+3, to 47% with Er+3 from the undoped sample is 40%. The increment is up to 47% in Yb+3 sample;the dynamic range enhance to 2.12 and 1.58 on Yb+3 and
Er+3 containing sample individually in comparison to 1.16 for the undoped copolymer. The increment of dynamic range is up to 82% for Yb+3 containing sample. The related mechanism of these changes is preliminary discussed with the analysis of UV-vis, FT-IR and Photoluminescence spectroscopy.
Keywords: Holographic Storage, diffraction efficiency, dynamic range
1. INTRODUCTION
Holographic storage is considered a new kind of optical storage technology in the next generation because this technology has significant gains in storage densities and data transfer rate [1]. In our previous research, we fabricated the good optical quality photopolymer PQ/PMMA system successfully by thermal polymerization. The related photochemical mechanism analysis indicated that the PQ/PMMA recorded hologram through photoreaction between PQ and the residual monomer to form the new photoproduct [2]. Furthermore, by doping organometallic Zinc methacrylate (ZnMA) into PQ/PMMA, the holographic optical characteristics have been
significantly improved [3]. The Zn+2 in the organometallic ZnMA promote the reaction of monomers with PQ, containing o-quinone, on exposure. The photochemical reaction causes the change of the local refractive index and results in the 3-D modulation of refractive index in the sample [4,5].
During the last decade, Douglas group reported the transition metallic ion formed complexes with o-quinones in a wide range of oxidation state [6]. For example, the oxidation state of free o-quinones can be o-benzoquinone, or o-benzosemiquinone, or catecholate when it meets proper transition metallic ion. The different oxidation states show on electron coupling between ligand and transition metallic ion through the stepwise reduction or oxidation. These statements have been verified by Infrared (I.R.), Cyclic Voltammograms (C.V.), Size Exclusion Chromatography (SEC), Electron Spin Resonance (EPR) [7-11].
The peculiar characteristics of PQ with transition metallic ion are applied to our volume holographic data storage. Through the complexation between PQ and transition metallic ion, the photochemical reaction of PQ with residual monomer of the samples can be improved. In this study, Yb+3 and Er+3 are doped in the PQ/MMA-HEMA copolymer. In order to avoid the shrinkage problem, we adopt the pre-polymerization process to develop a new, good optical photopolymer in advance[2]. Volume holographic characteristics of these samples have presented a significant improvement. And the mechanism has also been studied using UV-vis, IR and photoluminescence (PL) spectroscopies.
2. EXPERIMENTAL PROCEDURES
Material preparation
The holographic materials is composed of Methyl methacrylate (MMA) and 2-Hydroxyethyl methacrylate (HEMA) as a copolymer host, organometallic compounds as a guest, 9,10-phenanthrenequinone (PQ) as a photo initiator, and AIBN as a thermal initiator. The organometallic compounds are Ytterbium (Ⅲ) acetate tetrahydrate and Erbium (Ⅲ) acetate hydrate. The water content is removed from the organometallic compound at 80 ℃ according TGA analysis. The dehydrate compound can endow better solubility in organic monomers. Monomers MMA and HEMA with the ratio of 3:7 and the PQ molecules with the weight ratio of 0.7% are first mixed together to form homogenous solution. Then, the liquid sample is modified by adding organometallic compound with the weight ratio of 0.02%. The metallic ion containing the mixture is further stirred about 24hr under the constant temperature 35 ℃. Finally, the solution is poured into a self-made cell (the thickness is 2mm) and baked at 45 ℃ for 3 days until it becomes solid. The process can avoid the shrinkage problem and offer samples good optical quality.
UV-vis absorption spectrum is measured with Hitach-U2000 spectrophotometer. Hitachi E4500 is used to characterize the photoluminescence spectrum of the sample. Samples are scanned on PerkinElmer 100 (FT-IR) at room temperature to investigate function groups. The samples for FT-IR measurement are prepared by dissolving PQ and organometallic compound in tetrahydrofuran (THF) and drop the solution on KBr pellets then dry at room temperature. The volume holographic characteristics are recorded at a wavelength of 514 nm from argon gas laser. The holographic optical setup is shown on Figure 1.
3. RESULTS & DISCUSSION
Holographic Recording
The diffraction efficiency curves of the single hologram of the sample without and with doped metallic ion are shown in figure 2. The diffraction efficiency depends on exposure energy and time. As shown in figure 2, the maximum diffraction efficiency of the doped Yb+3 copolymer is 59% with the exposed energy is 19.3 J/cm2 and that of the doped Er+3 copolymer is 47% with the exposed energy is 17.1 J/cm2. Both samples have higher diffraction efficiency than the undoped copolymer, with the diffraction efficiency 40% and the exposed energy 20.59 J/cm2. The increments of the diffraction efficiency are 47% and 17.5%. Moreover, by analyzing the rise time, the doped Yb+3 copolymer and the doped Er+3 copolymer are of 243s and 233s respectively. The undoped copolymer is of 281s. Both doped samples show shorter rise time than the undoped copolymer. It reveals that the copolymer containing metal ion don’t need more time to reach the higher maximum diffraction efficiency. The results tell us that doping these two transition metal ion just 0.02%, leads to significant improvement of the maximum diffraction efficiency with less rise time. Small amount of the transition metallic ion demonstrates great contributions. In addition, the refractive index change can be theoretically calculated to relate the photochemical reaction. The refractive index change is due to the photochemical reaction on exposure. According to the diffraction formula of the holographic grating
)
cos
(
sin
2θ
λ
π
η
=
d
∆
n
, the refractive index change due to writing on the doped Yb+3 copolymer and the doped Er+3 copolymer are 8.16×10⁻⁵ and 7.04×10⁻⁵ respectively.That of the undoped copolymer is 6.38×10⁻⁵. The amount of refractive index change of sample containing metal ion is larger than the undoped copolymer. This result proves that adding the metallic ions into copolymer enhance the photochemical reaction. Meantime, the dynamic range of multiple-hologram recording experiments at a single location is recorded by using a peristrophical multiplexing technique. We record 250 phase holograms in our sample and readout the diffraction efficiency for each hologram. According to the equation∑
= = n
1
curve of the cumulative grating strength (C), where η is diffraction efficiency and n the total number of the
holograms. When i approaches to n, Ctends to be saturated, and its saturation value is equal to the dynamic range, called M/#. As depicted in figure 3 and Table 1, the dynamic range of the doped Yb+3 copolymer and the
doped Er+3 copolymer are 2.12 and 1.58 respectively. They are higher than that of the undoped copolymer 1.16.
In addition, we perform a curve fitting to get the material sensitivity by the functionC(E)=Csat[1−exp(−E/Eτ)], where E is exposure energy and Eτ gives the exposure energy constant of the material, and the saturation value Csat equal to the value of M/#. The sensitivity of the volume holographic data storage describes the speed of
photoreaction at the initial state of the material and can be written by the expression, S=Csat/Eτ =M#/Eτ. The
doping metal ions into copolymer can rise up the dynamic range and diffraction efficiency indeed, but reduces the sensitivity.
Photochemical measurement
UV-visible spectrum and PL spectrum
The UV-visible absorption spectra are in figure 4. The absorption of light in thick sample must be low enough to form the phase hologram instead of amplitude hologram. The unexposed sample has strong absorption in the visible range 400-480 (nm) and the absorption drops rapidly when λ > 480 nm. The tail adsorption at the wavelength 514 nm meets our requirements for volume holographic recording. After exposure, the samples dramatically decrease the visible absorption with tail when λ > 400 nm. The change is due to the less conjugation in the final product than in the original sample, it has been discusses in our other publication [2]. As the
conjugation in a compound decreases, less delocalization of the π electrons results. The result is a increase in transition energy from π-π* and thus a blue shift. The chemical structure change is verified through PL spectrum on figure 5. Those spectra exhibit that exposed sample has much stronger luminescence intensity than the unexposed sample. The pristine PQ has two conjugated carbonyl groups. Carbonyl groups usually have strong quench effect on exciton, so that, the exciton doesn’t easily loose energy through radiation but transfers energy to environment through non-radiative process. In this way, the unexposed sample displays weak photoluminescence intensity. After the exposure, the photoreaction causes the PQ molecules loose one or two carbonyl groups. The disappearance of carbonyl groups reduces the exciton quencher number. It leads to the exciton can release energy through the radiative process and a much stronger photoluminescence spectrum.
FT-IR spectrum
Figure 6 depicts the IR spectra of the samples, which are prepared only mixing PQ and organometallic compound in THF. THF replaced MMA and HEMA to avoid the interference of C=O absorption. It directly presents the interaction of PQ with metallic ion under exposure. From figure 6(a), it is noticed that the carbonyl group (C=O) peak and the stretching peak of C=C in aromatic ring appear at 1674 cm-1 and 1591 cm-1
/2 plate Potanaation Beam Splitter Mirror Pdhrror ?J2ptate Spatial fitter Potanaation B emo Splitter
—
Cylindricalteas ?j2 plate Mirror Mirror Wavelenth:5l4smo Mirror Shatter :aa:: 350 Patymer flab Rotator Stagecompare to that of the pristine PQ. It means the most of carbonyl groups of PQ react with Yb+3 through strong
interaction to form a new identity. This new identity continues further to proceed photoreaction on exposure. However in figure 6(b), the carbonyl absorption peak of the PQ/Er+3 sample have less significant change before
exposure. It shows the carbonyl groups less strongly interact with Er+3 before exposure, but they react through
photoreaction on exposure. It tells us PQ exhibits stronger interaction with Yb+3 than Er+3. Analysis the
difference between these two samples, the PQ/Yb+3 sample carries on the photoreaction through the new identity
structure of PQ comprehend Yb+3, but the PQ/Er+3 sample through less interaction of PQ with Er+3 and pristine
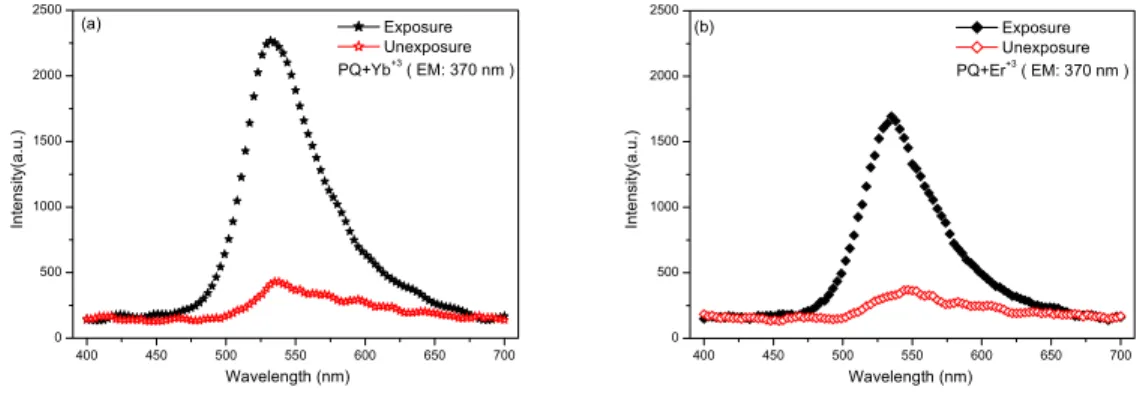
characters of PQ. Meantime, as figure 7 shows, it reveals exposure PQ-Yb+3 has the stronger luminescence
intensity than another one. It directly shows that metal ion Yb+3 and PQ have better chemical interaction. As a
consequence, the conclusion clarified clearly that the better interaction between PQ and metal ion, the better the characteristics of holographic storage.
4. CONCLUSION
It is demonstrated that Yb+3 and Er+3 metallic ion can significantly enhance the holographic characteristics of
PQ/P(MMA-HEMA) polymer materials. The diffraction efficiency rise up to 59% and 47%, the dynamic range enhance to 2.12 and 1.58 on Yb+3 and Er+3 containing copolymers, respectively. The increment percentages of
diffraction efficiency and dynamic range of doped Yb+3 sample are 47% and 82% respectively; those of doped
Er+3 sample are 17% and 36% respectively. The major cause of improving the holographic characteristic is the
interaction between PQ and metallic ion. Besides, the different metallic ions bring the different interaction to form complex. The better interaction between PQ and metal ion, the better the holographic characteristic of the material.
Fig. 1 The optical setup for holographic volume storage 0 5 10 15 20 25 30 35 40 0 10 20 30 40 50 60 70 (a) Copolymer Doped Yb+3 Copolymer Doped Er+3 Copolymer Exposure Energy (J/cm2) Di ff ra ction E ffici ency (% ) 0 100 200 300 400 500 600 700 0 10 20 30 40 50 60 70 (b) D iffr act ion E ffic ienc y ( % ) Time(s) Copolymer Doped Yb+3 Copolymer Doped Er+3 Copolymer
Fig. 2 Diffraction efficiency versus exposure and time for photocopolymers
0 10 20 30 40 50 60 70 80 90 0.0 0.5 1.0 1.5 2.0 2.5 (a) Copolymer Doped Yb+3 Copolymer Doped Er+3 Copolymer Exposure energy (J/cm2 ) C um ul ati ve g ra tin g s tre ng th 0 200 400 600 800 1000 1200 0.0 0.5 1.0 1.5 2.0 2.5 (b) Time(s) Cumu la tive g rat in g s tr e ng th Copolymer Doped Yb+3 Copolymer Doped Er+3 Copolymer
Fig. 3 The running curve of the cumulative grating strength of photocopolymers
Table1 Characteristics of volume holographic of samples without and with metallic ion photopolymer
Sample M# Et(J/cm2) Sensitivity(cm2/J)
Copolymer 1.16 13.72 0.67
Doped Yb+3 copolymer 2.12 14.84 0.14
300 400 500 600 700 0.0 0.5 1.0 1.5 2.0 2.5 3.0 3.5 4.0 (a) A b sor ba nce (a .u.) Wavelength (nm) Exposure Unexposure Copolymer 300 400 500 600 700 0 1 2 3 4 (b) A b so rban ce (a.u.) Wavelength (nm) Exposure Unexposure Doped Yb+3 Copolymer 300 400 500 600 700 0 1 2 3 4 (c) A bsorb ance (a.u.) Wavelength (nm) Exposure Unexposure Doped Er+3 Copolymer
Fig. 4 UV-vis absorption spectra of (a) undoped (b) doped Yb+3 (c) doped Er+3 photopolymer
300 350 400 450 500 550 0 1000 2000 3000 4000 5000 (a) In tens ity (a. u. ) Wavelength (nm) Exposure Unexposure Copolymer(EM: 290 nm) 300 350 400 450 500 550 0 500 1000 1500 2000 2500 (b) In tens ity (a. u. ) Wavelength (nm) Exposure Unexposure Doped Yb+3 Copolymer(EM: 290 nm) 300 350 400 450 500 550 0 1000 2000 3000 4000 5000 (c) In tens ity (a. u. ) Wavelength (nm) Exposure Unexposure Doped Er+3 Copolymer(EM: 290 nm)
Fig. 5 PL spectra of (a) undoped (b) doped Yb+3 (c) doped Er+3 photopolymer
2000 1800 1600 1400 1200 1000 800 600 PQ 1552 1679 1552 1594 1675 (a) Abso rb a nce ( a .u .) Wavelength(nm) Unexposure Yb+3+ PQ Exposure Yb+3+ PQ 2000 1800 1600 1400 1200 1000 800 600 PQ 1542 1591 1670 (b) 1594 1675 Abs orb an ce (a.u .) Wavelength(nm) Unexposure Er+3 + PQ Exposure Er+3 + PQ
Fig. 6 FT-IR spectra of (a) PQ + Yb+3 (b) PQ+Er+3 on KBr pellet before and after exposure
400 450 500 550 600 650 700 0 500 1000 1500 2000 2500 (a) In tens ity (a.u.) Wavelength (nm) Exposure Unexposure PQ+Yb+3 ( EM: 370 nm ) 400 450 500 550 600 650 700 0 500 1000 1500 2000 2500 (b) Inte nsity(a.u .) Wavelength (nm) Exposure Unexposure PQ+Er+3 ( EM: 370 nm )
REFERENCE
1. Lisa Dhar, “High-Performance Polymer Recording Materials for Holographic Data Storage,” MRS bulletin, 31, 324-328 (2006).
2. Yi-Nan Hsiao, Wha-Tzong Whang and Shiuan-Tzong Lin, “Analyses on physical mechanism of holographic recording in phenanthrenquinone-doped poly(methyl methacrylate) hybrid materials,” Opt. Eng., 43(9), 1993-2002 (2004).
3. Yi-Nan Hsiao, Wha-Tzong Whang and Shiuan-Tzong Lin, “Effect of ZnMA on optical and Holographic Characteristics of Doped PQ/PMMA Photopolymer,” Jap. J. Appl. Phys., 44, 914-919 (2005).
4. Francisco del Monte, Oscar Martínez, Jose A. Rodrigo, Maria L. Calvo and Pavel Cheben, “A Volume Holographic Sol-Gel Material with Large Enhancement of Dynamic Range by Incorporation of High Refractive Index Species,” Adv. Mat., 18, 2014-2017 (2006).
5. Eunkyoung Kim, Jiyoung Park, Changwon Shin and Nam Kim, “Effect of organic side-chains on the diffraction efficiency of an organic–inorganic hybrid nanocomposite film,” Nanotech., 17,2899-2906 (2006).
6. Douglas J. Gordon and Richard F. Fenske, “Theoretical Study of o-Quinone Complexes of Chromium and Vanadium,” Inorg. Chem., 21, 2907-2915 (1982).
7. Paul J. Crowley and Helmut M. Haendler, “Metal Halide Complexes of o-Quinones. I. Preparation and Preliminary Characterization,” Inorg. Chem., 1, 904-909 (1962).
8. Robert M. Buchanan, Jeffrey Claflin and Cortlandt G. Pierpont, “Studies on Complexes Containing Mixed-Valence Semiquinone-Catecholate Ligands. Synthesis and Characterization of Bis(o-quinone) (bipyridine)chromium(III) Complexes,” Inorg. Chem., 22, 2552-2556 (1983).
9. Jean-Raphae1 Caille, Antoine Debuigne and Robert Jerome, “Controlled Radical Polymerization of Styrene by Quinone Transfer Radical Polymerization(QTRP),” Macromolecules , 38, 27-32 (2005).
10. Antoine Debuigne, Jean-Raphael Caille and Robert Jerome, “Quinone Transfer Radical Polymerization of Styrene:Synthesis of the Actual Initiator,” J. of Poly. Sci. Poly. Chem., 44, 1233-1244 (2006).
11. Junpei Yuasa, Tomoyoshi Suenobu and Shunichi Fukuzumi, “Binding Modes in Metal Ion Complexes of Quinones and Semiquinone Radical Anions:Electron-Transfer Reactivity,” ChemPhysChem, 7, 942-954 (2006).