科技部補助專題研究計畫成果報告
期末報告
股票分割的資訊內涵(第3年)
計 畫 類 別 : 個別型計畫 計 畫 編 號 : NSC 101-2410-H-004-085-MY3 執 行 期 間 : 103年08月01日至104年07月31日 執 行 單 位 : 國立政治大學財務管理學系 計 畫 主 持 人 : 湛可南 計畫參與人員: 碩士級-專任助理人員:董珮珊 碩士級-專任助理人員:李淯靖 博士班研究生-兼任助理人員:楊曉琳 博士班研究生-兼任助理人員:陳苡文 博士後研究:董珮珊 報 告 附 件 : 移地研究心得報告 處 理 方 式 : 1.公開資訊:本計畫可公開查詢 2.「本研究」是否已有嚴重損及公共利益之發現:否 3.「本報告」是否建議提供政府單位施政參考:否中 華 民 國 104 年 10 月 30 日
中 文 摘 要 : 股價的跳升使得公司在投資組合中的權重大幅增加,因此投資人必 須重新調整投資組合以降低風險。此時若該公司無法吸引足夠的買 氣,其股價便會因為投資人進行調整而下滑。若公司進行股票分割 以吸引新投資人、促進交易,即可緩解股價被低估的現象。由於股 價低估經常導致資訊交易以及選擇權交易的產生,因此本文透過股 票分割期間的股票以及選擇權交易行為,驗證上述股票分割的投資 組合重組假說。 中 文 關 鍵 詞 : 投資組合重組、O/S、股價低估、股票分割、盈餘慣性、交易策略 英 文 摘 要 : After experiencing significant stock price run-ups, a firm
becomes overweight in its shareholders‘ portfolios, subjecting them to excessive firm-specific risk and creating portfolio rebalancing needs. If the firm cannot attract sufficient buying interests, selling pressure from rebalancing leads to undervaluation. The firm can resolve the undervaluation problem by splitting its shares to attract new investors to better facilitate shareholders‘ portfolio rebalancing. Since undervaluation attracts informed trading and makes listed options more appealing, we analyze stock price behavior and relative trading of options over stock surrounding stock splits and find compelling evidence consistent with our portfolio-rebalancing hypothesis of stock splits.
英 文 關 鍵 詞 : portfolio rebalance, O/S, stock undervaluation, stock splits, post-earnings announcement drift, trading strategy
___________________________
We are grateful to Gurdip Bakshi, Hendrik Bessembinder, Utpal Bhattacharya, Mark Grinblatt, Jiekun Huang, Jingzhi Huang, Neil Pearson, Avanidhar Subrahmanyam, and participants at the Sixth Chulalongkorn Accounting and Finance Symposium, Hong Kong Baptist University, Hong Kong Polytechnic University, Louisiana State University, Shanghai University of Finance and Economics, and University of Hong Kong for helpful comments. Konan Chan acknowledges the financial support from the Ministry of Science and Technology, Taiwan (NSC 101-2410-H-004-085-MY3). Tse-Chun Lin gratefully acknowledges the research support from the Faculty of Business and Economics and the University of Hong Kong and the Research Grants Council of the Hong Kong SAR government. Any remaining errors are ours.
a Department of Finance, National Chengchi University, [email protected]. b School of Economics and Finance, University of Hong Kong, [email protected]. c School of Economics and Finance, University of Hong Kong, [email protected]. d
E.J. Ourso College of Business Administration, Louisiana State University, [email protected].
Price Run-Ups, Portfolio Rebalancing Needs, and Stock Splits
Konan Chana
National Chengchi University
Fengfei Lib
University of Hong Kong
Tse-Chun Linc
University of Hong Kong
Ji-Chai Lind
Louisiana State University
Abstract:
After experiencing significant stock price run-ups, a firm becomes overweight in its shareholders’ portfolios, subjecting them to excessive firm-specific risk and creating portfolio rebalancing needs. If the firm cannot attract sufficient buying interests, selling pressure from rebalancing leads to undervaluation. The firm can resolve the undervaluation problem by splitting its shares to attract new investors to better facilitate shareholders’ portfolio rebalancing. Since undervaluation attracts informed trading and makes listed options more appealing, we analyze stock price behavior and relative trading of options over stock surrounding stock splits and find compelling evidence consistent with our portfolio-rebalancing hypothesis of stock splits.
Price Run-Ups, Portfolio Rebalancing Needs, and Stock Splits
AbstractAfter experiencing significant stock price run-ups, a firm becomes overweight in its shareholders’ portfolios, subjecting them to excessive firm-specific risk and creating portfolio rebalancing needs. If the firm cannot attract sufficient buying interests, selling pressure from rebalancing leads to undervaluation. The firm can resolve the undervaluation problem by splitting its shares to attract new investors to better facilitate shareholders’ portfolio rebalancing. Since undervaluation attracts informed trading and makes listed options more appealing, we analyze stock price behavior and relative trading of options over stock surrounding stock splits and find compelling evidence consistent with our portfolio-rebalancing hypothesis of stock splits.
JEL classification: G30, G12, G14, G17
Price Run-Ups, Portfolio Rebalancing Needs, and Stock Splits
1. Introduction
Why do firms split their stocks? Weld, Benartzi, Michaely, and Thaler (2009) review
potential explanations including signaling and optimal trading range and find that none of the
existing theories are able to explain why firms split their stocks to manage their stock price levels.
Similarly, Easley, O’Hara, and Saar (2001, p. 25) point out “why a split per se is necessary is
unclear. . . . Empirical research has documented a wide range of negative effects such as
increased volatility, larger proportional spreads, and larger transaction costs following the splits.
On balance, it remains a puzzle why companies ever split their shares.” However, many firms
whose stocks have performed well split their stocks, and the market tends to react positively to
split announcements (see, e.g., Grinblatt, Masulis, and Titman (1984), Ikenberry, Rankine, and
Stice (1996), and Lin, Singh, and Yu (2009)). These stylized facts imply that the benefits of
stock splits to the firms should outweigh the associated negative effects. The question is: What
are the benefits of stock splits?
According to Chordia, Huh, and Subrahmanyam (2007), run-ups of stock prices naturally
lead to share turnover due to investors’ portfolio rebalancing needs. Lakonishok and Lev (1987)
and Asquith, Healy, and Palepu (1989) show that, prior to stock splits, split firms tend to
experience considerable earnings growth, which pushes stock prices up in the pre-split period.
Motivated by these observations, we propose a novel hypothesis to explain why firms do stock
splits and examine their implications for stock price behavior. Specifically, our hypothesis posits
that, after experiencing significant price run-ups, a stock becomes overweight in its shareholders’
needs. Selling pressure builds when many existing shareholders plan to sell shares for portfolio
rebalancing needs, even if they may not sell shares at the same time.
This selling pressure depends on the composition and the characteristics of shareholders,
such as when they became shareholders and their propensities for rebalancing their portfolios;
and it would not be a concern if the firm has a large investor base to draw buying interests.
However, if the firm cannot attract sufficient buying interests, the selling pressure from
shareholders’ portfolio rebalancing needs leads to stock undervaluation. In other words, the
selling pressure from rebalancing needs acts as a “brake” for the stock price to rise to its full
value. Undervaluation would attract informed investors, who trade strategically and camouflage
among uninformed traders (Kyle (1985) and Admati and Pfleiderer (1988)). Informed buying to
capture such undervaluation induced by past stock price run-ups can move the stock price toward
its full value and generate a price momentum. The price momentum can further increase
not-yet-rebalancing shareholders’ needs to rebalance their portfolios.
While undervaluation attracts informed investors to buy the stock, trading on listed
options, if available, can be even more appealing to these informed investors because of options’
implicit leverage to enlarge trading gains (Back (1993)). This rationale suggests that the
valuation effect of portfolio rebalancing needs induced by stock price run-ups can also affect the
options market. The price momentum in the equity market and the relative preference for trading
options should be related as both have a common underlying factor triggered by undervaluation
induced by substantial stock price run-ups.
Thus, we hypothesize that, prior to a stock split, portfolio rebalancing needs induced by
price run-ups impede the price discovery function of the market and lead to undervaluation, and
investors to better facilitate existing shareholders’ portfolio rebalancing needs. By attracting new
investors to offset the selling pressure from shareholders’ portfolio rebalancing, a stock split
restores the price discovery function and makes the market more efficient. Therefore, our
hypothesis predicts that undervaluation and price momentum are likely to show up in the
pre-split period but would disappear in the post-pre-split period.
A stock split may attract more investors because (i) it calls attention to the firm (Grinblatt,
Masulis, and Titman (1984)), (ii) it induces more information production (Brennan and Hughes
(1991) and Chemmanur, Hu, and Huang (2014)), and (iii) it reduces capital needed for buying a
round lot, allowing speculators with limited risk-taking capacity to take a small position on the
firm (Schultz (2000) and Lin, Singh, and Yu (2009)). Consequently, by attracting more new
investors, a stock split allows existing shareholders to sell part of their holdings to new investors,
resulting in better risk sharing.
Furthermore, because stock undervaluation can adversely affect managerial
compensation and corporate resource allocation, managers have incentives to use a stock split to
resolve the undervaluation problem.
Our hypothesis highlights stock undervaluation resulting from the selling pressure of
existing shareholders after significant price run-ups in the pre-split period. Accordingly, we
design tests based on the notion that undervaluation attracts informed investors whose trading
would make the stock price gradually incorporate the undervaluation, hence leading to a
significant momentum effect (Jegadeesh and Titman (1993) and Fama and French (2008)). Thus,
our first test examines the momentum effect on split firms’ stock returns before and after stock
To assess the extent of the momentum effect associated with stock splits, we run a
cross-sectional regression of split firms’ excess stock returns for each event month t on their past
cumulative returns from month t–12 to t–2 and a set of control variables. We find that the split
firms’ momentum effect is significant in the five months prior to the split announcement month.
Our estimation shows that, holding other things constant, a 100% stock price run-ups over the
past 11 months leads to a rise of 1.7% in stock price per month during the five pre-split months,
suggesting that nontrivial undervaluation exits in the pre-split period.
After actual stock splits, the momentum effect disappears. We do not find a similar
pattern of the momentum effect on a control sample of non-split firms. The evidence is
consistent with our portfolio-rebalancing hypothesis and suggests that the selling pressure after
significant price run-ups weighs on stock prices and leads to stock undervaluation.
If stock undervaluation exists, listed options would be even more attractive to informed
investors. Hence, our second test infers the existence of stock undervaluation based on the
intensity of trading on options relative to that on stock.1 More specifically, we following Roll,
Schwartz, and Subrahmanyam (2010) to analyze the trend and the information content of O/S,
the relative trading of options over stock, to show the existence of stock undervaluation prior to
stock splits. 2
1
Roll, Schwartz, and Subrahmanyam (2010) show that O/S, the trading of options over stock, prior to an earnings announcement is significantly related to absolute cumulative abnormal returns at the earnings announcement. Their results provide evidence on the return predictability of O/S and the occurrence of more informed trading in options prior to the earnings announcement. Similarly, Cao, Chen, and Griffin (2005) find that options volume is related to takeover announcement returns of target firms and provide evidence that informed traders make trades prior to takeover announcements. These findings are consistent with Pan and Poteshman (2006), who show that put/call ratios reflect fluctuations in informed trading in the options market and are good predictors of future stock returns. Chan, Ge, and Lin (2014) provide the most recent evidence that informed trading measures based on stock options can predict the acquirer announcement returns in a large sample.
2 Using O/S, Roll, Schwartz, and Subrahmanyam (2010) track where investors prefer to trade, the options market or
the equity market. The advantages of options are their implicit leverage and usefulness for hedging positions in the underlying stock or other options. However, the liquidity in each market is also a very important factor. Indeed, Roll, Schwartz, and Subrahmanyam find that options delta and trading costs, along with institutional holdings, analyst following, and analyst forecast dispersion are important determinants of O/S.
Similar to Lakonishok and Lev (1987), we find unusually high trading volume on stocks
prior to stock splits, which is consistent with the notion that portfolio rebalancing needs after
substantial price run-ups lead to more trading (Chordia, Huh, and Subrahmanyam (2007)). More
important, we find that trading on split firms’ listed options increases even more, which results in
a clear, positive trend in the average O/S of split firms prior to stock splits. Our cross-sectional
analysis further reveals that the O/S can largely capture the split firms’ momentum effect in the
months before stock splits. Moreover, the split announcement return, which is a measure of the
extent of stock undervaluation prior to a stock split, is significantly and positively related to the
pre-split O/S.
In sum, our paper contributes to the literature in the following three aspects. First, we
offer a novel hypothesis to explain stock splits. While our hypothesis recognizes the need for
more information production in order to attract more buyers to offset the selling pressure after
significant stock price run-ups, it is somehow different from Brennan and Hughes’ (1991)
information production theory of stock splits. They argue that lowering stock price associated
with a stock split raises brokerage commissions, which induce brokerage houses to produce more
information for investors to trade on the split firm. Their theory suggests that only managers with
positive information about the future prospects of their firm have incentives to attract more
analyst coverage, which uncovers the positive information and reveals it to investors. However,
our hypothesis suggests that the problem of stock undervaluation exists prior to the
announcement of the stock split and emphasizes that informed investors are inclined to trade on
stock undervaluation before stock splits, rather than the split inducing more information
production that leads to the uncovering of the problem, as suggested by the information
significant stock price run-ups may induce portfolio rebalancing needs, which can hinder the
market’s price discovery function prior to a stock split. Similarly, while we agree with Schultz’s
(2000) and Lin, Singh, and Yu’s (2009) findings that a stock split can attract more small
investors to trade on the stock, we argue that they do not fully explain the potential cause and
consequence of the undervaluation problem that a firm faces prior to the stock split.
Second, using a sample of stock splits, our study extends Chordia, Huh, and
Subrahmanyam (2007) to show that portfolio rebalancing needs induced by significant price
run-ups not only affect share turnover but also have an effect on stock valuation. This inference is
based on our findings of a price momentum and of the predictive power of O/S on future stock
returns during the pre-split period.
Our third contribution is to show that stock splits improve market efficiency. By
attracting more new investors to offset the selling pressure from shareholders’ portfolio
rebalancing needs, stock splits improve the price discovery function and resolve the
undervaluation problem. Consequently, after stock splits, stock price becomes more informative,
the momentum effect disappears, the appeal of trading options declines, and more investors share
the risk. Thus, stock splits are a useful corporate tool even though they may be accompanied by
some negative effects, as noted by Easley, O’Hara, and Saar (2001).
The remainder of the paper is organized as follows. Section 2 reviews the related
literature and develops the portfolio-rebalancing hypothesis of stock splits. Section 3 discusses
the data used to test our hypothesis. Section 4 investigates the price momentum induced by stock
undervaluation in the pre-split period. Section 5 examines stock undervaluation using the trend
2. Literature review and hypothesis development
What can motivate a firm to split its stock? Why does the market tend to react positively
to a stock split announcement? These questions are intriguing and have received considerable
attention in the finance literature. In this section, we review the literature related to our study and
develop a new hypothesis of stock splits to answer these questions.
2.1. The literature on stock splits
The two main competing hypotheses proposed in the literature for explaining why firms
split their stocks are signaling and liquidity improvement. Brennan and Copeland (1988) propose
that because stock splits lower the price levels and increase trading costs, they can serve as a
costly signal of managers’ favorable private information to the market. Asquith, Healy, and
Palepu (1989) thus suggest that managers use stock splits to signal that recent earnings growth is
permanent. Also, McNichols and Dravid (1990) note that splits can be used to convey
information on improvement in future earnings. However, Lin, Singh, and Yu (2009) show
evidence of declining latent trading costs after stock splits, which contradicts the costly signal
hypothesis proposed by Brennan and Copeland. Weld, Benartzi, Michaely, and Thaler (2009)
also argue that stock splits cannot be motivated by signaling because post-split prices are usually
centered on those of peer firm prices and rejoining the herd is not consistent with a separating
equilibrium. We add to this line of questioning by showing that informed investors trade more
options prior to stock splits, suggesting that, instead of being informed by the split announcement,
some traders seem to know beforehand that the firms’ stock prices do not fully reflect relevant
information and that they trade options to profit from their knowledge. It is an indication that the
While managers often claim that stock splits are intended to attract more investors and to
improve stock liquidity,3 liquidity on the dimensions of bid–ask spread and turnover does not
seem to improve after stock splits.4
Recently, Baker, Greenwood, and Wurgler (2009) propose a catering theory of stock
splits, which predicts that, when investors place higher valuations on low-priced firms, managers
respond by supplying shares at lower price levels, and vice versa. However, the catering
incentive can be explained by the notion that investors place higher valuation on low-priced
firms when more investment opportunities are available and firms use stock splits to attract more
investors to share the risk of taking on new, risky projects.
This finding leads Easley, O’Hara, and Saar (2001, p. 25) to
note that “stock splits remain one of the most popular and least understood phenomena in equity
markets.” However, consistent with the liquidity improvement hypothesis, Lin, Singh, and Yu
(2009) show that incidence of no trading decreases and liquidity risk is lower after stock splits.
Nevertheless, because firms tend to split their stocks after significant price run-ups, none
of the theories of stock splits proposed in the literature have explored the possibility that
significant stock price run-ups may create a problem for the equity market’s price discovery
function. We next develop a new hypothesis of stock splits to show such a problem.
2.2. Hypothesis development
Our hypothesis is motivated by Chordia, Huh, and Subrahmanyam (2007), who provide
strong evidence of trading activities from portfolio rebalancing needs induced by past stock
returns. Their finding leads us to consider the possibility that a firm may experience “growing
pains” when its stock price has grown substantially without a corresponding increase in its
3 See, for example, Dolley (1933), Baker and Gallagher (1980), and Baker and Powell (1993). 4
Copeland (1979), Conroy, Harris, and Benet (1990), Easley, O’Hara, and Saar (2001), and Gray, Smith, and Whaley (2003) all report that relative bid–ask spread increases following stock splits.
investor base. The “pains” arise because the rise in equity value makes the firm overweight in its
shareholders’ portfolios, causing them to face unnecessary firm-specific risk and creating
portfolio rebalancing needs.
To rebalance their portfolios, shareholders must sell part of their holdings on the firm.
Thus, significant stock price run-ups can induce a selling pressure, which weighs on the stock
price. In other words, a discount may develop to attract buyers to step in and balance the selling
by shareholders. The selling pressure depends on the composition and characteristics of
shareholders, such as when they became shareholders and their propensities for rebalancing their
portfolios. Moderating factors also exist. For example, some shareholders may be momentum
investors or positive feedback traders in the sense that they start with a relatively small position
and buy more shares when the stock price increases. This momentum buying can mitigate the
selling pressure from existing shareholders’ portfolio rebalancing after significant price run-ups.
Selling pressure also may not depress the stock price when there are a sufficient number of
prospective investors, who would invest in firms with a good tracking record.
This reasoning leads us to hypothesize that if the firm cannot attract sufficient buying
interests, the selling pressure from existing shareholders’ portfolio rebalancing needs induced by
substantial price run-ups will lead to stock undervaluation. The firm can resolve the
undervaluation problem by splitting its shares to attract new investors to better facilitate its
existing shareholders’ portfolio rebalancing needs.
A stock split can attract new investors for three reasons. First, Grinblatt, Masulis, and
Titman (1984, p.464) suggest that announcing a stock split calls attention to the firm, “triggering
reassessments of the firm’s cash flows by market analysts.” The reassessments may bring in new
lowering the stock price associated with a stock split raises brokerage commissions, which
induce brokerage houses to produce more information for their clients to trade on the split firm.
Third, for small investors with limited risk-taking capacity, a stock split makes it affordable for
them to include the firm into their portfolios.5
Our portfolio-rebalancing hypothesis adds to the stock split literature by positing that,
before announcing a stock split, stock undervaluation develops largely because the selling
pressure induced by significant stock price run-ups can impede the equity market’s price
discovery function. By bringing in new investors to balance the selling pressure from—and to
share risk with—existing shareholders, a stock split improves market efficiency and resolves the
undervaluation problem.
This portfolio-rebalancing hypothesis allows us to make several testable predictions on
share turnover and stock price behavior of split firms, which are summarized as follows:
H1: If stock splits facilitate existing shareholders’ portfolio rebalancing needs, the average percentage shareholding per common shareholder (and per institutional investor) should decrease following stock splits.
H2: Because price run-ups induce portfolio rebalancing needs, the change in the average percentage shareholding per common shareholder (and per institutional investor) should be inversely related to the pre-split price run-ups.
H3: Because portfolio rebalancing needs contribute to trading activities, split firms’ share turnover should be positively related to their past price run-ups. This association
5 Indeed, Amihud, Mendelson, and Uno (1999) show that when companies in Japan reduce their stock’s minimum
trading unit (i.e., the number of shares in a round lot) to better facilitate trading by small investors, the number of their individual shareholders significantly increases. Similarly, Fernando, Krishnamurthy, and Spindt (1999) analyze mutual fund share splits and find that, relative to matched non-split funds, split funds experience significant increases in net assets and shareholders. Also, Schultz (2000) shows a significant increase in small trades following the splits, and Easley, O’Hara, and Saar (2001) find more uninformed (and informed) trades after stock splits.
between turnover and prior price run-ups should be stronger in the pre-split period than in the post-split period.
H4: Because selling pressure from existing shareholders’ portfolio rebalancing needs can lead to undervaluation and undervaluation attracts informed investors, we expect that stock returns in the pre-split period are positively related to the past price run-ups, but this momentum effect should disappear after stock splits.
Because stock undervaluation makes listed options even more attractive to informed
traders, the trading volume on listed options of split firms would increase more than that on the
stocks in the pre-split period. Moreover, the relative trading of options over stock (O/S) and the
momentum effect on stock returns in the pre-split period should be related if stock
undervaluation is the common underlying factor that fuels both informed trading and momentum
trading. We capture these predictions as follows:
H5: Split firm’s price momentum and O/S are related, and O/S is informative about undervaluation before stock splits. The pre-split O/S predicts stock returns, but this predictability disappears after stock splits.
H6: The pre-split O/S predicts the split announcement return, which reflects the extent of undervaluation prior to the announcement.
In the sections that follow, we discuss the data used to test our predictions and then
3. Data
To test our hypothesis, we collect a sample of stock splits by firms with listed options
available. Our initial split sample includes firms that made stock split announcements with a split
factor of at least 0.25 from 1996 to 2012 from the CRSP.6
For each split firm, we find a matched non-split firm, matched by firm size and
book-to-market ratio (B/M), which has no stock split around the two-year window centered at the split
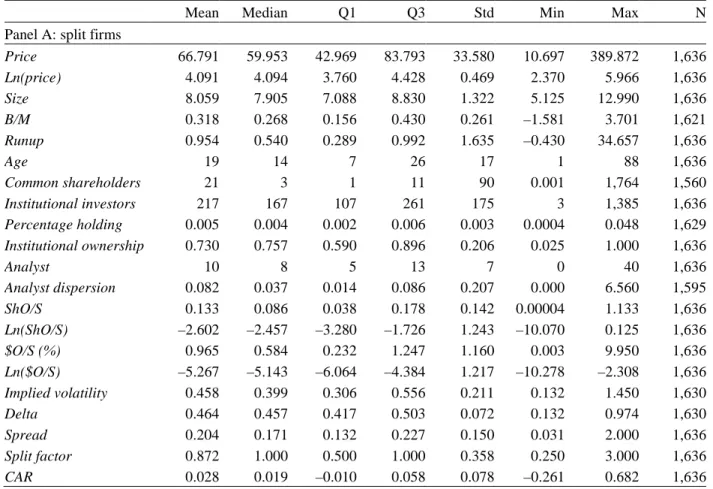
announcement. Table 1 reports summary statistics of firm characteristics for the split sample and
for the non-split sample. For the split sample, the pre-split stock price, averaged over days –22 to
–3 before the split announcement date, ranges from $10.7 to $389.9, with the mean of $66.8. The
non-split sample also has a wide price range, from $2.9 to $407.2, across the same window, but it
has a much lower mean price of $38.2. According to Weld, Michaely, Thaler, and Benartzi
(2009), the average price for a share of stock on the NYSE has remained roughly constant at
about $35 since the Great Depression. Hence, while the mean price of our non-split firms is close
to the mean price of all NYSE stocks, our split firms on average have a stock price level about
1.9 times as high as the NYSE mean price. Interestingly, the average split factor of our split
firms is 0.87 with which split firms can lower the average stock price from $66.8 to around $35. The sample starts in 1996 because the
coverage of options in OptionMetrics begins that year. Because we use the trend and the
information content of O/S to capture stock undervaluation, we require split firms to be covered
by OptionMetrics and to have options trading volume data available prior to and after the stock
splits. Our final split sample consists of 1,636 splits from 1996 through 2012.
<<TABLE 1 ABOUT HERE>>
6
We exclude stock splits with split factors less than 0.25 and drop all stock dividends to be consistent with prior research (e.g., Ikenberry, Rankine, and Stice (1996) and Ikenberry and Ramnath (2002)).
Consistent with the literature, split firms have an average stock price run-up of about 95%
over the 11-month period from month –12 to day –23 before the split announcement. Non-split
firms also experience moderate price ups during the same time period, with an average
run-up of about 33%. In our hypothesis, the price run-run-up is the key factor that creates portfolio
rebalancing needs for existing shareholders, which lead to selling pressure and stock
undervaluation.
On average, our split firms enjoy 2.8% abnormal returns (i.e., excess returns over the
CRSP value-weighted market index returns) during the five days surrounding the split
announcement date. This magnitude of abnormal returns is similar to those reported by earlier
studies (e.g., Grinblatt, Masulis, and Titman (1984) and Ikenberry, Rankine, and Stice (1996)).
Nevertheless, the split announcement returns vary widely across the sample firms, ranging
from –26% to 68%. Later, we use pre-split O/S, relative trading of options over stock, to help
explain the variation in the announcement returns.
That our sample firms and their matched non-split firms all have listed options suggests
that they tend to be relatively large and have high institutional ownership and analyst coverage.
Indeed, on average, our split (non-split) firms have 21,000 (28,000) common shareholders, 217
(215) institutional investors who own about 73% (65%) of outstanding shares prior to stock splits.
Also, on average, each split (non-split) firm has 10 (9) analysts following it.
Our hypothesis postulates that a firm can better facilitate existing shareholders’ portfolio
rebalancing needs induced by significant price run-ups by conducting a stock split to induce
more information production and to attract new investors to buy shares and share the risk with
number of common shareholders and institutional investors; more important, the results show
that shareholders’ portfolio rebalancing is associated with significant price run-ups.
<<TABLE 2 ABOUT HERE>>
Specifically, following stock splits, the number of analysts covering split firms increases
by 9.5%, on average, which is significantly more than the average increase of 3.9% for the
matched non-split firms. This increase in analyst coverage associated with stock splits is
consistent with the findings by Brennan and Hughes (1991) and Chemmanur, Hu, and Huang
(2014).
Even more significant is the split firms’ average increase of 17.7% in the number of
common shareholders following the splits, compared to the average increase of just 0.5% for
matched non-split firms. The increase in the number of common shareholders of a firm suggests
that the firm’s average percentage shareholding per shareholder decreases. Without knowing the
detailed holding change of each shareholder, we use the decrease in the average percentage
holding per shareholder following a split as a proxy for the extent of the firm’s average
shareholder’s portfolio rebalance from before to after the split. For the split sample, the mean
decrease in the average percentage holding per common shareholder is also 17.7%, which, again,
is significantly larger than the average decrease of 0.5% for the non-split sample. The evidence is
thus consistent with our hypothesis that shareholders have portfolio rebalancing needs after
significant stock price run-ups and that firms use stock splits to attract new investors to facilitate
Among common shareholders, institutional investors tend to have less capital constraints
in holding stocks than retail investors. This fact raises an interesting issue: Are institutional
investors also inclined to rebalance their portfolio after significant price run-ups? Table 2 shows
that, on average, split firms’ institutional investors increase by 13.7% following the split, which
is significantly more than the average increase of 8.1% for the non-split firms. However, the
average percentage holding per institutional investor of split firms decreases by 16.9% following
the splits, which is significantly larger than the decrease of 0.8% for the non-split firms. The
evidence suggests that, like average common shareholders, institutional investors also rebalance
their portfolios after significant stock price run-ups.
Table 3 further reports that for the split sample both decreases in the average percentage
holding per common shareholder and per institutional investor are significantly related to the
pre-split price run-ups. Conversely, for the non-split sample, no clear association exists between
price run-ups and changes in the average percentage holding per common shareholder and per
institutional investor. Thus, the results are consistent with our hypothesis that price run-ups
induce existing shareholders, including institutional investors, to rebalance their portfolios and
that firms use stock splits to attract new investors to offset their selling.
<<TABLE 3 ABOUT HERE>>
4. Price run-ups, turnover, and price momentum
Because stock price run-ups prior to stock splits are substantial and take months to develop, in
this section, we focus on how past price run-ups affect share turnover and stock price behavior in
that if price run-ups induce portfolio rebalancing needs, turnover will be positively related to past
price run-ups. Our hypothesis further posits that if firms cannot attract sufficient buying interests,
existing shareholders’ portfolio rebalancing needs induced by past price run-ups may lead to
undervaluation, which attracts informed buying, causes the price to rise, and may result in a price
momentum in the pre-split period. Hence, this section investigates the effects of past stock price
run-ups on share turnover and stock price behavior in the pre-split period and examines how
stock splits, as a corporate tool, may alter these effects of past price run-ups.
4.1. Price run-ups and turnover
Table 4 reports the results of cross-sectional regressions of average daily turnover in a
month (turnover) on the cumulative stock returns over the past 11 months (Runup), controlling
for firm size, B/M, stock liquidity, analyst coverage, analyst forecast dispersion, and institutional
ownership, for each event month from month –6 to the split announcement month
(announcement month 0) and from the split effective month (ex-distribution month 0) through
month +6 for the split sample in Panel A and for the non-split sample in Panel B.
<<TABLE 4 ABOUT HERE>>
Consistent with Chordia, Huh, and Subrahmanyam’s (2007) finding, Panel A of Table 4
shows that the turnover of split firms is positively related to their past price run-ups. The
coefficients of Runup during the pre-split months are all significantly positive and around 0.004
except one around 0.007 in month –2; the coefficients during the post-split months are also all
argue earlier, the selling pressure associated with shareholders' portfolio rebalancing needs
depends on shareholder attributes, such as when they become shareholders and their propensities
for rebalancing their portfolios. As stock splits attract new investors to become shareholders,
their composite attributes change, which may explain the slight decrease in the coefficients of
Runup in the post-split months, relative to those in the pre-split months.
Alternatively, in Panel C of Table 4, we use a panel regression to test whether the effect
of past stock price run-ups on turnover in the post-split period is significantly weaker than that in
the pre-split period. In the regression, we use data in the pre-split months and in the post-split
months to estimate the effect of Runup on turnover, including Post-split dummy and the
interaction between Runup and Post-split dummy, along with the same control variables as in
Panel A. The results show that Runup has a coefficient of 0.004 (t-value = 5.46) and that the
interaction between Runup and Post-split dummy has a coefficient of –0.002 (t-value = –1.93).
Thus, the panel regression confirms that portfolio rebalancing, as reflected in share turnover,
increases with past stock price run-ups and that portfolio rebalancing induced by past stock price
run-ups are less (at the 10% significance level) in the post-split period than in the pre-split period.
Panel B of Table 4 reports the cross-sectional regression results for the non-split sample.
The coefficients of Runup are also all significantly positive except in months +5 and +6 during
the post-split period, with slightly smaller magnitudes than those of split firms. This finding
suggests that portfolio rebalancing induced by past stock price run-ups is a common
phenomenon and that this phenomenon is somewhat stronger for split firms as they tend to have
4.2. Price run-ups and price momentum
That firms need to split their shares to attract new investors suggests that the firms are
likely unable to attract sufficient buying interests during the pre-split period to balance existing
shareholders’ portfolio rebalancing needs. This implication suggests that the selling pressure
from existing shareholders’ portfolio rebalancing needs in the pre-split period can lead to
significant undervaluation. Consequently, price momentum may be more visible in the pre-split
period than in the post-split period.
Indeed, Panel A of Table 5 reports that split firms’ stock returns from month –5 through
month –1 in the pre-split period are all significantly related to their past stock price run-ups. The
coefficients of Runup during these five pre-split months range from 0.009 (t-value = 2.36) in
month –4 to 0.022 (t-value = 3.54) in month –1, with the mean equal to 0.017. This result
suggests that, holding other things constant, a 100% stock price run-ups leads to a rise of 1.7% in
stock price per month during the five pre-split months. This magnitude of price momentum is
non-trivial, and the evidence of a price momentum is consistent with undervaluation spawned by
the selling pressure from existing shareholders’ portfolio rebalancing needs after substantial
price run-ups. Later, we provide more evidence on the existence of undervaluation in the
pre-split period, using option trading data.
<<TABLE 5 ABOUT HERE>>
Panel B of Table 5 shows that non-split firms’ stock returns during the same five pre-split
ranging from –0.010 (t-value = –1.14) in month –3 to 0.014 (t-value = 1.43) in month –5. This
result suggests that, unlike split firms, non-split firms do not show a price momentum.
Split firms’ price momentum continues in the split announcement month and the split
ex-distribution month. However, during the post-split period, split firms’ stock returns are no longer
significantly related to Runup. Similarly, non-split firms’ stock returns during the post-split
period are not significantly related to Runup. Thus, the split firms’ price momentum during the
pre-split months is unique, and this price momentum disappears after stock splits.
The evidence is consistent with our argument that, unless firms can attract sufficient
buying interests, selling pressure from existing shareholders’ portfolio rebalancing needs induced
by significant price run-ups impedes the market’s price discovery function prior to stock splits.
In addition, by attracting new investors to meet existing shareholders’ portfolio rebalancing
needs, stock splits restore the market’s price discovery function.
5. Undervaluation and O/S
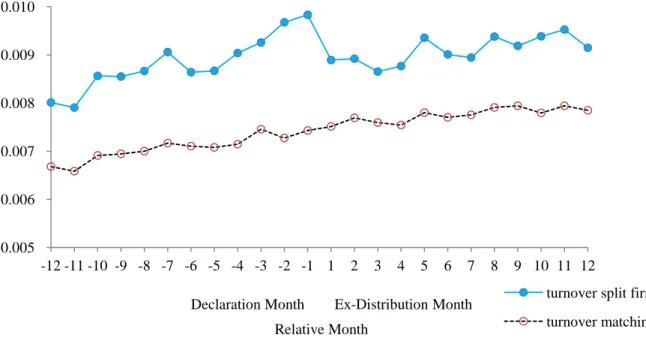
Similar to Lakonishok and Lev’s (1987) observation of unusually high trading volume on
stocks prior to stock splits, Figure 1 illustrates the rise in trading volume on split firms during the
pre-split period. The rise is particularly evident during the five months prior to stock splits,
which is partly attributable to trading by existing shareholders to rebalance their portfolios after
substantial price run-ups. Because the portfolio rebalancing can lead to undervaluation, which
attracts informed traders, informed trading can also contribute in part to the rise in trading
volume during the pre-split months.
5.1. The pre-split trend of O/S
Because listed options are available for all our sample firms (and their matched non-split
firms), listed options should be even more attractive to informed traders if stock undervaluation
develops. To illuminate the relative preference of trading options over the underlying stock, we
follow Roll, Schwartz, and Subrahmanyam (2010) and use O/S, which is the ratio of the total
trading volume of options in the options market to the trading volume of the corresponding
underlying stock in the stock market on a given trading day for each firm.7
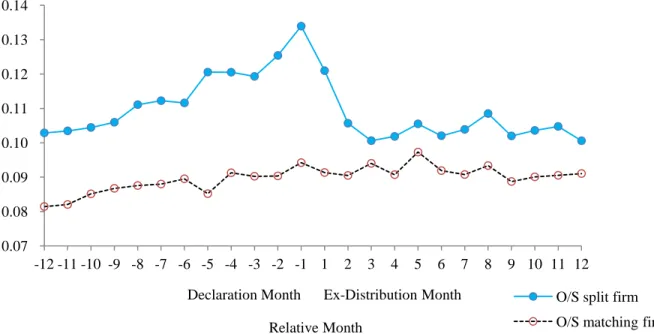
As expected, Figure 2 clearly shows an increasing trend of split firms’ average O/S
during the pre-split period. The increasing O/S trend is also particularly evident during the five
months prior to split announcements. While the comparable non-split firms also exhibit a slightly
upward trend in their average O/S, the pre-split increases in the average O/S of split firms are
much more substantial and visible.
Roll, Schwartz, and
Subrahmanyam (2010) show that O/S is higher around earnings announcements and that O/S
prior to earnings announcements is significantly related to absolute earnings announcement
returns. They thus argue that O/S fairly represents informed trading on listed options, relative to
that on the underlying stock.
<<FIGURE 2 ABOUT HERE>>
Interestingly, Figure 2 shows that the average O/S of split firms declines remarkably over
the three-month period after stock splits and then stabilizes afterward at the level observed
7 Given the fact that each options contract is for 100 shares of the underlying stock, we compute the O/S as the ratio
of total options trading volume multiplied by 100 to stock trading volume. We also adjust trading volume for firms listed on Nasdaq according to Gao and Ritter (2010). We analyze both ShO/S based on daily share volume and $O/S based on daily dollar volume; we find similar results and report those based on ShO/S.
around month –12 before the splits. We do not observe any significant changes in the average
O/S for the non-split firms during the post-split period. As we argue earlier, by attracting more
new investors, stock splits restore the market’s price discovery function. With no more
undervaluation in the post-split period, trading listed options is not as appealing as before stock
splits, which explains the declines in the average O/S of split firms in the post-split period.
In sum, the dynamics of split firms’ average O/S before and after stock splits are
consistent with the pattern of price momentum in the pre-split period and the disappearance of
price momentum in the post-split period reported in Table 5. They all imply the existence of
undervaluation prior to stock splits.
5.2. O/S and price momentum
If undervaluation is the common underlying factor for the O/S trend and for the price
momentum during the pre-split period, the two should be related to each other. To demonstrate
such a relation and to show which one is more informative about undervaluation, we add Ln(O/S),
the natural logarithm of average O/S in month t–1, to the cross-sectional regression model in
Table 5 as an explanatory variable for stock returns in month t. Panels A and B of Table 6 report
the regression results for the split sample and the non-split sample, respectively. Note that we use
the predictability of O/S on future stock returns to illustrate stock undervaluation. It is different
from the predictability of O/S on the absolute values of future stock returns, which essentially
predicts the volatility of future stock returns.
The results in Panel A of Table 6 show that O/S is significantly positive during the
pre-split period. Its coefficient ranges from 0.008 (t-value = 2.61) in month –4 to 0.019 (t-value =
3.84) in month –1. In contrast, Runup, which is significant during the five months prior to stock
splits in Table 5, becomes insignificant during the pre-split period, except for month –3. In
month –3, the coefficient of Runup declines from 0.021 value = 2.87) in Table 5 to 0.013
(t-value = 2.06) in Table 6. The results suggest that split firms’ Runup and O/S contain some
common information about their future stock returns and that the latter has stronger predictive
power on their future stock returns than the former. This evidence is consistent with the notion
that informed traders are more inclined to use listed options than the underlying stock to take
advantage of stock undervaluation, causing O/S to have stronger predictive power on future
stock returns than Runup. Furthermore, Runup is likely a noisy proxy for the extent of existing
shareholders’ portfolio rebalancing needs induced by price run-ups because the composition of
shareholders changes as trades occur.
The predictive power of split firms’ O/S on future stock returns also prevails in the split
announcement month, with a coefficient of 0.017 (t-value = 4.57). However, the predictive
power of split firms’ O/S on future stock returns becomes insignificant in the post-split period,
except for months +2 and +4 in which the coefficients of O/S are significantly negative, unlike
those in the pre-split period. Similarly, Panel B of Table 6 shows that, unlike split firms’ O/S in
the pre-split period, non-split firms’ O/S does not have consistent predictive power on future
stock returns either in the pre-split or the post-split period.
Thus, the predictive power of O/S in the pre-split period and in the split announcement
month confirms that stock undervaluation exists prior to stock splits and that informed traders
the post-split period implies that firms are able to use stock splits to attract more investors and
resolve the undervaluation problem. Consequently, following stock splits, the appeal of trading
on options declines, and it becomes more difficult to predict future stock returns.
To reiterate, the finding that stock returns in the pre-split period are predictable using the
previous month’s O/S implies that split firms’ stock prices do not efficiently impound the
information content of the previous month’s options trading volume relative to the stock’s
trading volume. This result is consistent with our earlier argument that the market does not
function well in price discovery in the pre-split period and that stock splits improve this function
of the market. That is, by attracting more new investors to offset the selling pressure from
existing shareholders who are rebalancing their portfolios after significant price run-ups, stock
splits, as a corporate tool, improve market efficiency.
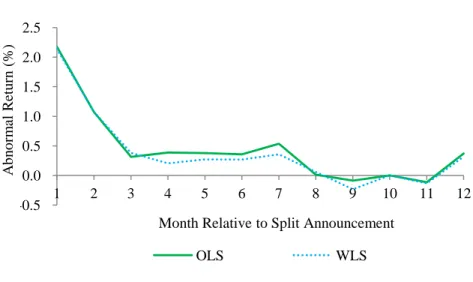
To further demonstrate that the market is less efficient before stock splits, Table 7 reports
the results of using O/S, averaging over days –22 to –3 relative to the earnings announcement
date, to predict earnings announcement returns in the quarter before and the quarter after stock
splits.8
8 We measure earnings announcement returns as the five-day (–2,+2) abnormal returns, using the CRSP
value-weighted index returns over the same five-day period as the benchmark. Following Denis and Sarin (2001), we control for firm size, B/M, the standardized changes in earnings, and accruals in earnings announcement return regression. The change in earnings in each quarter t is measured as the difference between earnings in quarter t and earnings in quarter t–4, expressed as a percentage of the market value of the firm.
The results show that O/S can predict upcoming earnings announcement returns prior to
stock splits, suggesting that informed investors tend to increase their trading of listed options the
more that the market underprices the firms’ earnings potentials. However, the predictive power
of O/S on earnings announcement returns disappears after stock splits. This evidence is
consistent with our hypothesis that, weighed down by the selling pressure from existing
shareholders’ portfolio rebalancing needs, the stocks are undervalued prior to stock splits, which
After stock splits, the equity market becomes more efficient as more new investors are attracted
to meet existing shareholders’ portfolio rebalancing needs, and listed options become less
appealing.
<<TABLE 7 ABOUT HERE>>
Roll, Schwartz, and Subrahmanyam (2010) suggest that O/S is informative about the
absolute values of earnings announcement returns. In this case, instead of underpricing the firms’
earnings potentials, the market is uncertain about the outcomes of the upcoming earnings
announcements, and such uncertainty provides room for informed investors to use options to
exploit their information advantage. Because uncertainty about the outcomes of the upcoming
earnings announcements would exist even if the market becomes more efficient, we expect that
the predictability of O/S on the absolute values of earnings announcement returns will not be
affected by stock splits. Indeed, consistent with Roll, Schwartz, and Subrahmanyam, Table 7
reports that O/S has such predictive power in both the quarter before and the quarter after stock
splits. Thus, while stock splits improve market efficiency and take away the usefulness of O/S in
predicting earnings announcement returns, they do not alter the predictability of O/S on the
absolute values of earnings announcement returns, as reported by Roll, Schwartz, and
Subrahmanyam (2010).
5.3. The split announcement returns and O/S
How much stock undervaluation exists prior to stock splits? Because our hypothesis
shareholders’ portfolio rebalancing needs, firms can resolve the undervaluation problem, the split
announcement returns are a good measure of the extent of stock undervaluation prior to stock
splits. As shown in Table 1, the average split announcement return is 2.8%, suggesting that, on
average, pre-split undervaluation is about 2.8% of firm value in our sample firms.
Table 8 reports the results of regressing the five-day split announcement returns on
pre-split O/S, the natural logarithm of average O/S over days –22 to –3, and a set of control variables,
including firm size, B/M, pre-split price run-up, pre-split stock price level, the split factor, and
changes in stock liquidity.9 The regression results show that the O/S is significant, with a
coefficient ranging from 0.004 (t-value = 2.78) to 0.006 (t-value = 3.50) in various specifications.
The finding suggests that pre-split O/S is informative about the extent of pre-split undervaluation:
The higher the undervaluation, the more the informed traders use listed options. To recoup the
undervaluation, firms use stock splits, and their stock prices go up on the split announcement.
<<TABLE 8 ABOUT HERE>>
The association between the split announcement returns and pre-split O/S has two
implications. First, it strengthens our argument that the rise in pre-split O/S reflects more
informed trading in the options over the stocks. Second, split firms with more pre-split O/S
benefit more from announcing a stock split.
Our finding that informed traders know in advance about stock undervaluation prior to
split announcements casts doubt on the validity of the signaling hypothesis that managers use
stock splits to signal their firms’ future prospects. Rather, the evidence is consistent with our
9
Lin, Singh, and Yu (2009) suggest that part of the split announcement return reflects anticipated improvement in stock liquidity following stock splits. Hence, we use three proxies—change in turnover, change in Amihud’s (2002) illiquidity, and change in Liu’s (2006) LM—for change in stock liquidity to control for its valuation effect.
hypothesis that shareholders’ portfolio rebalancing needs induced by significant stock price
run-ups have a negative valuation effect if the firm cannot attract sufficient buying interests and that
the firm overcome the negative valuation effect by using a stock split to attract new investors to
offset the selling pressure from shareholders.
6. Conclusion
Chordia, Huh, and Subrahmanyam (2007) note that stock price changes naturally lead to
investors’ portfolio rebalancing needs. Motivated by their study, we consider the possibility that
a firm may experience “growing pains” when its stock price has grown substantially but its
investor base has not changed much. The substantial rise in equity value makes the firm
overweight in its shareholders’ portfolios, causing them to face unnecessary firm-specific risk
and creating portfolio rebalancing needs.
To rebalance their portfolios, shareholders must sell part of their holdings on the firm.
Even though they may not sell at the same time, selling pressure builds. Thus, we hypothesize
that if the firm cannot attract sufficient buying interests, selling pressure from existing
shareholders’ portfolio rebalancing needs induced by substantial price run-ups leads to stock
undervaluation. The firm can resolve the undervaluation problem by splitting its shares to attract
new investors to better facilitate its existing shareholders’ portfolio rebalancing needs.
Indeed, we find evidence that common shareholders, including institutional investors,
balance their portfolios following stock splits. The extent of their portfolio rebalancing, as
proxied by the decrease in the average percentage holding per shareholder or per institutional
rebalancing needs increasing with past price run-ups is that share turnover in the months
surrounding stock splits is significantly and positively related to past price run-ups.
Furthermore, stock returns are also positively related to past price run-ups, creating a
price momentum, in the five months prior to stock splits. The price momentum largely
disappears in the post-split period. The evidence is consistent with our hypothesis that selling
pressure from shareholders’ portfolio rebalancing needs leads to stock undervaluation and that,
by attracting more new investors to offset the selling pressure, stock splits recoup the
undervaluation and make the market more efficient.
Because stock undervaluation makes listed options more appealing to informed traders,
we find that O/S, the relative trading of options over stock, increases visibly in the pre-split
period, particularly in the five months prior to split announcements. Moreover, the predictive
power of O/S on future stock returns is able to subsume the price momentum effect in the
pre-split period, suggesting that the price momentum and the increasing appeal of listed options have
a common underlying factor in stock undervaluation.
The split announcement returns are also significantly related to pre-split O/S. However,
after stock splits, as the market becomes more efficient, O/S declines and has no more predictive
power on future returns.
Overall, we find compelling evidence that informed traders exploit stock undervaluation
in the pre-split period and that stock splits are able to resolve the undervaluation problem. The
evidence is more consistent with our hypothesis of portfolio rebalancing needs induced by
significant price run-ups than the other theories, such as signaling and optimal trading range,
proposed in the extant literature.
References
Admati, Anat R., and Paul Pfleiderer, 1988, A theory of intraday patterns: Volume and price variability, Review of Financial Studies 1, 3-40.
Amihud, Yakov, 2002, Illiquidity and stock returns: Cross-section and time-series effects, Journal of Financial Markets 5, 31-56.
Amihud, Yakov, Haim Mendelson, and Jun Uno, 1999, Number of shareholders and stock prices: Evidence from Japan, Journal of Finance 54, 1169-1184.
Asquith, Paul, Paul Healy, and Krishna Palepu, 1989, Earnings and stock splits, Accounting Review 54, 387-403.
Back, Kerry, 1993, Asymmetric information and options, Review of Financial Studies 6, 435-472. Baker, H. Kent, and Patricia L. Gallagher, 1980, Management’s view of stock splits, Financial
Management 9, 73-77.
Baker, H. Kent, and Gary E. Powell, 1993, Further evidence on managerial motives for stock splits, Quarterly Journal of Business and Economics 32, 20-31.
Baker, Malcolm, Robin Greenwood, and Jeffrey Wurgler, 2009, Catering through nominal share prices, Journal of Finance 64, 2559-2590.
Brennan, Michael J., and Thomas E. Copeland, 1988, Stock splits, stock prices, and transaction costs, Journal of Financial Economics 22, 83-101.
Brennan, Michael J., and Patricia J. Hughes, 1991, Stock prices and the supply of information, Journal of Finance 46, 1665-1691.
Cao, Charles, Zhiwu Chen, and John M Griffin, 2005, Informational content of option volume prior to takeovers, Journal of Business 78, 1073-1109.
Chan, Konan, Li Ge, and Tse-Chun Lin, 2014, Informational content of options trading on acquirer announcement return, Journal of Financial and Quantitative Analysis, forthcoming.
Chemmanur, Thomas J., Gang Hu, and Jiekun Huang, 2014, Institutional investors and the information production theory of stock splits, Journal of Financial and Quantitative Analysis, forthcoming.
Chordia, Tarun, Sahn-Wook Huh, and Avanidhar Subrahmanyam, 2007, The cross-section of expected trading activity, Review of Financial Studies 20, 709-740.
Conroy, Robert, Robert Harris, and Bruce Benet, 1990, The effects of stock splits on bid–ask spreads, Journal of Finance 45, 1285-1295.
Copeland, Thomas E., 1979, Liquidity changes following stock splits, Journal of Finance 34, 115-141.
Denis, David J., and Atulya Sarin, 2001, Is the market surprised by poor earnings realizations following seasoned equity offerings? Journal of Financial and Quantitative Analysis 36, 169-193.
Dolley, James C. 1933, Common stock split-ups, motives and effects, Harvard Business Review 12, 70-81.
Easley, David, Maureen O’Hara, and Gideon Saar, 2001, How stock splits affect trading: A microstructure approach, Journal of Financial and Quantitative Analysis 36, 25-51. Fama, Eugene F., and Kenneth R. French, 2008, Dissecting anomalies, Journal of Finance 63,
1653-1678.
Fernando, Chitru S., Srinivasan Krishnamurthy, and Paul A. Spindt, 1999, Is share price related to marketability? Evidence from mutual fund share splits, Financial Management 28, 54-67.
Gao, Xiaohui, and Jay R. Ritter, 2010, The marketing of seasoned equity offerings, Journal of Financial Economics 97, 33-52.
Gray, Stephen, Tom Smith, and Robert E. Whaley, 2003, Stock splits: Implications for investor trading costs, Journal of Empirical Finance 10, 271-303.
Grinblatt, Mark S., Ronald W. Masulis, and Sheridan Titman, 1984, The valuation effects of stock splits and stock dividends, Journal of Financial Economics 13, 461-490.
Ikenberry, David L., and Sundaresh Ramnath, 2002, Underreaction to self-selected news events: The case of stock splits, Review of Financial Studies 15, 489-526.
Ikenberry, David L., Graeme Rankine, and Earl K. Stice, 1996, What do stock splits really signal? Journal of Financial and Quantitative Analysis 31, 357-375.
Jegadeesh, Narasimhan, and Sheridan Titman, 1993, Returns to buying winners and selling losers: Implications for stock market efficienty, Journal of Finance 48, 65-91.
Kyle, Albert S., 1985, Continuous auctions and insider trading, Econometrica 53, 1315-1336. Lakonishok, Josef and Baruch Lev, 1987, Stock splits and stock dividends: Why, who, and when,
Journal of Finance 42, 913-932.
Lin, Ji-Chai, Ajai K. Singh, and Wen Yu, 2009, Stock splits, trading continuity, and the cost of equity capital, Journal of Financial Economics 93, 474-489.
Liu, Weimin, 2006, A liquidity-augmented capital asset pricing model, Journal of Financial Economics 82, 631-671.
McNichols, Maureen, and Ajay Dravid, 1990, Stock dividends, stock splits, and signaling, Journal of Finance 45, 857-879.
Pan, Jun, and Allen Poteshman, 2006, The information in options volume for future stock prices, Review of Financial Studies 19, 871-908.
Roll, Richard, Eduardo Schwartz, and Avanidhar Subrahmanyam, 2010, O/S: The relative trading activity in options and stock, Journal of Financial Economics 96, 1-17.
Schultz, Paul H., 2000, Stock splits, tick size and sponsorship, Journal of Finance 55, 429-450. Weld, William C., Roni Michaely, Richard H. Thaler, and Shlomo Benartzi, 2009, The nominal
share price puzzle, Journal of Economic Perspectives 23, 121-142.
White, Halbert, 1980, Heteroskedasticity-consistent covariance matrix and a direct test for heteroskedasticity, Econometrica 48, 817-838.
Table 1 Summary Statistics
This table reports summary statistics of firm characteristics for split firms (Panel A) and matched non-split firms (Panel B). We consider all stock split announcements from the CRSP with a split factor of at least 0.25 during 1996 to 2012 and require split firms to be covered by OptionMetrics and have common shares (CRSP share code 10 or 11). Matched non-split firms are matched by size and book-to-market ratio (B/M) and have no stock split in a two-year window centered around the split announcement. Price is the average stock price from day –22 to –3 relative to the split announcement date. Ln(price) is the natural logarithm of Price. Size is the natural logarithm of pre-split market capitalization in millions measured at day –23. B/M is the pre-split book-to-market ratio from Compustat.
Runup is the pre-split 11-month cumulative stock return from month –12 to day –23 before splits. Age is the number
of years that the firm exists in the CRSP. Common shareholders is the number of common shareholders at previous year end (in thousands). Institutional investors is the number of institutional investors in the previous three months.
Percentage holding is average percentage holding of institutional investors in the three months prior to split. Institutional ownership is a firm’s shares held by institutions from Thomson Reuters scaled by shares outstanding
from the CRSP. Analyst is the number of I/B/E/S analysts who provide one-year earnings forecasts in the previous three months. Analyst dispersion is the standard deviation across earnings forecasts in previous three months. ShO/S is the average ratio of total options trading volume to the corresponding stock trading volume. $O/S is the average ratio of dollar options trading volume to the corresponding dollar stock trading volume, expressed in percentage.
Ln(ShO/S)and Ln($O/S)are natural logarithms of ShO/S and $O/S, respectively. Implied volatility is from
OptionMetrics, which is calculated with American or European models (as appropriate). Delta is the delta of the option, which indicates the change in option premium for a $1.00 change in underlying price. Spread is the average bid-ask spread divided by the midpoint of all options traded. For each day, a firm’s average Spread, Implied
volatility and Delta (put deltas are reversed in sign) are value-weighted based on options trading volume. ShO/S, $O/S, Spread, Implied volatility, and Delta are based on the average values from day –22 to –3 relative to the split
announcement date. CAR is (–2,+2) five-day abnormal returns around the split announcement date, with the CRSP value-weighted index returns as the benchmark. N is the number of observations.
Mean Median Q1 Q3 Std Min Max N
Panel A: split firms
Price 66.791 59.953 42.969 83.793 33.580 10.697 389.872 1,636 Ln(price) 4.091 4.094 3.760 4.428 0.469 2.370 5.966 1,636 Size 8.059 7.905 7.088 8.830 1.322 5.125 12.990 1,636 B/M 0.318 0.268 0.156 0.430 0.261 –1.581 3.701 1,621 Runup 0.954 0.540 0.289 0.992 1.635 –0.430 34.657 1,636 Age 19 14 7 26 17 1 88 1,636 Common shareholders 21 3 1 11 90 0.001 1,764 1,560 Institutional investors 217 167 107 261 175 3 1,385 1,636 Percentage holding 0.005 0.004 0.002 0.006 0.003 0.0004 0.048 1,629 Institutional ownership 0.730 0.757 0.590 0.896 0.206 0.025 1.000 1,636 Analyst 10 8 5 13 7 0 40 1,636 Analyst dispersion 0.082 0.037 0.014 0.086 0.207 0.000 6.560 1,595 ShO/S 0.133 0.086 0.038 0.178 0.142 0.00004 1.133 1,636 Ln(ShO/S) –2.602 –2.457 –3.280 –1.726 1.243 –10.070 0.125 1,636 $O/S (%) 0.965 0.584 0.232 1.247 1.160 0.003 9.950 1,636 Ln($O/S) –5.267 –5.143 –6.064 –4.384 1.217 –10.278 –2.308 1,636 Implied volatility 0.458 0.399 0.306 0.556 0.211 0.132 1.450 1,630 Delta 0.464 0.457 0.417 0.503 0.072 0.132 0.974 1,630 Spread 0.204 0.171 0.132 0.227 0.150 0.031 2.000 1,636 Split factor 0.872 1.000 0.500 1.000 0.358 0.250 3.000 1,636 CAR 0.028 0.019 –0.010 0.058 0.078 –0.261 0.682 1,636 Table 1 continues
Table 1 (continued)
Panel B: Matched non-split firms
Mean Median Q1 Q3 Std Min Max N
Price 38.165 34.285 22.599 49.156 24.791 2.903 407.246 1,636 Ln(price) 3.476 3.535 3.118 3.895 0.591 1.066 6.009 1,636 Size 8.001 7.880 7.076 8.797 1.238 5.160 12.517 1,636 B/M 0.320 0.269 0.156 0.431 0.252 –0.390 3.831 1,621 Runup 0.325 0.169 –0.053 0.416 1.074 –0.892 24.431 1,636 Age 22 15 7 31 20 2 88 1,636 Common shareholders 28 5 1 20 121 0.002 3,367 1,574 Institutional investors 215 169 103 280 168 1 1,116 1,635 Percentage holding 0.004 0.004 0.002 0.005 0.002 0.0003 0.021 1,631 Institutional ownership 0.647 0.680 0.493 0.818 0.227 0.001 1.000 1,635 Analyst 9 8 5 13 6 0 39 1,636 Analyst dispersion 0.122 0.061 0.024 0.134 0.229 0.000 3.342 1,512 ShO/S 0.095 0.055 0.021 0.126 0.130 0.0001 2.694 1,636 Ln(ShO/S) –3.052 –2.897 –3.855 –2.069 1.317 –9.259 0.991 1,636 $O/S (%) 0.805 0.390 0.149 0.963 1.388 0.003 28.626 1,636 Ln($O/S) –5.606 –5.548 –6.511 –4.643 1.321 –10.317 –1.251 1,636 Implied volatility 0.442 0.393 0.296 0.533 0.208 0.065 1.483 1,621 Delta 0.459 0.453 0.415 0.496 0.071 0.080 0.965 1,621 Spread 0.253 0.221 0.168 0.294 0.149 0.049 2.000 1,636