1 Introduction
The purpose of this paper is to empirically investigate whether the Asian crisis has changed the determinants of cross-border mergers and acquisitions among financial institutions in ten Asian countries. To date, the literature on international banking has mainly considered three types of operations abroad: loan provision and asset and liability management with foreign counterparts, foreign branching and the acquisition of shareholdings in foreign banks.1 We collect annual data on the number of M&As involving financial institutions in Asian countries from 1990 to 2006. Although the use of long-span data allows us to have enough data to cover two periods, pre- and post-crisis, regrettably this comes at the expense of some individual bank information.
Our study belongs to the “from-many-to-many” category in the field of multinational enterprises, which means that acquirers are from many countries and their targets are in many countries. In this regard, Clarke et al. (2001) have explained that “from-many-to-many” studies are probably fewer in number because of difficulties associated with data collection.
To the best of our knowledge, this is the first study to explore the impact of the Asian crisis on the determinants of cross-border M&A activity among financial institutions. In this line of research, most of the relevant literature has focused on OECD countries (Fecher et al., 2004, Focarelli and Pozzolo, 2000, 2001 and 2002), European country (Campa et al., 2006, Altunbas, 2004), high-income countries (Portes and Rey, 2001) and on the U.S. and four European countries (Vasconcellos and Kish, 1998). Two exceptions are the works of Buch and DeLong (2001) and Giovanni (2002) who use some 150 countries in their sample, but their studies neither cover the period of the Asian crisis, nor do they take similar crises, such as the European currency crisis and the Tequila crisis, into account. Because the Asian crisis significantly changed the attitude of governments towards M&As , it is expected that the present study which focuses on Asian countries and the Asian crisis should complement existing studies considerably.
Some parallels can be drawn between our paper and others in the field of location choice, the study of the determinants of choosing a city to set up subsidiaries, branches, representative offices and agents by foreign banks. Brealey and Kaplanis (1996), for example, used the location of the overseas offices of 1,000 of the world's largest banks to examine the determinants of foreign bank location. Shen and Chou (2007) recently study the determinants of foreign banks' choice of Asian cities to establish new branch offices, and they point to a significant relationship between the choice of bank location, foreign trade and foreign direct investment. Our paper,
1 This paper focuses on the third type and uses the terms cross-border M&As and foreign direct
however, differs from those studies in that it focuses on cross-border consolidation rather than the establishment of foreign offices, though all three of these papers belong to the field of FDI in banking.
There are very few theories about cross-border M&As among financial institutions, which explains the rationale behind the fact that most current empirical studies borrow theories from international trade. And, this paper is not an exception. We explore whether or not the following five existing hypotheses affect cross-border M&A activity in Asian countries. They are the gravity hypothesis, following the client
hypothesis, market opportunity hypothesis, information cost hypothesis and the regulation barrier hypothesis. These five hypotheses are explained in detail in the
following section.
2 Econometric model
We therefore employ the Poisson regression model given our dependent variable is countable numbers. That is,
Nij =exp(α +β1XD+β2X(1−D)+εij) (1) where i and j denote the home i and host country j, respectively, thus, Nij is the
number of M&As, between home country i and host country j, D is the dummy variable of the Asian crisis, which is equal to unity before the crisis and zero after it
X is the vector of the explanatory variables, β1 and β2 are the corresponding
coefficients of the explanatory variables before and after the crisis, respectively, and ε represents errors .
3 Data Description and Basic Statistics
Our selection of M&A data is based on the following simple rules. First, all targets and acquirers in the financial industry from Asian countries are included. Furthermore, to examine the robustness, all acquirers from G7 countries are all included. Next, the announcement day of M&As is used instead of the day of the transaction complete. This is simply because the former is available consistently but the later is often lacking the complete day is uneasy to define. Third, our financial institutions including banks, security houses, insurances, mutual funds and so on, which help us to know the impact of the crisis on the financial industry. Fourth, the sample period covers January 1, 1990 to December 31, 2006.
We next describe our basic statistics.
Table 1 reports the number of M&As before (1990-1997) and after (1999-2006) the crisis. Five particularly interesting results emerge. First, the number of M&As is much higher after the crisis than before it. For example, for Singapore, the number
before and after the crisis is 72 and 165, respectively; for Malaysia, 51 and 92, respectively; and for Hong Kong, 42 and 86, respectively. Therefore, Singapore, Malaysia and Hong Kong are the three most active acquirers in the post crisis period. Furthermore, in terms of the percentage, the acquiring rate of Singapore is the highest up to 6%. The higher number after the crisis is probably because the policy of openness towards the financial consolidation after the crisis. It is nevertheless, difficult for the present paper to examine the effect of policy on the consolidation. See Appendix for the policy of openness.
Secondly, as it has the highest number of 34 and 41 in targets before and after the crisis, financial institutions in Hong Kong are the most likely targets for consolidation. Indonesia has the second largest number of targeted financial institutions.
Thirdly, Japan shows the most asymmetric patterns as a target and an acquirer. It acquires 100 foreign banks but there are only 10 Japanese financial institutions are acquired in all sample periods. This asymmetric attitude that Japanese financial institutions can buy foreign banks but foreigners are not welcome to buy Japanese financial institutions is worth future study. Opposite asymmetric case can be found in Thailand. That is, 75 financial institutions from Thailand are the targets but only 15 are acquirers.
Fourthly, during both periods, in India, M&A activity is almost non-existent, while in Indonesia and Thailand, it is negligible. Furthermore, though few targets and acquirers are found in Taiwan, there is a moderate increase in the number of acquirers after the crisis. Finally and somewhat bewildering, the number of M&As in Malaysia is relatively high.
4 Empirical Results
We first discuss the estimated results that pertain to the gravity hypothesis. The coefficients of DISTANCE are overwhelmingly significantly negative regardless of specification. For example, in the first column, they are -0.62 and -0.61 before and after the Asian crisis, respectively; hence, the gravity hypothesis gains momentum and support here.
This likely reflects the commonly-held notion that the greater the distance is, the higher the transaction cost is; if so, and then this conceivably reduces the likelihood of firms engaging in trans-national M&A activity. This result is similar to that of Buch and Delong (2001). While this result is consistent with our earlier conjecture, in our case, it goes against our judgment because, as mentioned earlier, financial assets are mostly intangible and transportation cost should not be of concern. One alternative explanation might be that distance is a proxy for the information asymmetry. When two countries are in close proximity, the extent of information asymmetry is
substantially reduced, thus encouraging M&A activity.
The coefficients of GDP are mostly significantly negative both before and after the Asian crisis, compelling us to discount the gravity hypothesis in this case. The negative impact, however, is counter-intuitive since GDP is the proxy for the mass in the gravity theory and the mass attracts investors. One plausible explanation, nevertheless, is that a large GDP is typically different from GDP per capita, where the former is the proxy for the gravity hypothesis but the latter is related to the wealth of people. That is, countries with a high GDP do not necessarily attract more investors if the people in those countries are poor (i.e., GDP per capita is low). For example, there are many M&As in Singapore, but in the region, its GDP ranks second from the bottom. By way of comparison, not many M&As take place in Japan, but in the region, its GDP is the highest. The implication here could be that a lower GDP may be associated with greater M&A activity and vice versa.
The coefficients of TRADE are also overwhelmingly significantly positive, lending support to the following the client hypothesis. For example, in the first column, the coefficients are 0.32 and 0.35 in the pre- and post-crisis periods, respectively, which is a strong indication that greater trade between two countries increases the tendency for their financial institutions to merge. This is similar to the situation in India and the Philippines. They have the lowest TRADE, and interestingly enough, they also have the fewest M&As . The situation in Singapore and Japan is just the reverse. The following the client effect is stronger after the crisis when TRADE is used.
The coefficients of STOCKRET are insignificant for most specifications, except for one which is significantly negative before the Asian crisis. Thus, high stock cost view exists weakly. With the results of GDPGROW and STOCKRET taken together, Asian crisis strengthens the motivation of the market opportunity hypothesis, thought the effect is weak. We also use GROWTH and STOCKRET at time t+2 to proxy the expectations about future economic and stock market conditions, but the results do not change qualitatively. See results in the section of robust testing.
The coefficients of LANGUAGE, while are all positive, are dramatically different for different sample periods in the statistical sense. Before the crisis, however, only two of four are significant but overwhelmingly significant after it. Furthermore, the coefficients are much larger after the crisis than before it. Accordingly, the problems caused by information cost are more severe after the crisis because M&A activity is more likely to go on in those countries where the same language is spoken. Before the crisis, even when two firms share common language does not help M&A activity. However, these results may not be surprising given that, in our sample, most M&As take place in Hong Kong and Singapore, where English is the officially shared
language.2
The impact of RELIGION on M&A activity is similar to those of LANGUAGE. Before the crisis, only two of four are significant though all of the coefficients are positive. After the crisis, all of the coefficients are overwhelmingly significantly positive. It can be surmised that before the Asian crisis, it did not help firms consolidate if they come from countries that share the same religion but that after the crisis, it certainly did.
The crisis evidently changed the impact of corruption on M&A activity. For both periods, the coefficients of ΔKKZ_CORRUP are overwhelmingly positive, but only those before the crisis are significant. Readers are reminded that the gap index is the difference between the corruption index of acquirers and that of targets. Hence, a significant coefficient means that there is a larger gap in the corruption index between two countries and that this does indeed encourage firms to engage in M&A activity. That is, before the crisis, financial institutions in countries with low corruption are more likely to acquire financial institutions in countries with high corruption. After the crisis, this corruption gap has no influence on firms' willingness to take advantage of M&A opportunities.
The crisis evidently did not change the impact of rule of law as the coefficients of ΔKKZ_RULELAW are all insignificant in both periods.
The effect of ΔKKZ_REGQUAL is interesting from two perspectives. First, those coefficients that are significant are all negative. Second, the coefficients are about equal in size before and after the crisis. A negative coefficient means that firms in countries with efficient regulation quality are less interested in buying those in countries with poor regulation quality. Combining the results here with those obtained from corruption, we can conclude that countries with little corruption but less regulation quality tend to be the impetus for firms to expand to merger firms in the greater corruption but more regulation quality. ΔKKZ_GOVEFF has no effect on M&A activity as almost none of the coefficients are significant in both periods.
Table 4 repeats the estimation procedure as those of Table 4, but we consider three hypotheses simultaneously. As most of the results are similar, we skip the discussion here.
The coefficients of ΔRESTRCIT_S are all insignificantly positive before the crisis and insignificant after the crisis for seven of the ten specifications. Therefore, before the crisis, financial institutions in countries that allow banks to engage in securities tend not to form partnerships with those in countries which do not allow banks to engage in that industry. Similarly put consolidation is less frequent when the target country has relatively stiffened restrictions on banking activities. After the crisis,
restrictions on banking activities do not affect cross-border M&A activity.
The coefficients of ΔRESTRICT_I are overwhelmingly significantly negative for both periods, which indicate that financial institutions from less restrictive countries in insurance have a higher propensity to engage in M&A activity than those from more restrictive countries. Because the coefficients in the two periods are similar, the crisis must not have affected this pattern.
5 Conclusions
We study the motivation that drives financial institutions to engage in cross-border M&A activity in Asian countries prior to and subsequent to the Asian crisis. In other words, we delve into the impact of the Asian crisis on the determinants of cross-border M&As in Asian countries. Before discussing the conclusions, one caveat should be pointed out. While we posit five hypotheses, their multiple proxies may yield mixed results. Furthermore, some proxies may belong to more than one hypothesis. Thus, it is uneasy to decisively reject or non-reject the hypotheses by simply examining the significance of proxies (which are also referred to as determinants here). One way to overcome this shortcoming is to discuss more on the influence of each determinant and less about whether each hypothesis is supported or rejected. The conclusion can be highlighted in the following.
First, some determinants have an equal impact on M&A activity before and after the Asian crisis. For example, DISTANCE has a negative impact in both periods, which supports the gravity hypothesis and information cost hypothesis. GDP also has a negative impact during both periods, contrary to the gravity hypothesis in this case. The following the client hypothesis is supported for both periods too, but only when TRADE is employed as the proxy. When the regulatory gap is relatively narrow between two countries in terms of the number of restrictions on the banking industry engaging in insurance, then firms seem to be encouraged to partake in cross-border M&A activity. By contrast, when the regulatory gap is relatively wide between two countries in terms of restrictions on non-financial activities, it encourages firms to engage in M&A activity.
Third, some determinants are only effective after the Asian crisis. For example, sharing a common language and being of the same religious faith become more and more important in determining the extent of M&A activity after the crisis. That is, the
information cost hypothesis based on these two determinants gains momentum after
the crisis. Last, some determinants seem to have no affected whatsoever in both periods. For example, future stock return does not have any impact in our sample.
Altunbas, Y., and D. Marques (2004), Mergers and acquisitions and bank performance in Europe: the role of strategic similarities, Working Paper.
Brealey, R. and E. Kaplanis (1996), The determination of foreign banking location.
Journal of Internatioal Money and Finance, 15(4), 577—597.
Buch, C. M. and G. L. Delong (2004), Cross-border bank mergers: what lures the rare animal? Journal of Banking and Finance, 28, 2077—2102.
Campa, Jose M. and I. Hernando, (2006). The reaction by industry insiders to M&As in the European financial industry, IESE Research Papers D/689, IESE Business School.
Chen, S. W. and C. H. Shen (2005), When wall street conflicts with main street-the divergent movements of Taiwan's leading indicators. International Journal of
Forecasting, 22, 317—339.
Clarke, G., R. Cull, M. Peria and S. Sanchez (2001), Foreign bank entry: experience, implications for developing countries, and agenda for future research. World Bank
Policy Research Paper, 2698.
Dunning, J. (1998), Location and the multinational enterprise: A neglected factor?
Journal of International Business Studies, 19: 45-66.
Fecher, F. and P. Pestieau, (1993), Efficiency and competition in O.E.C.D. financial services, in (Fried, Harold O., C. A. Knox Lovell and Shelton S. Schmidt, ed.),
The measurement of productive efficiency: Techniques and applications, Oxford
University Press, New York, pp 374-385.
Focarelli, D. and A. F. Pozzolo (2000), The determinants of cross-border bank shareholdings: an analysis with bank-level data from OECD countries, Bank of
Italy, Working Paper, 9/03.
Focarelli, D. and A. F. Pozzolo (2001), The patterns of cross-boarder bank mergers and shareholdings in OECD countries. Journal of Banking and Finance, 25, 2305—2337.
Focarelli, D. and A. F. Pozzolo (2003), Where do banks expand abroad? An empirical analysis. Banca d'Italia, Working Paper, 9/03.
Galindo, A., A. Micco, and C. Sierra (2002), Better the devil that you know : Evidence on entry costs faced by foreign banks, IADV working paper 477.
Giovanni, J. (2002), What drives capital flows? The case of cross-border M&A activity and financial deepening. eScholarship Repository, University of California.
Kaminski, G. and C. M. Reinhard (2001), Bank lending and contagion: Evidence from the Asian crisis. In T.Ito and A. Krueger, eds. Regional and Global Capital Flows: Macroeconomic Causes and Consequences.Chicago:University of Chicago Press for the NBER.
Kim, W., and S.-J. Wei, 1999, Foreign portfolio investors before and during a crisis, NBER WP 6968.
La Porta, R., F. Lopez-de-Silanes, A.Shleifer, and R. Vishny (1997), Legal determinants of external finance. Journal of Finance, 52, 1131—1150.
La Porta, R., F. Lopez-de-Silanes, A.Shleifer, and R. Vishny (1998), Law and finance.
Journal of Political Economy, 106, 1113—1155.
Megginson, W. (2005), The economics of bank privatization. Journal of Banking and
Finance, 29, 1931—1980.
Portes, R. and H. Rey (2001), The determinants of cross-border equity flows. NBER. Rossi, S. and P. F. Volpin (2004), Cross-country determinants of mergers and
acquisitions. Journal of Financial Economics, 74, 277—304.
Sabi, M., (1988), An application of the theory of foreign direct investment to multinational banking in LDCs, Journal of International Business Studies, 433-447.
Shen, C. H. and H. L. Chih (2005), Investor protection, prospect theory, and earnings management: An international comparison of the banking industry. Journal of
Banking and Finance, 29, 2675—2697.
Shen, C. H. and Y. H. Chang (2006), Do regulations affect banking performance? government governance may matter. Contemporary Economic Policy, 24 (1), 92—105.
Shen, C. H. and H. H. Chou (2007), Foreign Banks in Asian markets: The determinants of location choice. working paper.
Shen, C. H. and C. C. Lee (2005), Same financial development yet different economic growth—and why? Journal of Money, Credit, and Banking, 38, 1907—1944 Shen, C. H. (2005), Cost efficiency and banking performances in a Partial Universal
banking system: An application of the Panel Smooth Threshold Model. Applied
Economics, 37, 981—992.
Shih, S. H. M. (2003), An investigation into the use of mergers as a solution for the Asian banking sector crisis. The Quarterly Review of Economics and Finance, 43, 31—49.
Vasconcellos, G. M. and R. J. Kish (1998), Cross-border mergers and acquisitions: the European-US experience. Journal of Multinational Financial Management, 8, 431—450.
Williams, B. (2002), The defensive expansion approach to multinational banking : Evidence to date. Financial Markets Institutions & Instruments, 11(2), 127—203.
Table 1 : Cross-Border merger number in Asian countries
Acquiring Country
Hong Kong India Indonesia Japan Korea Malaysia Philippines Singapore Taiwan Thailand Sum Target Country
Bef Aft Bef Aft Bef Aft Bef Aft Bef Aft Bef Aft Bef Aft Bef Aft Bef Aft Bef Aft Bef Aft
Hong Kong 0 0 2 1 9 16 2 3 14 34 0 1 20 41 7 10 5 2 59 108 India 2 4 0 1 2 2 0 0 0 0 0 0 2 9 0 0 1 0 7 16 Indonesia 1 6 0 2 7 4 2 2 10 20 1 0 13 35 1 1 0 3 35 73 Japan 0 3 0 0 0 0 0 1 0 0 0 0 3 2 0 1 0 0 3 7 Korea 0 11 0 0 0 0 4 9 0 1 0 0 1 2 0 0 0 1 5 24 Malaysia 12 14 0 0 0 0 3 6 0 0 2 0 17 24 0 0 0 1 34 45 Philippines 4 11 0 0 0 1 5 1 0 0 10 8 8 17 2 2 1 1 30 41 Singapore 8 26 0 0 7 1 1 6 0 2 13 24 1 0 0 2 0 0 30 61 Taiwan 6 8 0 0 0 0 3 8 0 1 0 0 0 0 0 7 0 0 9 24 Thailand 9 3 0 0 0 0 4 10 0 0 4 5 0 0 8 28 0 4 25 50 Sum 42 86 0 2 9 4 38 62 4 9 51 92 4 1 72 165 10 20 7 8 686 1. Bef and Aft denote the Before and After the Asian crisis, respectively.
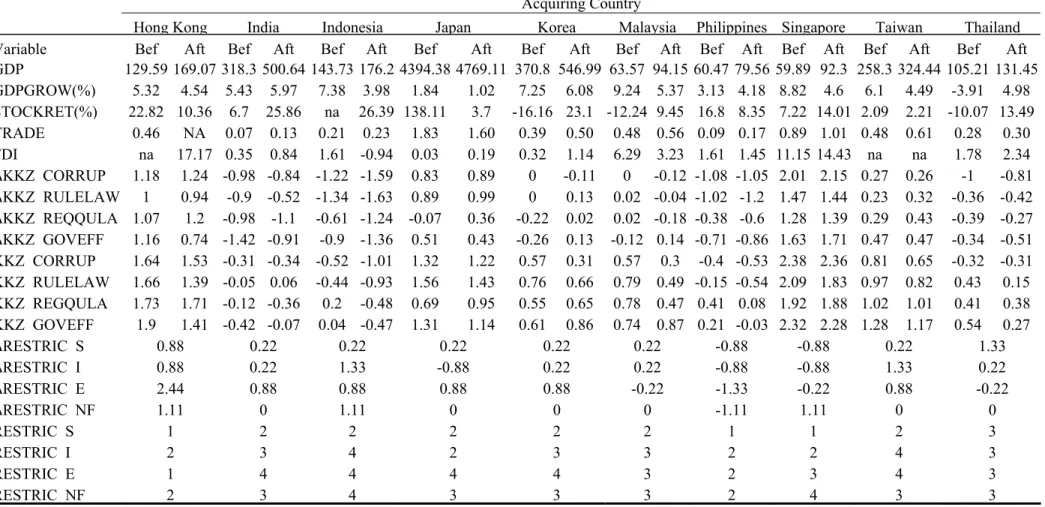
Table 2 : Descriptive Statistics
Acquiring Country
Hong Kong India Indonesia Japan Korea Malaysia Philippines Singapore Taiwan Thailand Variable Bef Aft Bef Aft Bef Aft Bef Aft Bef Aft Bef Aft Bef Aft Bef Aft Bef Aft Bef Aft GDP 129.59 169.07 318.3 500.64 143.73 176.2 4394.38 4769.11 370.8 546.99 63.57 94.15 60.47 79.56 59.89 92.3 258.3 324.44 105.21 131.45 GDPGROW(%) 5.32 4.54 5.43 5.97 7.38 3.98 1.84 1.02 7.25 6.08 9.24 5.37 3.13 4.18 8.82 4.6 6.1 4.49 -3.91 4.98 STOCKRET(%) 22.82 10.36 6.7 25.86 na 26.39 138.11 3.7 -16.16 23.1 -12.24 9.45 16.8 8.35 7.22 14.01 2.09 2.21 -10.07 13.49 TRADE 0.46 NA 0.07 0.13 0.21 0.23 1.83 1.60 0.39 0.50 0.48 0.56 0.09 0.17 0.89 1.01 0.48 0.61 0.28 0.30 FDI na 17.17 0.35 0.84 1.61 -0.94 0.03 0.19 0.32 1.14 6.29 3.23 1.61 1.45 11.15 14.43 na na 1.78 2.34 ΔKKZ CORRUP 1.18 1.24 -0.98 -0.84 -1.22 -1.59 0.83 0.89 0 -0.11 0 -0.12 -1.08 -1.05 2.01 2.15 0.27 0.26 -1 -0.81 ΔKKZ RULELAW 1 0.94 -0.9 -0.52 -1.34 -1.63 0.89 0.99 0 0.13 0.02 -0.04 -1.02 -1.2 1.47 1.44 0.23 0.32 -0.36 -0.42 ΔKKZ REQQULA 1.07 1.2 -0.98 -1.1 -0.61 -1.24 -0.07 0.36 -0.22 0.02 0.02 -0.18 -0.38 -0.6 1.28 1.39 0.29 0.43 -0.39 -0.27 ΔKKZ GOVEFF 1.16 0.74 -1.42 -0.91 -0.9 -1.36 0.51 0.43 -0.26 0.13 -0.12 0.14 -0.71 -0.86 1.63 1.71 0.47 0.47 -0.34 -0.51 KKZ CORRUP 1.64 1.53 -0.31 -0.34 -0.52 -1.01 1.32 1.22 0.57 0.31 0.57 0.3 -0.4 -0.53 2.38 2.36 0.81 0.65 -0.32 -0.31 KKZ RULELAW 1.66 1.39 -0.05 0.06 -0.44 -0.93 1.56 1.43 0.76 0.66 0.79 0.49 -0.15 -0.54 2.09 1.83 0.97 0.82 0.43 0.15 KKZ REGQULA 1.73 1.71 -0.12 -0.36 0.2 -0.48 0.69 0.95 0.55 0.65 0.78 0.47 0.41 0.08 1.92 1.88 1.02 1.01 0.41 0.38 KKZ GOVEFF 1.9 1.41 -0.42 -0.07 0.04 -0.47 1.31 1.14 0.61 0.86 0.74 0.87 0.21 -0.03 2.32 2.28 1.28 1.17 0.54 0.27 ΔRESTRIC S 0.88 0.22 0.22 0.22 0.22 0.22 -0.88 -0.88 0.22 1.33 ΔRESTRIC I 0.88 0.22 1.33 -0.88 0.22 0.22 -0.88 -0.88 1.33 0.22 ΔRESTRIC E 2.44 0.88 0.88 0.88 0.88 -0.22 -1.33 -0.22 0.88 -0.22 ΔRESTRIC NF 1.11 0 1.11 0 0 0 -1.11 1.11 0 0 RESTRIC S 1 2 2 2 2 2 1 1 2 3 RESTRIC I 2 3 4 2 3 3 2 2 4 3 RESTRIC E 1 4 4 4 4 3 2 3 4 3 RESTRIC NF 2 3 4 3 3 3 2 4 3 3
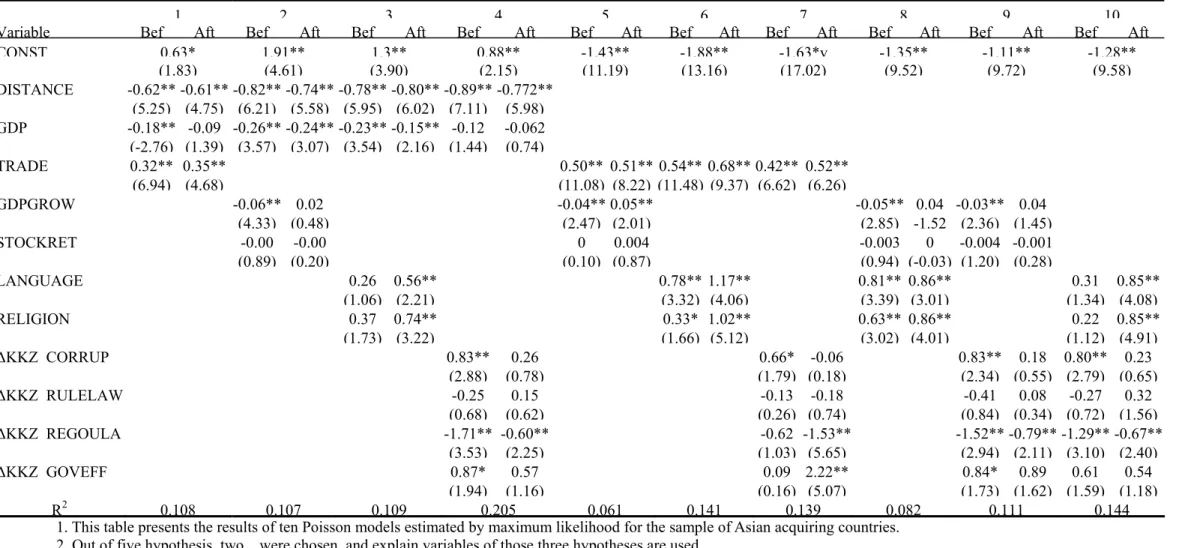
Table 3 : Determinants of international financial mergers : Poisson estimates
1 2 3 4 5 6 7 8 9 10
Variable Bef Aft Bef Aft Bef Aft Bef Aft Bef Aft Bef Aft Bef Aft Bef Aft Bef Aft Bef Aft CONST 0.63* 1.91** 1.3** 0.88** -1.43** -1.88** -1.63*v -1.35** -1.11** -1.28** (1.83) (4.61) (3.90) (2.15) (11.19) (13.16) (17.02) (9.52) (9.72) (9.58) DISTANCE -0.62** -0.61** -0.82** -0.74** -0.78** -0.80** -0.89** -0.772** (5.25) (4.75) (6.21) (5.58) (5.95) (6.02) (7.11) (5.98) GDP -0.18** -0.09 -0.26** -0.24** -0.23** -0.15** -0.12 -0.062 (-2.76) (1.39) (3.57) (3.07) (3.54) (2.16) (1.44) (0.74) TRADE 0.32** 0.35** 0.50** 0.51** 0.54** 0.68** 0.42** 0.52** (6.94) (4.68) (11.08) (8.22) (11.48) (9.37) (6.62) (6.26) GDPGROW -0.06** 0.02 -0.04** 0.05** -0.05** 0.04 -0.03** 0.04 (4.33) (0.48) (2.47) (2.01) (2.85) -1.52 (2.36) (1.45) STOCKRET -0.00 -0.00 0 0.004 -0.003 0 -0.004 -0.001 (0.89) (0.20) (0.10) (0.87) (0.94) (-0.03) (1.20) (0.28) LANGUAGE 0.26 0.56** 0.78** 1.17** 0.81** 0.86** 0.31 0.85** (1.06) (2.21) (3.32) (4.06) (3.39) (3.01) (1.34) (4.08) RELIGION 0.37 0.74** 0.33* 1.02** 0.63** 0.86** 0.22 0.85** (1.73) (3.22) (1.66) (5.12) (3.02) (4.01) (1.12) (4.91) ΔKKZ CORRUP 0.83** 0.26 0.66* -0.06 0.83** 0.18 0.80** 0.23 (2.88) (0.78) (1.79) (0.18) (2.34) (0.55) (2.79) (0.65) ΔKKZ RULELAW -0.25 0.15 -0.13 -0.18 -0.41 0.08 -0.27 0.32 (0.68) (0.62) (0.26) (0.74) (0.84) (0.34) (0.72) (1.56) ΔKKZ REGQULA -1.71** -0.60** -0.62 -1.53** -1.52** -0.79** -1.29** -0.67** (3.53) (2.25) (1.03) (5.65) (2.94) (2.11) (3.10) (2.40) ΔKKZ GOVEFF 0.87* 0.57 0.09 2.22** 0.84* 0.89 0.61 0.54 (1.94) (1.16) (0.16) (5.07) (1.73) (1.62) (1.59) (1.18) R2 0.108 0.107 0.109 0.205 0.061 0.141 0.139 0.082 0.111 0.144
1. This table presents the results of ten Poisson models estimated by maximum likelihood for the sample of Asian acquiring countries. 2. Out of five hypothesis, two were chosen, and explain variables of those three hypotheses are used.
3. Bef and Aft denote the Before and After the Asian crisis, respectively.
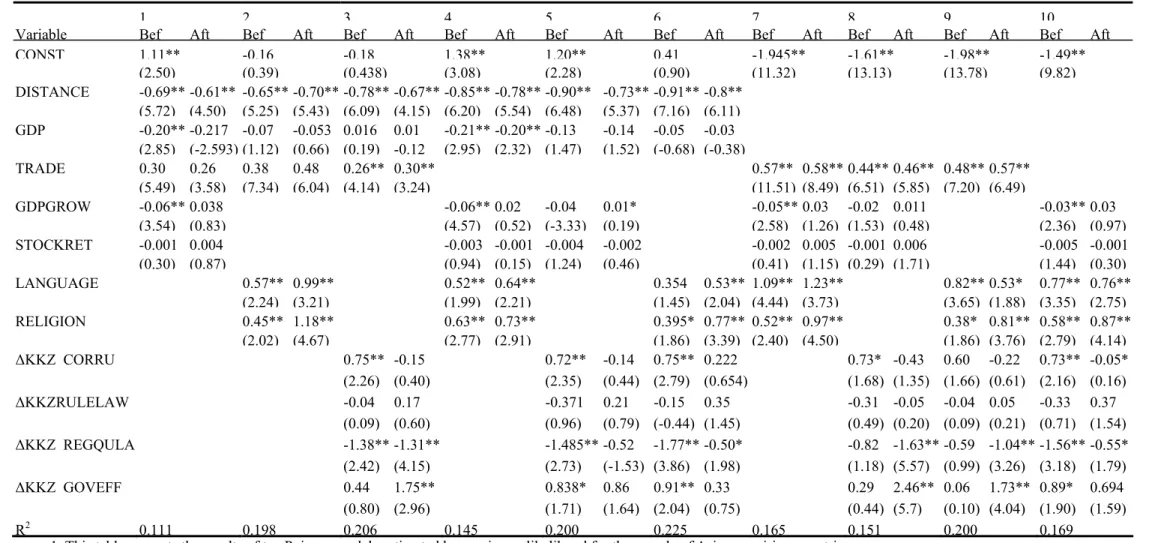
Table 4 : Determinants of international financial mergers : Poisson estimates
1 2 3 4 5 6 7 8 9 10
Variable Bef Aft Bef Aft Bef Aft Bef Aft Bef Aft Bef Aft Bef Aft Bef Aft Bef Aft Bef Aft CONST 1.11** -0.16 -0.18 1.38** 1.20** 0.41 -1.945** -1.61** -1.98** -1.49** (2.50) (0.39) (0.438) (3.08) (2.28) (0.90) (11.32) (13.13) (13.78) (9.82) DISTANCE -0.69** -0.61** -0.65** -0.70** -0.78** -0.67** -0.85** -0.78** -0.90** -0.73** -0.91** -0.8** (5.72) (4.50) (5.25) (5.43) (6.09) (4.15) (6.20) (5.54) (6.48) (5.37) (7.16) (6.11) GDP -0.20** -0.217 -0.07 -0.053 0.016 0.01 -0.21** -0.20** -0.13 -0.14 -0.05 -0.03 (2.85) (-2.593) (1.12) (0.66) (0.19) -0.12 (2.95) (2.32) (1.47) (1.52) (-0.68) (-0.38) TRADE 0.30 0.26 0.38 0.48 0.26** 0.30** 0.57** 0.58** 0.44** 0.46** 0.48** 0.57** (5.49) (3.58) (7.34) (6.04) (4.14) (3.24) (11.51) (8.49) (6.51) (5.85) (7.20) (6.49) GDPGROW -0.06** 0.038 -0.06** 0.02 -0.04 0.01* -0.05** 0.03 -0.02 0.011 -0.03** 0.03 (3.54) (0.83) (4.57) (0.52) (-3.33) (0.19) (2.58) (1.26) (1.53) (0.48) (2.36) (0.97) STOCKRET -0.001 0.004 -0.003 -0.001 -0.004 -0.002 -0.002 0.005 -0.001 0.006 -0.005 -0.001 (0.30) (0.87) (0.94) (0.15) (1.24) (0.46) (0.41) (1.15) (0.29) (1.71) (1.44) (0.30) LANGUAGE 0.57** 0.99** 0.52** 0.64** 0.354 0.53** 1.09** 1.23** 0.82** 0.53* 0.77** 0.76** (2.24) (3.21) (1.99) (2.21) (1.45) (2.04) (4.44) (3.73) (3.65) (1.88) (3.35) (2.75) RELIGION 0.45** 1.18** 0.63** 0.73** 0.395* 0.77** 0.52** 0.97** 0.38* 0.81** 0.58** 0.87** (2.02) (4.67) (2.77) (2.91) (1.86) (3.39) (2.40) (4.50) (1.86) (3.76) (2.79) (4.14) ΔKKZ CORRU 0.75** -0.15 0.72** -0.14 0.75** 0.222 0.73* -0.43 0.60 -0.22 0.73** -0.05* (2.26) (0.40) (2.35) (0.44) (2.79) (0.654) (1.68) (1.35) (1.66) (0.61) (2.16) (0.16) ΔKKZRULELAW -0.04 0.17 -0.371 0.21 -0.15 0.35 -0.31 -0.05 -0.04 0.05 -0.33 0.37 (0.09) (0.60) (0.96) (0.79) (-0.44) (1.45) (0.49) (0.20) (0.09) (0.21) (0.71) (1.54) ΔKKZ REGQULA -1.38** -1.31** -1.485** -0.52 -1.77** -0.50* -0.82 -1.63** -0.59 -1.04** -1.56** -0.55* (2.42) (4.15) (2.73) (-1.53) (3.86) (1.98) (1.18) (5.57) (0.99) (3.26) (3.18) (1.79) ΔKKZ GOVEFF 0.44 1.75** 0.838* 0.86 0.91** 0.33 0.29 2.46** 0.06 1.73** 0.89* 0.694 (0.80) (2.96) (1.71) (1.64) (2.04) (0.75) (0.44) (5.7) (0.10) (4.04) (1.90) (1.59) R2 0.111 0.198 0.206 0.145 0.200 0.225 0.165 0.151 0.200 0.169
1. This table presents the results of ten Poisson models estimated by maximum likelihood for the sample of Asian acquiring countries. 2. Out of five hypothesis, three were chosen, and explain variables of those three hypotheses are used.
4. “**” denote significant at the 5% level, “*” denote significant at the 10% level 7 計畫成果自評
1. 本文分析亞洲 M&A 後,已得到預期分析結果。 2. 對研究 M&A 其他學者有其助益。