Analysis of terahertz pulses from large-aperture biased semi-insulating and
arsenic-ion-implanted GaAs antennas
Rone-Hwa Chou, Tze-An Liu, and Ci-Ling Pan
Citation: Journal of Applied Physics 104, 053121 (2008); doi: 10.1063/1.2967716 View online: http://dx.doi.org/10.1063/1.2967716
View Table of Contents: http://scitation.aip.org/content/aip/journal/jap/104/5?ver=pdfcov Published by the AIP Publishing
Articles you may be interested in
Dark current and trailing-edge suppression in ultrafast photoconductive switches and terahertz spiral antennas fabricated on multienergy arsenic-ion-implanted GaAs
J. Appl. Phys. 98, 013711 (2005); 10.1063/1.1953867
Ultrabroadband terahertz field detection by photoconductive antennas based on multi-energy arsenic-ion-implanted GaAs and semi-insulating GaAs
Appl. Phys. Lett. 83, 1322 (2003); 10.1063/1.1604191
THz radiation emission properties of multienergy arsenic-ion-implanted GaAs and semi-insulating GaAs based photoconductive antennas
J. Appl. Phys. 93, 2996 (2003); 10.1063/1.1541105
Optical transmission spectroscopy of semi-insulating GaAs substrate implanted by arsenic ions at different dosages
J. Appl. Phys. 89, 6536 (2001); 10.1063/1.1370088
Photoconductive detection of millimeter waves using proton implanted GaAs Appl. Phys. Lett. 75, 745 (1999); 10.1063/1.124499
Analysis of terahertz pulses from large-aperture biased semi-insulating and
arsenic-ion-implanted GaAs antennas
Rone-Hwa Chou,1,a兲 Tze-An Liu,2,b兲and Ci-Ling Pan1,c兲
1
Department of Photonics and Institute of Electro-Optical Engineering, National Chiao Tung University, 1001 Ta Hsueh Road, Hsinchu, Taiwan 30010, Republic of China
2
Center for Measurement Standards, Industrial Technology Research Institute, 321, Sec. 2, Kuang Fu Rd. Hsinchu, Taiwan 300, Republic of China
共Received 17 March 2008; accepted 11 June 2008; published online 15 September 2008兲
We investigate the characteristics of terahertz radiation pulses generated using biased semi-insulating and arsenic-ion-implanted GaAs photoconductive antennas with 1.5 cm aperture size under various pump fluences and bias fields. Compared with semi-insulating GaAs antenna, our arsenic-ion-implanted GaAs antenna exhibits larger bandwidth and better emission efficiency. Our simulation verifies that the superior characteristics for the latter can be partly attributed to larger optical absorption in the ion-implanted layer. For both types of antennas, we observe that the radiated peak terahertz amplitude displays an anomalous dependence on pump fluence, which deviates from the prediction given by the scaling rule. Analyzing the theoretical and simulation results, we infer that this behavior arises from band filling and two-photon absorption effects. At specific pump fluence, we find that the dependence of peak terahertz amplitude on bias field is distinct from the usual linear relationship predicted by the scaling rule. © 2008 American Institute
of Physics.关DOI:10.1063/1.2967716兴
I. INTRODUCTION
Terahertz radiation can be generated by employing fem-tosecond laser pulses to excite biased photoconductive共PC兲 antennas.1 According to aperture size, a PC antenna with aperture size larger than 5 mm is classified as large aperture 共or large area兲 types since its size is much larger than its radiation wavelength共approximately submillimeters兲. A typi-cal configuration for a large-aperture biased antenna consists of two coplanar strip lines separated by 5 mm and above. Such an antenna can generate a giant terahertz radiation pulse with peak amplitude as high as 150 kV/cm when an expanded femtosecond laser beam is normally incident upon the antenna surface.2 To increase terahertz emission effi-ciency, PC antennas with laterally structured emitter elec-trodes were employed.3,4Recently, Dreyhaupt et al.5reported a large-area PC terahertz emitter with an interdigitated elec-trode metal-semiconductor-metal structure and selective shadowing of optical excitation. Terahertz radiation with peak amplitude of 85 V/cm and bandwidth of about 2 THz were demonstrated by the use of a high bias field.6,7 High terahertz field amplitude is desirable for potential applica-tions for sensing, imaging,8telecommunications,9,10and non-linear spectroscopy.11If the carrier lifetimecof PC material for fabrication of a large-aperture antenna is much longer than the pump pulse durationp, then the generated far-field terahertz pulse tends to exhibit a unipolar waveform, which is ideal for field ionization study.12
A significant criterion for assessing the performance of a biased PC antenna is its terahertz emission efficiency. In this
regard, one can obtain insights by comparing the dependence of peak terahertz amplitude Ermaxon pump fluence F or bias field Eb.13Ermaxfirst grows rapidly with pump fluence for F below a characteristic fluence Fs, and then ascends slowly and linearly above Fs. This saturation behavior originates mainly from the near-field screening effect14that can be de-scribed by the scaling rule.15 It was also shown that Ermax scales linearly with Ebup to a breakdown value. In practice, either the F or Ebdependence will vary with different aper-ture sizes, pump spot sizes, or material properties.
Of all the PC materials studied, semi-insulating GaAs 共SI-GaAs兲 and low-temperature-grown GaAs 共LT-GaAs兲 were most widely used for terahertz emitters.16 Some ion-implanted materials such as Fe-ion-implanted InP 共InP:Fe+兲 共Ref. 17兲 or arsenic-ion-implanted GaAs 共GaAs:As+兲 have shown developments.18,19 From a manufacturing viewpoint, the main benefit to the GaAs: As+antenna is that ion dosages can be accurately controlled during implantation. This ad-vantage enables the GaAs: As+antenna to be reproducible in comparison with the LT-GaAs antenna, which has poor growth reliability. Therefore, recent works were devoted to studying whether the GaAs: As+antenna can become an al-ternative terahertz radiation source for the LT-GaAs antenna in terahertz radiation applications.
Implanting ions into SI materials will significantly change their original resistivity and temperature stability, as well as optical properties, such ascor absorption coefficient ␣0. The value of c for As-implanted20,21 or LT-GaAs antenna22 is as short as 1 ps or less; hence, it influences terahertz radiation characteristics, including pulse shape, pulse duration, and bandwidth. Concerning the quantity ␣0, its value is affected in the presence of impurity, bias field, or ion implantation. Nolte et al.23 pointed out that LT-GaAs exhibits an excess absorption relative to GaAs, depending on
a兲Electronic mail: [email protected]. b兲Electronic mail: [email protected]. c兲Electronic mail: [email protected].
0021-8979/2008/104共5兲/053121/7/$23.00 104, 053121-1 © 2008 American Institute of Physics
the growth conditions. On the other hand, Lin and Hsu24 found that the band edge of absorption coefficient ␣0 of GaAs: As+ increases from 6.2⫻103 to 2.2⫻104 cm−1 for different dosages. Therefore, one can deduce that the absorp-tion coefficient of SI materials tends to be altered after ion implantation.
Understanding the physics critical to the emission effi-ciency of terahertz antennas will allow greater control and wider applicability of terahertz radiation. Previously, Taylor and co-workers25,26 used the current-surge model to explain several characteristics of large-aperture PC antennas, includ-ing terahertz pulse width, saturation, and pump wavelength dependence. In their model, the formation of terahertz pulses is associated with the carrier dynamics in PC material, and the time-dependent terahertz radiation is proportional to the time derivative of the surface photocurrent. We have inves-tigated the optically excited terahertz radiation from PC di-pole antennas with 5 m gaps fabricated on SI-GaAs and multi-GaAs: As+ antennas19
and analyzed their characteris-tics by using the scaling rule. In the present paper, we will extend our previous work to large-aperture antennas. Addi-tionally, we will analyze our experimental data by the use of the simulation results based on the formalism of nonlinear envelope and wave equations.
II. EXPERIMENTAL METHODS
Our basic experimental setup was a conventional tera-hertz time domain spectroscopy system.27 In detail, we used a mode-locked regeneratively amplified Ti:sapphire laser共 = 800 nm兲 with 0.8 W average output power to generate pulses with duration p of 50 fs at a 1 kHz repetition rate. The output laser beam was divided into a pump and a probe beam. The pump beam passed through a variable attenuator and was chopped at 200 Hz by a mechanical chopper. The probe power was fixed to ⬃30 mW. To overlap the whole antenna gap, the beam was first expanded by a concave lens with focal length of 5 cm, and then illuminates the gap at normal incidence. The terahertz radiation was generated by the laser excited, dc voltage applied large-aperture PC an-tenna fabricated on SI-GaAs and arsenic-ion-implanted GaAs 共GaAs:As+兲. The antenna is the AuGe/Ni/Au coated two strip line antenna with a gap spacing of 1.5 cm. The ion-implanted energy of GaAs: As+is 200 keV with postfur-nace annealing of 600 ° C for 30 min. The terahertz radiation was then emitted through the substrate, collimated by a pair of off-axis parabolic mirrors, and focused onto a 具110典-cut ZnTe crystal with 1 mm thickness. The other coherent probe laser was also transmitted through the crystal and resolved the terahertz field by a quarter wave plate, Wollaston prism, and balanced photodetectors. The terahertz waveform was mapped out by moving the delay line between the pump pulse and the probe pulse. The carrier lifetimes c for both types of antennas were obtained from the optical pump-probe differential reflection measurement. In the pump flu-ence dependflu-ence experiment, pump fluflu-ence F was varied through a calibrated attenuator in front of the emitters.
III. THEORETICAL METHODOLOGY
In order to dedicate an explanation to the mechanisms underlying terahertz pulse waveforms, we adopt a methodol-ogy based on wave propagation scheme. If a pump pulse with field strength propagates through a nonlinear disper-sive medium共e.g., terahertz antenna兲 along the z direction, it will undergo several nonlinear effects, such as pulse disper-sion⬙, two-photon absorption␣⬙, and optical-Kerr effect␥. The spatial z and time t dependent behavior associated with these phenomena is governed by the following nonlinear en-velope equation for:28
冉
z+ nL c0 t冊
= −␣共Ne兲−␣⬙兩兩 2+ i⬙ 2 2 t2 + i␥兩兩 2, 共1兲 where ␣共Ne兲 =␣0冉
Nmax− Ne Nmax冊
共2兲 is the single-photon absorption caused by the band filling effect,29 ␣0 is the linear absorption coefficient, Nmax is the population inversion threshold, Ne is the single-photon-excited electron concentration, while the constant nL, c, and symbol i stand for linear refractive index, light vacuum speed, and imaginary unit, respectively. In Eq. 共2兲, the evo-lutions of the Ne and single-photon-excited hole concentra-tion Nhobey the current-continuity equationsNe t =␣共Ne兲 兩兩2 2h
冑
− Ne共x,z,t兲 c , 共3兲 Nh t =␣共Ne兲 兩兩2 2h冑
− Nh共x,z,t兲 c , 共4兲where denotes the medium impedance and his the pho-ton energy. The generated carriers are subjected to Eb and cause a conducting current J given by
J = Je+ Jh= q兵eNe共x,z,t兲 +hNh共x,z,t兲其Eb. 共5兲 Here the quantities e andh denote the carrier mobilities for electron and hole, and q stands for the electron charge. Inside the medium, the current J induces an electromagnetic field E satisfying the second-order scalar wave equation
ⵜ2E − 2E t2 =
J
t. 共6兲
In the far-field regime, evaluating the broadband Huygen– Fresnel diffraction integral30 of E yields the far-field radia-tion field Er共t兲 as Er共t兲 =
冕
cos共zˆ,d⬘
兲 2d⬘
c0 d dt再
E冉
x⬘
,t − d c0冊
冎
ds. 共7兲In this notation, zˆ represents the unit vector in the z direction, the distance vector is denoted as d, and s refers to the differ-ential area of the antenna’s surface. The peak terahertz am-plitude Er
max
can be obtained by evaluating the maximum of
Er.
053121-2 Chou, Liu, and Pan J. Appl. Phys. 104, 053121共2008兲
In solving Eqs.共1兲 and 共6兲, reflection boundary condi-tions are applied to and E on the incident surface, while perfectly matched layer absorbing boundary conditions are assumed on the outer surface. For, we assume a Gaussian function with duration ofp,
共z,t = 0兲 =
冑
2F p exp冋
−1 2冉
znL c0p冊
2册
, 共8兲as an initial condition of Eq.共1兲. The values for the param-eters included in Eqs.共1兲–共8兲are summarized in TableI.28,29 To match the measured data, we select a lower Nmax and higher␣⬙value than that reported in Ref. 28.
In the case of small-aperture antennas, the velocity over-shoot, space-charge field screening, or photo-Dember31 ef-fects contribute to the formation of bipolar terahertz wave-forms with bandwidth more than 1 THz, depending on F, Eb, and the incident condition of pump pulse. In our case, how-ever, the measured waveforms reveal unipolar terahertz pulses with narrower bandwidth共⬃0.5 THz兲 rather than bi-polar terahertz pulses with broader bandwidth at various F and normal incidence. This fact allows us to neglect the aforementioned three effects in our simulation for large-aperture antennas.
Although Er max
can be obtained from Eq.共7兲by evaluat-ing the maximum of Er共t兲, as a comparison, we also present the Er
max
given by the scaling rule
Er max⬇ D F/Fs 1 + F/Fs , 共9兲 where D = AnL 1/2E b 40c20dz 共10兲 and Fs= 共1 + nL兲h q共1 − R兲e0 . 共11兲
IV. RESULTS AND DISCUSSIONS A. Pump fluence dependence
1. Waveforms and spectra
In Fig. 1 we show the normalized photoreflectance changes ⌬R/R with respect to the time delay t using SI-GaAs and SI-GaAs: As+ antennas. Fitting the data of Fig. 1 to exponential decays yields c of 2.5 ps for the SI-GaAs an-tenna and 0.8 ps for the GaAs: As+antenna. Obviously, these c values are much larger than the pump pulse duration p共=0.05 ps兲. Here the values ofcare used to substitute into the calculation of Eqs.共7兲and共8兲.
In Figs.2共a兲and2共b兲, we present the measured terahertz radiation waveforms Erfrom SI-GaAs and GaAs: As+ anten-nas with Ebof 0.6 kV/cm under various pump fluences F. As can be seen, each waveform consists of a dominated peak followed by a relatively small and long negative tail. These waveforms can be characterized by four quantities: peak width dt 共full width at half maximum兲, peak shift tp, peak amplitude Ermax, and minimum amplitude Ermin. The normal-ized Fourier-transformed amplitude spectra E˜r of Figs.2共a兲 and2共b兲are shown in Figs.2共c兲and2共d兲. Due to the unipo-lar shapes in waveforms, the spectra contain small residual dc components that also can be seen from Ref.5. For these spectra, we pay attention to their peak frequency fpand fre-quency bandwidth df.
For the sake of comparison, we select one waveform individually from Figs.2共a兲and2共b兲at the same F and plot these two waveforms with normalization in Fig. 3共a兲. From Fig.3共a兲it was obtained that Ermin= 0.15 and dt = 0.72 ps for the case of the SI-GaAs antenna, and Ermin= 0.08 and dt = 0.70 ps for the case of the GaAs: As+ antenna. The quan-tity dt is comparable to those observed in some centimeter-size antennas.2The Fourier-transformed amplitude spectra E˜r of Fig. 3共a兲are plotted in Fig. 3共b兲. It was found that the quantity fpfor both types of antennas is equal to 0.13 THz, and the df 共=0.57 THz兲 of GaAs:As+ is larger than that in the case of SI-GaAs共df =0.52 THz兲.
With our aim being to explain the measured results of Figs.3共a兲and3共b兲, we calculated Eqs.共1兲–共8兲 by assuming that both␣0and nLof the GaAs: As+antenna are larger than those of the SI-GaAs antenna as seen in TableI. Figures3共c兲 and3共d兲plot the simulated Erand E˜rcorresponding to Figs. 3共a兲and3共b兲. From Fig.3共c兲, it was found that the simulated
dt for SI-GaAs and GaAs: As+are 0.32 and 0.30 ps,
respec-tively. Also, the simulated Erminis about 0.15, which is close to the measured one. In numerically studying the influence of thecon Ermin, we found that Erminis relevant to the values of the c. The shorter the c, the larger the Ermin. Besides, the
TABLE I. Parameters used in terahertz radiation simulations for SI-GaAs and GaAs: As+antennas.
␣0 共cm−1兲 Nmax 共cm−3兲 共cm/GW兲␣⬙ nL e,h 共cm2V−1s−1兲 共ps2⬙km−1兲 ␥ 共cm/GW兲 SI-GaAs 6.5⫻103 2.0⫻1018 286 3.4 1000, 50 120 3.2 GaAs: As+ 6.7⫻103 2.0⫻1018 286 3.6 800, 20 120 3.2
FIG. 1. 共Color online兲 Transient normalized photoreflectance changes for SI-GaAs共solid blue circle兲 and GaAs:As+共open red circle兲 antennas.
irregular negative waveforms stem from the pulse dispersion and optical-Kerr mechanism. In Fig. 3共d兲, the df of GaAs: As+ reveals a larger value 共df =1.5 THz兲 than that 共df =1.2 THz兲 of SI-GaAs. This larger df of GaAs:As+ merely reflects its shorter dt compared to the SI-GaAs case.
2. Peak width, peak shift, and bandwidth
Figure4共a兲plots the measured dt and tp obtained from Figs.2共a兲and2共b兲as a function of F. It is remarkable that as
F increases from 2 to 58 J/cm2, the quantity dt of SI-GaAs decreases monotonically to its minimal value located at the turning point共F=30 J/cm2, dt = 0.72 ps兲 and subsequently increases from that point onward. In the case of GaAs: As+, dt varies with F in a manner similar to the case of SI-GaAs,
but its turning point occurs at higher F共=44 J/cm2兲 than that in the case of SI-GaAs. For both types of antennas, the quantity tpreveals an increasing trend with the increase of F. Also, the dt or tp value for GaAs: As+ is less than that for SI-GaAs at each value of F. Although the measured dt values in Fig.4共a兲are close to those obtained by Hattori et al.,5it is worth noting that the phenomenon relevant to the turning point was not found in their experiments.
To interpret the measured results of Fig. 4共a兲, with the assumption of␣0and nLbeing the same as the case of Fig. 3共c兲, we calculated Eqs.共1兲–共8兲at different F and present the results in Fig.4共b兲. As seen in this figure, the simulated data produced a monotonic decrease in dt and an increase in tp with increasing F. In addition, the simulated dt or tp for GaAs: As+ is less than that for SI-GaAs, mainly due to a larger ␣0 and nL in GaAs: As+. However, it was found that the turning point behavior does not appear in the simulated
dt.
From the spectra in Figs.2共c兲and2共d兲, we plotted the measured df and fp in Fig. 4共c兲 as a function of F. Obvi-ously, one can see from Fig.4共c兲that the df of GaAs: As+is larger than that of SI-GaAs under various F. This larger df for GaAs: As+ reflects the shorter dt shown in Fig.4共a兲. In
0 1 2 3 4 5 6
t (ps)
0 100 200 300 2 9.2 18 30 44 58 F (µJ/cm )2 SI-GaAs SI-GaAsE
r(a
.u.
)
0 1 2 3 4 5 6 0 100 200 300E
r(a
.u.)
t(ps)
2 9.2 18 30 44 58 F (µ J/cm )2 GaAs:As GaAs:As+ 0.2 0.4 0.6 0.8 1.0f (THz)
0.3 0.6 0.9 1.2 0.0E
r(a
.u.)
~ 1.5 0.0 0.2 0.4 0.6 0.8 1.0E
r(a
.u.)
~f (THz)
0.3 0.6 0.9 1.2 0.0 1.5 0.0 2 9.2 18 30 44 58 F (µJ/cm )2 SI-GaAs SI-GaAs 2 9.2 18 30 44 58 F (µ J/cm )2 GaAs:As GaAs:As+ (a) (b) (c) (d)FIG. 2.共Color online兲 Measured terahertz waveforms Erfor共a兲 SI-GaAs and 共b兲 GaAs:As+antennas as a function of time delay t at various pump fluences
F. The bias field applied to the antennas was kept at 0.6 kV/cm.共c兲 Fourier-transformed amplitude spectrum E˜rof the waveforms in共a兲 and 共d兲 E˜rof the
waveforms in共b兲. 1 2 3 4 5 6 0.0 0.2 0.4 0.6 0.8 1.0 t(ps) Er (a.u.) SI-GaAs SI-GaAs GaAs:As GaAs:As+ 0.0 0.2 0.4 0.6 0.8 1.0 f (THz) 0.3 0.6 0.9 1.2 0.0 1.5 Er (a .u.) ~ -0.20.0 0.2 0.4 0.6 0.8 1.0 1.0 1.4 1.8 2.2 2.6 3.0 -0.20.0 0.2 0.4 0.6 0.8 1.0 1.0 1.4 1.8 2.2 2.6 3.0 0.0 0.2 0.4 0.6 0.8 1.0 0.6 1.2 2.4 3.0 0.0 f (THz) Er (a .u.) ~ 1.8 3.6 (a) (b) (c) (d) SI-GaAs SI-GaAs GaAs:As GaAs:As+ SI-GaAs SI-GaAs GaAs:As GaAs:As+ SI-GaAs SI-GaAs GaAs:As GaAs:As+ Er (a.u.) t(ps)
FIG. 3. 共Color online兲 共a兲 Measured terahertz waveforms Er, 共b兲
corre-sponding Fourier-transformed amplitude spectrum E˜r, and simulated共c兲 Er
and共d兲 E˜rfor SI-GaAs共blue full line兲 and GaAs:As+共red full line兲 antennas
at pump fluence F = 58 J/cm2. Both E
rand E˜rare normalized to their peak
amplitude.
053121-4 Chou, Liu, and Pan J. Appl. Phys. 104, 053121共2008兲
addition, it can be perceived that fp, as well as the difference between two df, has an increasing trend with the increase of
F.
3. Peak terahertz amplitude
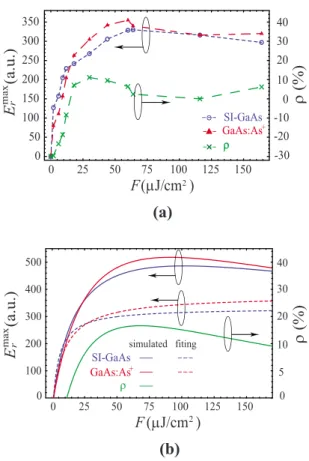
In Fig.5共a兲we show the measured Ermaxof SI-GaAs and GaAs: As+ antennas as a function of pump fluence from F = 2 up to 170 J/cm2. We observe that as F increases from 2 to 58 J/cm2, both E
r
max curves increase monotonically. Compared with the SI-GaAs case, the Ermax values of the GaAs: As+antenna are lower, provided that F⬍20 J/cm2, but exceed that of the SI-GaAs antenna, provided that F ⬎20 J/cm2; hence both curves intersect at F = 20 J/cm2. In addition, note that both curves reach their respective maxima in the vicinity of F = 60 J/cm2, then gradually be-come reduced instead of further increasing as F increases
from 60 to 170 J/cm2. We designate this phenomenon as anomalous saturation since the quantity in normal saturation tends to increase slowly with the increase of F rather than reducing to a lower value. From these two anomalous satu-ration data, it is instructive to gain insight into how the dif-ference in Ermaxbetween two types of antennas varies with F. To quantify this difference, we introduce a relative emission efficiency defined as the ratio of the difference in peak terahertz amplitude between two types of antennas to peak terahertz amplitude of the SI-GaAs antenna, that is, ⬅关Ermax共GaAs:As+兲−Ermax共SI-GaAs兲兴/Ermax共SI-GaAs兲. Fig-ure 5共a兲 also shows the F dependence of the relative emis-sion efficiency in percentage term 共%兲. In particular, it appears that the quantity first grows from F = 2 J/cm2 until it reaches to a maximum共⬃12%兲 at F=30 J/cm2and finally reduces, tending to lower values for high enough F.
In contrast to our previous study共see Ref.19兲, where we compared the emission efficiency of SI-GaAs and multi-GaAs: As+ antennas with a gap size of 5 m, our large-aperture GaAs: As+ antenna takes advantage of better terahertz emission efficiency than our SI-GaAs one, above specific F. In Ref. 16, one can see that a similar advantage also happens to the dipole-I LT-GaAs small-aperture antenna, which exhibits better emission efficiency relative to the case of SI-GaAs, above a pump power of 21 mW. Nevertheless, its advantage has not been confirmed theoretically. On the other hand, although the anomalous saturation does not occur
0 10 20 30 40 50 60 0.68 0.7 0.72 0.74 0.76 d
t
(ps) F(µJ/ cm2) 0.05 0.10 0.15 0.20 0.25t
p (ps) SI-GaAs tp dt GaAs:As+ tp dt 0.30 0.32 0.34 0.36 0 10 20 30 40 50 60 F(µJ/cm )2d
t
(ps)t
p (ps) 0.00 0.05 0.10 0.15 SI-GaAs tp dt GaAs:As+ tp dt 0 10 20 30 40 50 60 0.45 0.50 0.55 0.60 0.65 F(µJ/cm )2 d f (THz) f (THz) p 0.09 0.10 0.11 0.12 0.13 SI-GaAs fp df GaAs:As + fp df (a) (b) (c)FIG. 4.共Color online兲 共a兲 Measured peak width dt 共full line兲 and peak shift
tp共dashed line兲 obtained from Figs.2共a兲and2共b兲,共b兲 simulated dt 共full line兲
and tp 共dashed line兲, and 共c兲 measured peak frequency fp 共full line兲 and
bandwidth df共dashed line兲 obtained from Figs.2共c兲and2共d兲as a function of pump fluence F for both SI-GaAs共blue兲 and GaAs:As+共red兲 antennas.
0 25 50 75 100 125 150 0 50 100 150 200 250 300 350 E (a.u.) ma x r F(µJ/cm )2 ρ( %) 0 -10 10 20 30 40 -20 -30 SI-GaAs GaAs:As+ ρ 0 25 50 75 100 125 150 100 200 300 400 500 F (µJ/cm )2 ρ (%) 0 5 10 20 30 40 0 SI-GaAs GaAs:As+ ρ simulated fiting E (a.u.) max r
(a)
(b)
FIG. 5. 共Color online兲 共a兲 Measured 共dashed marks兲, 共b兲 fitting 共dashed line兲, and simulated 共full line兲 terahertz peak amplitudes Ermaxvs pump
flu-ence F for both SI-GaAs共blue兲 and GaAs:As+共red兲 antennas. The green
dashed cross and full lines are the ratio 兵⬅关Ermax共GaAs:As+兲
− Er
max共SI-GaAs兲兴/E
r
max共SI-GaAs兲其 for measured and simulated cases. The
bias field Ebwas kept at 0.6 kV/cm.
at our previous GaAs: As+small-aperture antenna, it was ob-served by Tani et al.16 in dipole-I SI-GaAs small-aperture antenna and also by Löffler et al.32and Hasegawa33in large-aperture SI-GaAs antenna. In Ref.33, the anomalous satura-tion was attributed to the initial carrier effect.
In an attempt to theoretically reproduce the relation be-tween the measured Ermax and F, we fit our measured Ermax using the scaling rule given by Eq.共9兲and report the fitting results in Fig. 5共b兲. From these two fitting curves, it was obtained that D = 331.5 and Fs= 5.3 J/cm2 for SI-GaAs, and D = 377.6 and Fs= 9.7 J/cm2 for GaAs: As+. Accord-ingly, either the Fs or D values in the GaAs: As+ case are larger than those in the SI-GaAs case. Note that Fsdepends on both theeand nLaccording to Eq.共11兲. Under the same pump wavelength, a larger Fs for GaAs: As+ implies two consequences: one is that its evalue is lower than that of SI-GaAs since Fsis inversely proportional toe; the other is that its nLis larger than that of SI-GaAs since Fs is propor-tional to nL. Both consequences are reasonable since ion im-plantation reduces the e value, whereas increasing the ␣0 value leads to the increase of nLdue to the reciprocal rela-tionship between␣0 and nL. Under the same pump and de-tection configuration, a larger D for GaAs: As+indicates that the quantity nL1/2 of GaAs: As+ is also larger than that of SI-GaAs according to Eq. 共10兲. Therefore, an increase in nL leads to a higher D for GaAs: As+compared to SI-GaAs. In contrast to the measured Ermax in Fig.5共a兲, although the fit-ting curves in Fig. 5共b兲 are able to account for the Ermax behavior at low F, it is still not consistent with the measured
Ermaxat the high F regime. To resolve this discrepancy, we considered the band-filling and two-photon absorption ef-fects as described in Sec. III instead of the initial carrier effect presented in Ref. 33. From the implication of the fit-ting curves given by the scaling rule, we evaluated Eqs. 共1兲–共8兲, provided that nLfor GaAs: As+is 1.06 times larger than that for SI-GaAs, and also plotted the two simulated
Er max
along with in Fig.5共b兲. As shown in the graph, each simulated Er
max
initially increases at increasing values of F, reaches a maximum at about F = 80 J/cm2, and then starts decreasing gradually at large values of F. Similarly to the measured case, the Er
max
value of GaAs: As+ is lower than that of SI-GaAs below F = 20 J/cm2, but higher than
F = 20 J/cm2. Besides, the maximum of the simulated
共⬃16%兲 appears at about F=55 J/cm2.
Referring to the simulated dependency in Fig.5共b兲, the trends in Ermax and anomalous saturation behavior are both consistent with our experimental observation of Fig. 5共a兲. Accordingly, we infer that the GaAs: As+antenna possesses a larger refractive index nLand smaller eso that the Er
max value for GaAs: As+ is lower than that for SI-GaAs, below F = 20 J/cm2, but higher than F = 20 J/cm2. In another re-spect, in the region of pump fluence more than 60 J/cm2, the effects of band filling and two-photon absorption become obvious and confine the values of Ermax.
B. Bias dependence
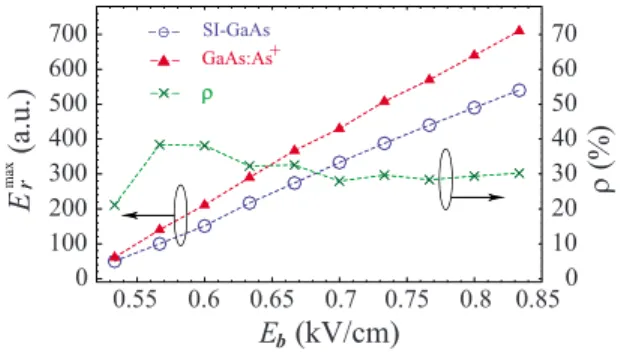
We next examine the dependence of Er max
on Ebat spe-cific F where the emission efficiency of GaAs: As+is higher
than that of SI-GaAs. Figure 6 contains our results for the measured Ermax of SI-GaAs and GaAs: As+ antennas as a function of Eb at F = 58 J/cm2. It clearly appears that the experimental data apparently fit the linear relationships from
Eb= 0.5 to 0.85 kV/cm for both types of antennas. Besides, the zero-intercept line for GaAs: As+has a larger slope than that for SI-GaAs, implying that GaAs: As+ has a consider-ably higher Ermax than does SI-GaAs at any same Eb value. These two linear trends are analogous to those found in other large-aperture antennas 共see Refs. 14 and 15兲. As expected on the basis of the scaling rule, the origin of these linear dependences can be interpreted straightforwardly by the lin-ear relation between Er
max
and Ebin accordance with Eqs.共9兲 and共10兲. In terahertz antenna literature, we do not find any exception deviating from this linear relation.
Also shown in Fig.6 is the relative emission efficiency . Remarkably, first grows until it reaches its maximum 共⬃40%兲 in the vicinity of 0.57 kV/cm, then subsequently reduces to 30%, and does not decrease anymore at the high
Eb regime. To the best of our knowledge, this special char-acteristic has not been discovered by any group except ours. Its importance lies in the fact that if the two zero-intercept lines in Fig. 6 were exactly linear, the values in would supposedly form a horizontal line rather than a curve. Ac-cordingly, we infer that the relationships between Ermax and
Ebare not exactly linear for our or even other group’s cases. In other words, the scaling rule expressed by Eq.共9兲is not a rigorous model, and the mechanism responsible for the maxi-mum ofat low Ebregime is due to a nonlinear relationship between Ermax and Eb. Nevertheless, its exact theoretical re-lationship remains unknown to us.
V. CONCLUSIONS
We have performed a comparative study between tera-hertz radiation waveforms for large-aperture biased SI-GaAs and GaAs: As+ antennas under various pump fluences and bias field. The terahertz pulses emitted from our GaAs: As+ antenna have narrower peak width, wider bandwidth, and higher peak terahertz amplitude than those obtained from the SI-GaAs antenna. The peak frequency and bandwidth differ-ence between these two types of antennas have increasing trends with increasing pump fluence. From the pump fluence dependence of peak terahertz amplitude, we have found that
0.55 0.6 0.65 0.7 0.75 0.8 0 100 200 300 400 500 600 700 ρ( %) SI-GaAs GaAs:As+ E (a.u.) max r Eb(kV/cm) 0 10 20 30 40 50 60 70 ρ 0.85 0.55 0.6 0.65 0.7 0.75 0.8 0 100 200 300 400 500 600 700 ρ( %) SI-GaAs GaAs:As+s E (a.u.) E max Eb(kV/cm) EE 0 10 20 30 40 50 60 70 ρρ 0.85
FIG. 6. 共Color online兲 Measured peak terahertz amplitude Ermax from
SI-GaAs共blue dashed circle兲 and GaAs:As+共red dashed triangle兲 antennas
and the relative emission efficiency共green dashed cross兲 as a function of bias field Ebat pump fluence F = 58 J/cm2.
053121-6 Chou, Liu, and Pan J. Appl. Phys. 104, 053121共2008兲
SI-GaAs and GaAs: As+ antennas both exhibit anomalous saturation behaviors, which can be reproduced numerically by incorporating nonlinear effects into a rigorous electro-magnetic wave propagation model. Above a pump fluence of 20 J/cm2, the GaAs: As+antenna obtained better emission efficiency relative to the SI-GaAs antenna. On the basis of numerical simulation, we have deduced that this better emis-sion efficiency stems from the fact that both types of anten-nas have different quantities, including linear absorption co-efficient, refractive index, and carrier mobility. For the GaAs: As+ antenna, the first two quantities are larger, whereas the last is smaller in comparison with the SI-GaAs antenna. We have also inferred from our simulation that the band filling and two-photon absorption effects are respon-sible for the anomalous saturation behavior. In the bias field dependence of measured peak terahertz amplitude, we have found that the emission efficiency of the GaAs: As+antenna is higher than that of the SI-GaAs antenna and that the rela-tive emission efficiency reaches maximum at specific bias field. This particular behavior convinces us that a more rig-orous model is required for interpreting the bias field depen-dence of peak terahertz amplitude instead of the scaling rule, and we believe that it will be an important topic worthy of being investigated further.
ACKNOWLEDGMENTS
This work was partially supported by the Academic Top Universities Program of the Ministry of Education and vari-ous grants of the National Science Council of Taiwan, Re-public of China.
1D. You, R. R. Jones, P. H. Bucksbaum, and D. R. Dykaar,Opt. Lett.18,
290共1993兲.
2T. Hattori, K. Tukamoto, and H. Nakatsuka,Jpn. J. Appl. Phys., Part 140,
4907共2001兲.
3S. R. Andrews, A. Armitage, P. G. Huggard, and A. Hussain,Phys. Med.
Biol.47, 3705共2002兲.
4G. Zhao, R. N. Schouten, N. van der Valk, W. T. Wenckebach, and P. C.
M. Planken,Rev. Sci. Instrum.73, 1715共2002兲.
5A. Dreyhaupt, S. Winnerl, T. Dekorsy, and M. Helm,Appl. Phys. Lett.86,
121114共2005兲.
6D. A. Turton, G. H. Welsh, J. J. Carey, G. D. Reid, G. S. Beddard, and K.
Wynne,Rev. Sci. Instrum.77, 083111共2006兲.
7S. Winnerl, A. Dreyhaupt, F. Peter, D. Stehr, M. Helm, and T. Dekorsy,
Nonequilibrium Carrier Dynamics in Semiconductors共Springer, Berlin,
2006兲, Vol. 110, p. 73.
8B. B. Hu and M. C. Nuss, Opt. Lett. 20, 1716共1995兲.
9T.-A. Liu, G.-R. Lin, Y.-C. Chang, and C.-L. Pan,Opt. Express13, 10416
共2005兲.
10S. Ramsey, E. Funk, and C. H. Lee, Technical Digest of the International
Topical Meeting on Microwave Photonics ‘99, 1999共unpublished兲, p. 265.
11R. R. Jones, D. You, and P. H. Bucksbaum, Phys. Rev. Lett.70, 1236
共1993兲.
12X. Zhang and R. R. Jones,Phys. Rev. A73, 035401共2006兲. 13P. K. Benicewicz and A. J. Taylor, Opt. Lett. 18, 1332共1993兲.
14J. T. Darrow, X.-C. Zhang, D. H. Auston, and J. D. Morse,IEEE J.
Quan-tum Electron.28, 1607共1992兲.
15P. K. Benicewicz, J. P. Roberts, and A. J. Taylor, J. Opt. Soc. Am. B 11,
2533共1994兲.
16M. Tani, S. Matsuura, K. Sakai, and S. Nakashima,Appl. Opt.36, 7853
共1997兲.
17T.-A. Liu, M. Tani, M. Nakajima, M. Hangyo, K. Sakai, S. Nakashima,
and C.-L. Pan,Opt. Express12, 2954共2004兲.
18J. Lloyd-Hughes, E. Castro-Camus, M. D. Fraser, H. H. Tan, C. Jagadish,
and M. B. Johnston,Phys. Rev. B70, 235330共2004兲.
19T.-A. Liu, M. Tani, and C.-L. Pan,J. Appl. Phys.93, 2996共2003兲. 20M. Tani, K. Sakai, H. Abe, S. Nakashima, H. Harima, M. Hangyo, Y.
Tokuda, K. Kanamoto, Y. Abe, and N. Tsukada,Jpn. J. Appl. Phys., Part 1
33, 4807共1994兲.
21S. Gupta, J. F. Whitaker, and G. A. Mourou,IEEE J. Quantum Electron.
28, 2464共1992兲.
22H.-H. Wang, P. Grenier, J. F. Whitaker, H. Fujioka, J. Jasinski, and Z.
Liliental-Weber,IEEE J. Sel. Top. Quantum Electron.2, 630共1996兲.
23D. D. Nolte, W. Walukiewicz, and E. E. Haller,Phys. Rev. Lett.59, 501
共1987兲.
24G.-R. Lin and C.-C. Hsu,J. Appl. Phys.89共11兲, 6536 共2001兲.
25A. J. Taylor, P. K. Benicewicz, and S. M. Young, Opt. Lett. 18共16兲, 1340
共1993兲.
26G. Rodriguez, S. R. Caceres, and A. J. Taylor, Opt. Lett. 19共23兲, 1994
共1994兲.
27Q. Chen and X.-C. Zhang,Appl. Phys. Lett.74, 3435共1999兲.
28E. A. Bahaa and M. C. Teich, Fundamentals of Photonics共Wiley, New
York, 1991兲, Chap. 19.
29F. Kadlec, H. Nemec, and P. Kuzel,Phys. Rev. B70, 125205共2004兲. 30J. W. Goodman, Introduction to Fourier Optics共McGraw-Hill, New York,
1996兲.
31T. Dekorsy, H. Auer, H. J. Bakker, H. G. Roskos, and H. Kurz,Phys. Rev.
B53, 4005共1996兲.
32T. Löffler, T. Hahn, M. Thomson, F. Jacob, and H. G. Roskos,Opt.
Ex-press13, 5353共2005兲.
33N. Hasegawa, Thesis, University of Frankfurt, 2004.