國
立 交 通 大 學
生物資訊及系統生物研究所
博
士 論 文
環單磷酸腺苷受體蛋白相依非編碼小片段核醣核酸
在大腸桿菌中的網路建構
Construction of cAMP-CRP dependent Small
Non-coding RNAs Networks in Escherichia coli
研
究 生:黃熙淵
指導教授:黃憲達
博士
環單磷酸腺苷受體蛋白相依非編碼小片段核醣核酸在大腸桿菌中的網路建構
Construction of cAMP-CRP dependent Small Non-coding RNAs
Networks in Escherichia coli
研 究 生:黃熙淵
Student:Hsi-Yuan Huang
指導教授:黃憲達 博士
Advisor:Hsien-Da Huang
國 立 交 通 大 學
生 物 資 訊 及 系 統 生 物 研 究 所
博 士 論 文
A Thesis
Submitted to Institute of Bioinformatics and Systems Biology
College of the Biological Science & Technology
National Chiao Tung University
in partial Fulfillment of the Requirements
for the Degree of
Ph.D.
in
Bioinformatics and Systems Biology
August 2011
Hsinchu, Taiwan, Republic of China
i
環單磷酸腺苷受體蛋白相依非編碼小片段核醣核酸
在大腸桿菌中的網路建構
學生:黃熙淵 指導教授:黃憲達 博士
國立交通大學 生物資訊及系統生物研究所
摘要
非編碼小片段核醣核酸 (sRNAs) 常因應環境刺激而改變表現量,進而影響標的基因 (Targets) 的蛋白合成與活性。到目前為止,大腸桿菌就包含了 80 多個非編碼小片段 核醣核酸。發 現 的 非編碼小片段核醣核酸受環境與轉錄因子所調控,並有著多樣的 生理角色。為了加速非編碼小片段核醣核酸的相關研究,如合成與功能,進而應用於 基因網路的建構,非編碼小片段核醣核酸與轉錄因子及標的基因的連結是必需的。此 研究以環 單 磷 酸 腺 苷 受 體 蛋 白(cAMP-CRP)調 控 的 非編碼小片段核醣核酸為例 子。首先,我們從文獻與已知資料庫收集所有非編碼小片段核醣核酸的資料,接著透 過序列分析找出環單磷酸腺苷受體蛋白相依非編碼小片段核醣核酸,並分析其標的基 因,最後完成環單磷酸腺苷受體蛋白相依非編碼小片段核醣核酸在大腸桿菌中的網路 建構。ii
Construction of cAMP-CRP dependent Small
Non-coding RNAs Networks in Escherichia coli
Student: Hsi-Yuan Huang Advisor : Dr. Hsien-Da Huang
Institute of Bioinformatics and Systems Biology, National Chiao
Tung University
Abstract
Small non-coding RNAs (sRNAs) carry out a variety of biological functions and affect protein synthesis and protein activities in prokaryotes. Recently, ~80 small RNAs have been found in Escherichia coli. The synthesis of the sRNAs is induced by various conditions and regulators and they would have a variety of physiological roles. To speed up the processes in studying sRNA synthesis and sRNA functions and improve current approaches to gene regulatory network modeling, it is necessary to link these sRNAs to regulators and targets. Here, we use cAMP-CRP related sRNAs as an example and hope to construct the cAMP-CRP dependent small non-coding RNAs networks. Therefore, we collect sRNAs from literatures and public data resource and integrated related information of sRNAs and gene expression profiles. Then, the improved approaches were undertaken to identify CRP regulatory sites in the promoter regions of sRNAs and to identify the targets of sRNAs. Finally, the cAMP-CRP dependent sRNAs Networks are constructed based on this information and existing biological knowledge.
iii
誌謝
時間過的好快,轉眼間醫學院都可以念完了。在取得學位的過程中,要
感謝的人實在太多了,但我不要和陳之藩一樣,因為他說:要感謝的人太
多了,那就謝天吧。
首先,我要感謝我的指導老師 黃憲達教授。於過程中,不斷的給予我
指導、幫助與包容。另外要感謝交通大學生物科技系 曾慶平教授的提醒和
指正學生不足之處。
我還要特別感謝何信瑩教授、鄒安平教授、黃奇英教授、廖光文教授和
鄧致剛教授能夠在百忙中指導我的博士論文並提供寶貴意見,使論文的內
容得以更加充實完整。
此外,更要感謝楊冀冬、陳義雄、朱翊維、許博凱和許勝達同學在我研
究過程中不斷給我意見、方向和協助,讓我的研究得以順利完成。
當然,也要感謝實驗室和紅會的夥伴,在各方面的幫忙與支持。除此之
外,還有許許多多曾經幫助過我的人,雖無法一一感謝,但是還是要謝謝
你們的幫忙。
最後,要感謝我的父母親和家人,讓我能夠無後顧之憂地順利完成學
業。
感謝名單如有疏漏,請見諒。
100 年 于交通大學
iv
Table of Contents
摘要 ... I ABSTRACT ... II 誌謝 ... III TABLE OF CONTENTS ... IV LIST OF FIGURES ... VII LIST OF TABLES ... VIIICHAPTER 1 INTRODUCTION ... 1
1.1BIOLOGICAL BACKGROUND ... 1
1.1.1 Small RNA Biogenesis ... 1
1.1.2 Role of RNA chaperone Hfq ... 2
1.1.3 Functional Classes of sRNAs ... 3
1.2MOTIVATION ... 5
1.3RESEARCH GOALS ... 6
1.3.1 Construction of small non-coding RNAs information repository ... 6
1.3.2 Prediction of cAMP-CRP dependent small non-coding RNAs ... 6
1.3.3 Identification of target genes of small non-coding RNAs ... 7
1.4ORGANIZATION OF THIS DISSERTATION... 8
CHAPTER 2 CONSTRUCTION OF SMALL NON-CODING RNAS INFORMATION REPOSITORY ... 9
2.1INTRODUCTION ... 9
2.2RELATED WORKS... 10
2.3THE SPECIFIC AIM OF DATA INTEGRATION OF SRNAS ... 16
2.4MATERIALS AND METHODS ... 18
2.4.1 Integration of external data sources ... 18
2.4.2 Integration of annotated tools ... 20
2.5RESULTS ... 23
2.5.1 Database Statistics ... 23
2.5.2 Data Comparison ... 25
v
2.6SUMMARY ... 32
CHAPTER 3 PREDICTION OF CAMP-CRP DEPENDENT SMALL NON-CODING RNAS . 34 3.1INTRODUCTION ... 34
3.1.1 Computational approach for motif discovery ... 35
3.1.2 Experimental approach for quantifying the binding of proteins to specific DNA regions ... 35
3.2RELATED WORKS... 36
3.3MOTIVATION AND THE SPECIFIC AIM ... 41
3.4MATERIALS AND METHODS ... 41
3.4.1 Constructing of positive dataset and prediction model ... 42
3.4.2 Escherichia coli 0.155 K Custom Small RNA Array ... 43
3.4.3 Microarray data analysis ... 43
3.5RESULTS ... 44
3.5.1 Strategy for the construction of prediction model ... 44
3.5.2 Identification of CRP binding sites on sRNAs promoter region... 45
3.5.3 CRP binding sites scan ... 48
3.5.4 Genomic SELEX screening sites scan ... 57
3.6SUMMARY ... 58
CHAPTER 4 IDENTIFICATION OF TARGET GENES OF SMALL NON-CODING RNAS ... 61
4.1INTRODUCTION ... 61
4.2RELATED WORKS... 61
4.3MOTIVATION AND THE SPECIFIC AIM ... 64
4.4MATERIALS AND METHODS ... 64
4.4.1 Compilation of small RNAs and their targets ... 64
4.4.2 Prediction of sRNA-mRNA interactions ... 75
4.5RESULTS ... 76
4.5.1 Targets prediction for all known sRNAs in E. coli ... 76
CHAPTER 5 DISCOVERY REGULATORY NETWORKS OF CAMP-CRP DEPENDENT SMALL NON-CODING RNAS ... 77
CHAPTER 6 DISCUSSIONS AND CONCLUSION ... 79
6.1CHARACTERISTICS ... 79
6.2LIMITATIONS ... 79
vi
REFERENCES ... 82
APPENDIX I LIST OF ABBREVIATIONS ... 91
APPENDIX II SUPPLEMENTAL FIGURES... 92
APPENDIX III SUPPLEMENTAL TABLES ... 97
vii
List of Figures
Figure 1 Definitions of sRNAs. ... 2
Figure 2 The biogenesis and function of sRNAs. ... 5
Figure 3 Strategy of dissertation organization. ... 8
Figure 4 The illustration of sRNAMap. ... 10
Figure 5 The data generation flow of sRNAMap. ... 18
Figure 6 The interface of the sRNA genes in sRNAMap. ... 29
Figure 7 The interface of the sRNA relations in sRNAMap. ... 30
Figure 8 The interface of the browse functions in sRNAMap. ... 31
Figure 9 The promoter types of the sRNA in sRNAMap. ... 33
Figure 10 The Flowchart of the computational and experimental steps used for genome-wide analysis of CRP-regualted sRNA genes. ... 42
Figure 11 The coverage of our model in Genomic SELEX screening system of CRP-binding sequences. ... 57
Figure 12 The system flow of sRNA targets prediction. ... 75
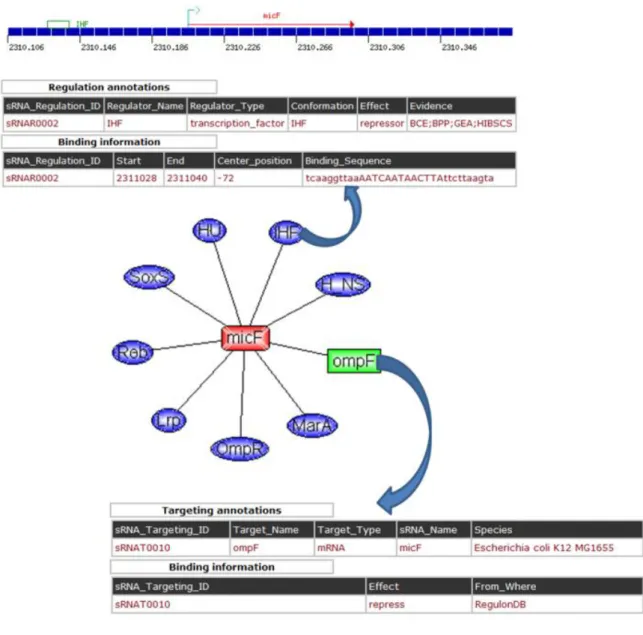
Figure 13 The regulatory network of cAMP-CRP dependent sRNAs. ... 78
Figure 14 The statistic and sequence logo of TF binding site (Top 8). ... 81
Figure S1 The structures of four bacterial Hfq proteins (adapt from Brennan, 2007 [8]). ... 92
Figure S2 Hfq might change the structures of some sRNAs and facilitate sRNA-mRNA basepairing (adapt from Storz, 2004 [9]). ... 93
Figure S3 Different types of sRNAs functional mechanism (adapt from Liu, 2010 [12]). 94 Figure S4 The structure of CRP-(cAMP)2-DNA complex (Fic, 2009 [43]). ... 95
viii
List of Tables
Table 1 Summary of sRNAMap resource. ... 12
Table 2 The statistics of small non-coding RNAs in sRNAMap. ... 19
Table 3 The list of the linked external data sources. ... 21
Table 4 The list of the integrated annotated tools. ... 21
Table 5 The list of the microbial genomes used in this work. ... 23
Table 6 Length distribution of the total experimental verified sRNA genes. ... 25
Table 7 Transcription start site distribution of the experimental verified sRNA genes in Escherichia coli K-12 MG1655. ... 25
Table 8 Comparing sRNAMap with other resources. ... 27
Table 9 Bioinformatics tools for discovery of TFBSs/motif (Sacha, 2009)... 37
Table 10 The detailed result of identification of CRP binding sites on sRNAs promoter region. ... 45
Table 11 Suggestion of CRP cis-elements in EcoCyc. ... 49
Table 12 The cAMP-dependent sRNAs. ... 59
Table 13 Summary of target prediction tools. ... 63
Table 14 List of the interaction information between sRNA genes and their targets. ... 65
Table 15 The number of predicted targets for cAMP-CRP dependent sRNAs in E. coli. .... 76
Table S1 Effect of sRNAs on their mRNA or protein targets (adapt from Replila, 2009 [11]). ... 97
Table S2 Physiological roles of Hfq-binding RNAs in E. coli and S. typhimurium (Gottesman, 2010 [17]). ... 98
1
Chapter 1 Introduction
The term of small non-coding RNAs (sRNAs, small RNAs) is often used for bacterial non-coding RNAs (ncRNAs). These RNAs are not translated into proteins, but they carry out important regulatory roles in cell adaptation by binding to specific mRNAs or proteins. Until recently, ~80 small RNAs had been found in Escherichia coli. Most of these genes are indeterminate and their regulatory roles are unclear. To systematically investigate the sRNA synthesis, analyze the sRNA regulations, and construct the sRNA networks, we collect sRNAs from literatures and public data resource and integrated related information of sRNAs and gene expression profiles (Chapter 2), analyze the cis-regulatory elements of sRNA genes (Chapter 3) and identify the targets of sRNAs (Chapter 4). We hope to construct the cAMP-CRP dependent small non-coding RNAs networks to speed up the processes in studying sRNA synthesis and sRNA functions and improve current approaches to gene regulatory network modeling.
1.1 Biological Background
1.1.1 Small RNA Biogenesis
Small non-coding RNAs are discovered in many organisms ranging from bacteria to mammals, play important regulatory roles in a variety of biological functions on cell physiology including regulation of cell development, cell death and chromosome silencing. For the prokaryotic species, the small RNAs locate in the intergenic regions (IGRs) and many of them have own promoters and Rho-independent terminator [1-3] (Figure 1 a and 1 b). These promoters are not different from other bacterial genes. Thus, they are highly regulated and frequently expressed as part of well-known stress
2
response regulatory systems [4]. For example, oxidative stress leads to synthesis of the small RNA OxyS by activating the OxyR transcriptional regulator [5]; and Spot42 RNA is regulated by cyclic AMP-cyclic AMP receptor protein (CRP) [6]. Additionally, Storz et al. detect several small RNAs derived from 5’- or 3’-UTRs (Figure 1 c). They find these small RNAs are very abundant and show different expression patterns from the mRNAs from which they are likely to be derived and suggest they have independent functions [7]. More recently, more than 80 small RNAs with size range of 50-500 nucleotides have been verified in Escherichia coli.
Figure 1 Definitions of sRNAs.
1.1.2 Role of RNA chaperone Hfq
3
similar to mammalian Sm/Sm-like proteins involved in RNA splicing. As shown in Figure S1 [8], the Hfq structures of P. aeruginosa, E. coli, and S. aureus with and without RNA are depicted different colors. Hfq is found to binds strongly to single-stranded and AU-rich RNA. In general, Hfq interacts with some of small RNAs to stabilize sRNAs,
stimulate sRNA-mRNA pairing and affect many cellular processes [9, 10] (Figure S2).
1.1.3 Functional Classes of sRNAs
In the past ten years, regulatory RNAs became an explosive issue. Many small RNAs have been reported on bacterial chromosomes, but very few of these RNAs have been examined for function. Table S1 [11] shows the summary of sRNAs mechanism and Figure S3 [12] shows the different types of sRNAs mechanism. So far we know that small RNAs can impact the activity of proteins or transcription, stability or translation of mRNAs. Although some of these regulatory RNAs act by binding to and modulating protein activation, the majority of characterized sRNAs act by base-pairing with target mRNAs [13]. These base-pairing sRNAs can be divided into two categories: trans-encoded sRNAs encoded at genomic locations distinct from the target RNAs and cis-encoded sRNAs encoded on the DNA strand opposite their target mRNAs.
The activation of protein:
Some trans-encoded sRNAs interact directly with proteins and modify their activation. There are two known target proteins in E. coli: RNA polymerase, regulated by the 6S RNA [14], and CsrA, the carbon storage regulatory protein, regulated by binding to at least two RNAs, CsrB and CsrC [15, 16] (Figure S3 c). During stationary phase, 6S binds to and alters the RNA polymerase to recognize the sigma 70-dependent promoters. In another cases, CsrA, an RNA binding protein, is the central component of the Csr
4
(carbon storage regulator) system. CsrB and CsrC bind to and antagonize the effects of the CsrA protein [11].
The transcription, stability or translation of the sense RNA:
The sRNAs can overlap the 5’ end, the 3’ end, the middle, or the entire gene encoded opposite. Figure S3 a, b show trans-encoded sRNAs can basepair imperfectly with mRNA targets and either repress or activate regulation. Figure S3 d, e show cis-encoded sRNAs can also repress or activate protein expression.
Some sRNAs inhibit translation by base-pairing to sequences that overlap or are adjacent to the Shine–Dalgarno sequence (SD) (Figure S3 a, d). In contrast to inhibition, some sRNAs promote translation by preventing the formation of an inhibitory secondary structure that blocks the ribosome binding site (RBS) (Figure S3 b). It is also conceivable that some sRNAs base-pair with targets is associated with degradation of the mRNAs (Figure S3 a, d) and some sRNAs base-pair with a target could block access of a ribonuclease and thus stabilize the mRNA (Figure S3 b, e). Therefore, sRNAs can impact mRNA stability and translation [11-13].
Figure 2 summaries the biogenesis and function of sRNAs. The sRNAs are produced as single transcripts and presented to their targets generally at the 5’ end near the start of translation. Most of them function as post-transcriptional regulation of gene expression. Table S2 shows the physiological roles of Hfq-binding RNAs in E.coli and S.
5
Figure 2 The biogenesis and function of sRNAs.
1.2 Motivation
>80 Escherichia coli sRNAs have been identified over the past few years. Many of them have own promoter and can be regulated by a specific global regulator to sense the changes in environmental conditions or other internal signals encoding changes.Spot42 and CyaR are regulated by the CRP regulator [6, 18], RyhB is directly regulated by the Fur repressor [19], SgrS is induced via the transcriptional regulator SgrR [20], and so on. Thus, many different classes of transcriptional regulators regulate sRNAs.
sRNAs with 50-450 nucleotides in length are a class of non-coding RNAs. Most of them act as posttranscriptional regulators by binding to their target mRNAs to cause transcriptional repression or activation, or mRNA degradation. Up to the present, even
6
though the functions of some sRNAs have been disclosed, there are still many sRNAs functions to be studied.
To systematically investigate the sRNA synthesis, and analyze the sRNA regulations, we hope to construct the small non-coding RNAs networks to speed up the processes in studying sRNA synthesis and sRNA functions and improve current approaches to gene regulatory network modeling. In this dissertation, we narrow down the question to construct the cAMP-CRP dependent small non-coding RNAs networks.
1.3 Research goals
The specific aims of this dissertation are listed as followings: construction of small non-coding RNAs information repository, prediction of cAMP-CRP dependent small non-coding RNAs and identification of target genes of small non-coding RNAs. Finally, we can construct the cAMP-CRP dependent small non-coding RNAs networks.
1.3.1 Construction of small non-coding RNAs
information repository
With the increasing number of sRNAs and their targets were identified in Escherichia coli and in other bacteria. It is crucial to have a comprehensive resource concerning the annotation of small non-coding RNAs in microbial genomes. Therefore, we collect the sRNA genes, the transcriptional regulators of sRNAs and the sRNA target genes by integrating a variety of biological databases and by surveying literature.
7
non-coding RNAs
cAMP receptor protein (CRP) is a part of well-understood transcription regulator which regulates about 200 coding genes. Until now, however, CRP reported to regulate only 2 non-coding sRNA genes. To provide the complete and correct information of the CRP regulated non-coding sRNAs, it is necessary to screen all sRNAs. In this study, we report here the bioinformatics prediction and transcriptome analyses of expressed sRNAs that are subject to activation or repression mediated by CRP.
1.3.3 Identification of target genes of small non-coding
RNAs
Up to the present, there are still many sRNAs functions to be studied. To speed up the processes in studying sRNA functions, developing prediction methods for sRNA targets is necessary. Numbers of prediction models have been proposed in bacteria. Obviously, the number of samples in most of models is limited. In sRNATarget, the model use 46 positive samples and 86 negative samples as the training dataset and have higher accuracy. However, the prediction results don’t contain the binding information between sRNA and mRNA. For some researchers, this is the insufficient results. To address these problems, we propose an approach to the prediction of sRNA-mRNA interactions incorporating sequence-based method, thermodynamic scoring, accessibility, and evolutionary conservation.
8
1.4 Organization of this Dissertation
There are three parts in this study (Figure 3), including the small non-coding RNAs information repository (Chapter 2), identification of cAMP-CRP dependent sRNAs (Chapter 3), and identification of target genes of small non-coding RNAs (Chapter 4). We develop a computational approach to identification of the cAMP-CRP dependent sRNA and sRNA targets.
9
Chapter 2 Construction of small non-coding
RNAs information repository
2.1 Introduction
Small non-coding RNAs (sRNAs), which are discovered in many organisms ranging from bacteria to mammals, play important regulatory roles in a variety of biological functions on cell physiology including regulation of cell development, cell death and chromosome silencing [4]. Many of them regulates gene expression at a posttranscriptional level, either by acting as antisense RNAs, by binding to complementary sequences of target transcripts, or by interacting with proteins [1]. Figure 4 depicts the synthesis and the mechanism of small non-coding RNAs. The transcription of sRNAs is regulated by transcription factors. sRNAs can play regulatory roles in translation repression, translation activation, mRNA degradation and mRNA stability.
10
Figure 4 The illustration of sRNAMap.
2.2 Related works
There are several existing resources that provided data regarding each of these areas of research. RegulonDB is a database that integrates biological knowledge of the mechanisms that regulate the transcription initiation in Escherichia coli, as well as knowledge on the organization of the genes and regulatory signals into operons in the chromosome [21]. EcoCyc [22] and RegulonDB databases are both curated by the same group at the UNAM, and that the databases therefore contain the same data content on transcriptional regulation of gene expression. Actual curation of the data occurs within EcoCyc, and is periodically propagated to RegulonDB. ASAP [23] is developed to store,
11
update, and distribute genome sequences in conjunction with associated annotations and functional characterization data. NONCODE [24] is an integrated knowledge database dedicated to non-codingRNAs. These databases above provide the annotations of the genes which include a number of sRNA genes. In addition, Storz et al. use northern analysis to document a total of 79 small in E.coli in 2005 [7]. About the interaction information between sRNA genes and their regulators or sRNA genes and their targets, RegulonDB, NPInter which is a new database covering eight category functional interactions between noncoding RNAs (except tRNAs and rRNAs) and proteins related biomacromolecules (proteins, mRNAs and genomic DNAs) in six model organisms [25] and sRNATarBase [26] is manually collected experimental data on sRNA–target interactions from peer-reviewed papers provide the interaction information. Gene Expression Omnibus (GEO) [27] is a database repository of high throughput gene expression data and hybridization arrays, chips, microarrays. Some experiments treat the roles of sRNAs and some expression profiles contain the known sRNAs in a variety of conditions. The summary of sRNAMap resource is presented in Table 1. The detailed introduction about these resource is illustrated as following.
12
Table 1 Summary of sRNAMap resource.
Resource Description URL Reference
RegulonDB
Gene regulation model of Escherichia coli K-12 beyond transcription, active (experimental) annotated
promoters and Textpresso navigation.
http://regulondb.ccg.unam.mx/index.jsp [21]
EcoCyc A scientific database for the bacterium Escherichia coli
K-12 MG1655. http://www.ecocyc.org/ [22]
ASAP A systematic annotation package for community analysis of genomes.
http://www.genome.wisc.edu/tools/asap.ht
m [23]
NONCODE An integrated knowledge database of non-coding RNAs. http://www.noncode.org/ [24] NPInter The noncoding RNAs and protein related
biomacromolecules interaction database. http://bioinfo.ibp.ac.cn/NPInter/ [25] sRNATarBase A comprehensive database for bacterial sRNA targets
verified by experiments. http://ccb.bmi.ac.cn/srnatarbase/index.php [26]
GEO
A gene expression/molecular abundance repository supporting MIAME compliant data submissions, and a curated, online resource for gene expression data browsing, query and retrieval.
13
RegulonDB
RegulonDB [21] (http://regulondb.ccg.unam.mx/) is the primary reference database of the best-known regulatory network of any free-living organism, that of Escherichia coli K-12. The major conceptual change since 3 years ago is an expanded biological context so that transcriptional regulation is now part of a unit that initiates with the signal and continues with the signal transduction to the core of regulation, modifying expression of the affected target genes responsible for the response. We call these genetic sensory response units, or Gensor Units. We have initiated their high-level curation, with graphic maps and superreactions with links to other databases. Additional connectivity uses expandable submaps. RegulonDB has summaries for every transcription factor (TF) and TF-binding sites with internal symmetry. Several DNA-binding motifs and their sizes have been redefined and relocated. In addition to data from the literature, we have incorporated our own information on transcription start sites (TSSs) and transcriptional units (TUs), obtained by using high-throughput whole-genome sequencing technologies. A new portable drawing tool for genomic features is also now available, as well as new ways to download the data, including web services, files for several relational database manager systems and text files including BioPAX format.
EcoCyc
EcoCyc [22] (http://EcoCyc.org) is a comprehensive model organism database for Escherichia coli K-12 MG1655. From the scientific literature, EcoCyc captures the functions of individual E. coli gene products; their regulation at the transcriptional, post-transcriptional and protein level; and their organization into operons, complexes and pathways. EcoCyc users can search and browse the information in multiple ways. Recent improvements to the EcoCyc Web interface include combined gene/protein pages and a Regulation Summary Diagram displaying a graphical overview of all known
14
regulatory inputs to gene expression and protein activity. The graphical representation of signal transduction pathways has been updated, and the cellular and regulatory overviews were enhanced with new functionality. A specialized undergraduate teaching resource using EcoCyc is being developed.
ASAP
ASAP [23] (http://www.genome.wisc.edu/tools/asap.htm) is a relational database and web interface developed to store, update and distribute genome sequence data and functional characterization. ASAP facilitates ongoing community annotation of genomes and tracking of information as genome projects move from preliminary data collection through post-sequencing functional analysis. The ASAP database includes multiple genome sequences at various stages of analysis, corresponding experimental data and access to collections of related genome resources. ASAP supports three levels of users: public viewers, annotators and curators. Public viewers can currently browse updated annotation information for Escherichia coli K-12 strain MG1655, genome-wide transcript profiles from more than 50 microarray experiments and an extensive collection of mutant strains and associated phenotypic data. Annotators worldwide are currently using ASAP to participate in a community annotation project for the Erwinia chrysanthemi strain 3937 genome. Curation of the E. chrysanthemi genome annotation as well as those of additional published enterobacterial genomes is underway and will be publicly accessible in the near future.
NONCODE
The NONCODE [24] (http://www.noncode.org/) is an integrated knowledge database designed for the analysis of non-coding RNAs (ncRNAs). Since NONCODE was first released 3 years ago, the number of known ncRNAs has grown rapidly, and there is
15
growing recognition that ncRNAs play important regulatory roles in most organisms. In the updated version of NONCODE (NONCODE v2.0), the number of collected ncRNAs has reached 206 226, including a wide range of microRNAs, Piwi-interacting RNAs and mRNA-like ncRNAs. The improvements brought to the database include not only new and updated ncRNA data sets, but also an incorporation of BLAST alignment search service and access through our custom UCSC Genome Browser.
NPInter
NPInter [25] (http://bioinfo.ibp.ac.cn/NPInter/) is a database that documents experimentally determined functional interactions between noncoding RNAs (ncRNAs) and protein related biomacromolecules (PRMs) (proteins, mRNAs or genomic DNAs). NPInter intends to provide the scientific community with a comprehensive and integrated tool for efficient browsing and extraction of information on interactions between ncRNAs and PRMs. Beyond cataloguing details of these interactions, the NPInter will be useful for understanding ncRNA function, as it adds a very important functional element, ncRNAs, to the biomolecule interaction network and sets up a bridge between the coding and the noncoding kingdoms.
sRNATarBase
sRNATarBase [26] (http://ccb.bmi.ac.cn/srnatarbase/index.php) is a comprehensive database for bacterial sRNA targets verified by experiments. The database holds 138 sRNA-target interactions and 252 noninteraction entries, which were manually collected from peer-reviewed papers. The detailed information for each entry, such as supporting experimental protocols, BLAST-based phylogenetic analysis of sRNA-mRNA target interaction in closely related bacteria, predicted secondary structures for both sRNAs and their targets, and available binding regions, is provided as accurately as possible.
16
This database also provides hyperlinks to other databases including GenBank, SWISS-PROT, and MPIDB.
GEO
GEO [27] (http://www.ncbi.nlm.nih.gov/geo/) repository at the National Center for Biotechnology Information (NCBI) archives and freely disseminates microarray and other forms of high-throughput data generated by the scientific community. The database has a minimum information about a microarray experiment (MIAME)-compliant infrastructure that captures fully annotated raw and processed data. Several data deposit options and formats are supported, including web forms, spreadsheets, XML and Simple Omnibus Format in Text (SOFT). In addition to data storage, a collection of user-friendly web-based interfaces and applications are available to help users effectively explore, visualize and download the thousands of experiments and tens of millions of gene expression patterns stored in GEO. This paper provides a summary of the GEO database structure and user facilities, and describes recent enhancements to database design, performance, submission format options, data query and retrieval utilities.
2.3 The specific aim of data integration of sRNAs
Survey results indicate that the increased investigations of important regulatory roles for sRNAs encoded far from their targets, acting on multiple targets, or both, has expanded interest in how to find such regulatory RNAs and how they work [28]. Besides, it is important to understand the transcriptional regulation of small RNAs. Therefore, in order to facilitate the researches of sRNAs, such as the transcriptions of sRNAs, the expressions of sRNAs and the regulations of sRNAs, the comprehensive resource17
concerning the annotation of small non-coding RNAs is crucial. Therefore, we present an integrated database, namely sRNAMap, to collect the annotations of the sRNAs and the biomacromolecules interactions of the sRNAs via a literature survey and by integrating a variety of biological databases, such as EcoCyc, RegulonDB, ASAP, NONCODE, NPInter and sRNATarBase. The concept of the sRNAMap is illustrated in Figure 4. At present we have collected the experimental verified sRNA genes in seventy microbial genomes. Among these, the Escherichia coli, Strain K-12 MG1655 is the major part of the sRNAMap and has the maximum number of the sRNAs and the abundance annotations. We also integrate the computational identified sRNA genes and the computational identified relations between sRNAs and regulators or sRNAs and targets in the prerequisite qualification for these computational identified data have been published in journal. Beside, sRNAMap also provides the expression profiles of sRNAs, graphical representations of sRNAs, cross-species comparisons and the transcription start sites of sRNAs. Based on these data, various query interfaces and graphical visualization pages wereimplemented to facilitate access to data and further analysesto support research on sRNAs.
The main contribution of this work is to centralize the dispersed information related the small RNAs from literature and databases. For example, gene annotations, the expression environments of sRNAs, the expression profiles of sRNAs, the cross-links to other biological databases, and so on. We collect not only experimental verified data but also computational identified data. Moreover, the positions of transcription start site and the regulation schematic are also provided if researchers are interesting in the transcription of sRNAs and the regulation of sRNAs. Finally, various graphical interface and search functions were designed and implemented to facilitate data access of sRNAMap.
18
2.4 Materials and methods
The data generation flow of the sRNAMap database is depicted in Figure 5. The data generation flow comprises the two main parts: (1) integration of external data sources; (2) integration of annotated tools. The detailed descriptions are provided below.
Figure 5 The data generation flow of sRNAMap.
2.4.1 Integration of external data sources
We collect the sRNA annotations from most famous databases. For example, RegulonDB, ASAP and NONCODE. They provide the regular information of sRNAs such as the name,
19
the synonyms, the positions, the strand, the brief descriptions, and so on. Furthermore, the sRNA interaction information were integrated from EcoCyc, RegulonDB, NPInter and sRNATarBase. As given in Table 5, 908 sRNAs are obtained from databases. Only 122 experimentally validated relations collected.
In addition to collecting from database, we also gather the sRNA information from literatures. From the literatures, we can derive not only the regular information same with the information from database but also the additional information. This additional information includes the transcriptional mechanisms and the present conditions of small RNAs is important, necessary and useful. In this step, data processing and data integrating are assembled by curators. The redundant data were filtered.
Besides the collection of the experimental verified sRNA genes, the transcriptional regulators of sRNAs and the sRNA targets, the computational identified data in the prerequisite qualification for these data have been published in journal are also collected. We supplement computational identified data by the secondary structures, cross-species comparisons and expression profiles. This can provide the users more viewpoints or discovering novel information. As given in Table 2, 308 computational identified sRNAs are obtained from literatures [29, 30]. Only 114 computational identified relations collected [31, 32].
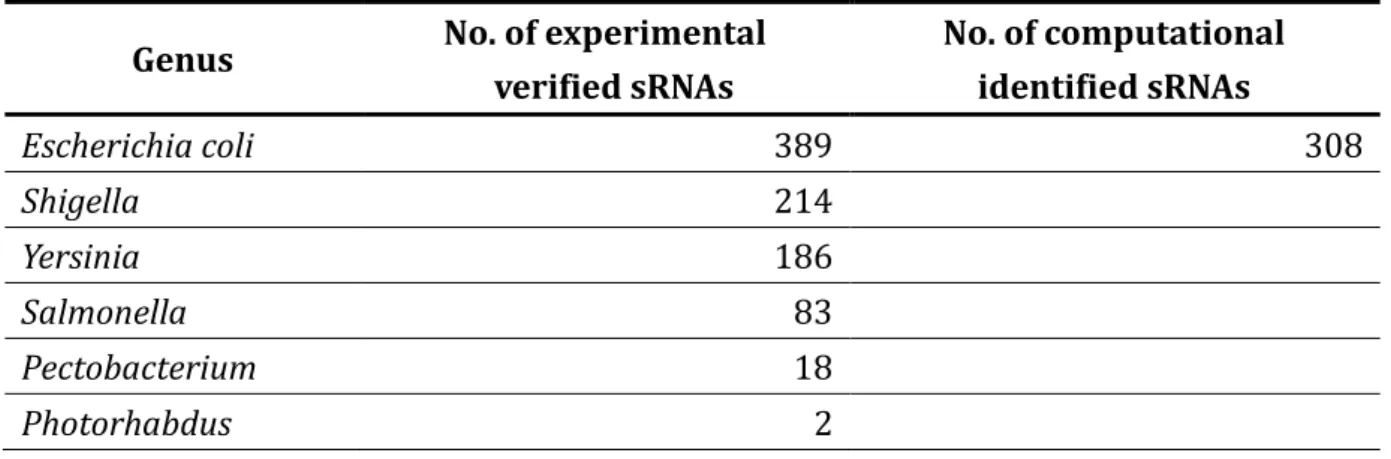
Table 2 The statistics of small non-coding RNAs in sRNAMap.
Genus No. of experimental verified sRNAs No. of computational identified sRNAs Escherichia coli 389 308 Shigella 214 Yersinia 186 Salmonella 83 Pectobacterium 18 Photorhabdus 2
20
Enterobacter 4
Klebsiella 10
Serratia 2
2.4.2 Integration of annotated tools
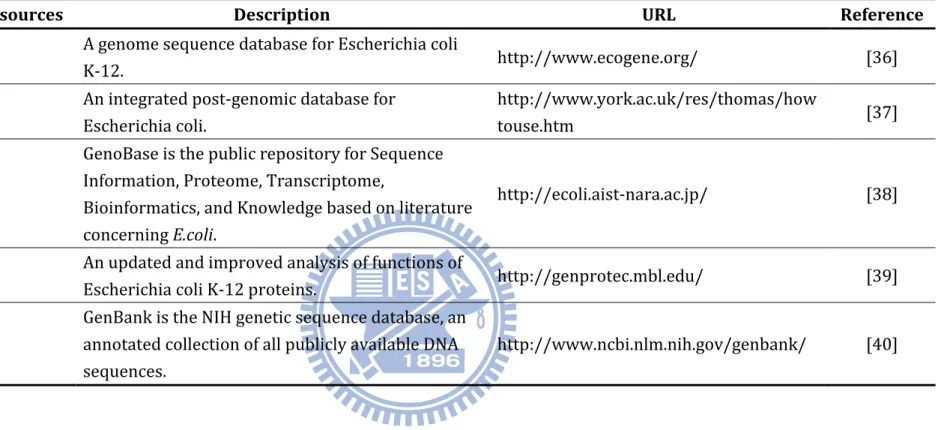
Gene Expression Omnibus (GEO) is a database repository of high throughput gene expression data and hybridization arrays, chips, microarrays. Some experiments treat the roles of sRNAs and some expression profiles contain the known sRNAs in a variety of conditions. UCSC Archaeal Genome Browser is a popular web-based tool for quickly displaying a requested portion of a genome at any scale, accompanied by a series of aligned annotation "tracks" [33]. RNALogo [34] and RNAfold [35] function to provide RNA secondary structure. RNALogo presents a novel graphical representation of the patterns in an aligned RNA sequences with a consensus structure. Aside from the basic information of the sRNAs, we also integrate the expression profiles, the cross-species comparisons, the secondary structure of the sRNAs and the cross-links to other biological databases. The linked external data sources and the integrated annotated tools list in Table 3 and Table 4, respectively.
21
Table 3 The list of the linked external data sources.
External data sources Description URL Reference
EcoGene A genome sequence database for Escherichia coli
K-12. http://www.ecogene.org/ [36]
EchoBASE An integrated post-genomic database for Escherichia coli.
http://www.york.ac.uk/res/thomas/how
touse.htm [37]
GenoBase
GenoBase is the public repository for Sequence Information, Proteome, Transcriptome,
Bioinformatics, and Knowledge based on literature concerning E.coli.
http://ecoli.aist-nara.ac.jp/ [38]
GenProtEC An updated and improved analysis of functions of
Escherichia coli K-12 proteins. http://genprotec.mbl.edu/ [39] GenBank
GenBank is the NIH genetic sequence database, an annotated collection of all publicly available DNA sequences.
http://www.ncbi.nlm.nih.gov/genbank/ [40]
22
Integrated Tools Description URL Reference
UCSC Archaeal Genome Browser
A popular Web-based tool for quickly displaying a
requested portion of a genome at any scale, accompanied by a series of aligned annotation "tracks".
http://archaea.ucsc.edu/ [33] RNALogo A new approach to display structural RNA alignment. http://rnalogo.mbc.nctu.edu.tw/ [34] RNAfold
A web server predicts minimum free energy structures and base pair probabilities from single RNA or DNA sequences.
http://rna.tbi.univie.ac.at/cgi-bin/RNAfol
d.cgi [35]
23
2.5 Results
2.5.1 Database Statistics
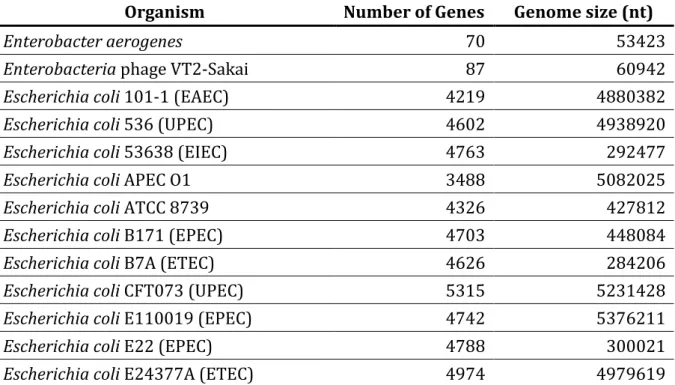
The sRNAMap currently collects 908 sRNAs in seventy microbial genomes. The detailed list of genome is given in Table 5. We categorize the sRNAs by type of species, as given in Table 2. The number of experimentally validated sRNA genes in E.coli, Shigella, Yersinia,
Salmonella, Pectobacterium, Photorhabdus, Enterobacter, Klebsiella and Serratia are 389,
214, 186, 83, 18, 2, 4, 10 and 2, respectively.
Table 6 gives the length distribution of the total known sRNA genes. Analysis of the size distribution of the sRNAs shows that are between 50 and 500 nts. In the Escherichia coli K-12 MG1655, 30 sRNAs have absolute position of transcription start sites and 33 sRNAs have 49 potential transcription start sites, as shown in Table 7. In the case of regulation, the total number of relations between sRNAs and regulators or sRNAs and targets is 122.
Table 5 The list of the microbial genomes used in this work.
Organism Number of Genes Genome size (nt)
Enterobacter aerogenes 70 53423
Enterobacteria phage VT2-Sakai 87 60942
Escherichia coli 101-1 (EAEC) 4219 4880382
Escherichia coli 536 (UPEC) 4602 4938920
Escherichia coli 53638 (EIEC) 4763 292477
Escherichia coli APEC O1 3488 5082025
Escherichia coli ATCC 8739 4326 427812
Escherichia coli B171 (EPEC) 4703 448084
Escherichia coli B7A (ETEC) 4626 284206
Escherichia coli CFT073 (UPEC) 5315 5231428
Escherichia coli E110019 (EPEC) 4742 5376211
Escherichia coli E22 (EPEC) 4788 300021
24
Escherichia coli EDL933 (EHEC) 5356 5528423
Escherichia coli F11 (UPEC) 2794 465383
Escherichia coli HS 4359 4643538
Escherichia coli K-12 DH10B 4158 4686137
Escherichia coli K-12 MG1655 4578 4639675
Escherichia coli K-12 plasmid F 104 99159
Escherichia coli K-12 W3110 4182 4646332
Escherichia coli O157:H7 strain RIMD
0509952 5041 5498450
Escherichia coli plasmid pCoo (ETEC) 95 98396
Escherichia coli plasmid pMAR7 (EPEC) 114 101558
Escherichia coli Sakai (EHEC) 5484 5498450
Escherichia coli UTI89 (UPEC) 5170 5065741
Klebsiella pneumoniae 5307 5315120
Pectobacterium atrosepticum SCRI1043 4439 5064019
Photorhabdus luminescens TTO1 4656 5688987
Salmonella Choleraesuis SC-B67 4638 4755700
Salmonella enterica subsp. arizonae 4700 4600800
Salmonella Paratyphi A ATCC 9150 4071 4585229
Salmonella Typhi CT18 4727 4809037
Salmonella Typhi Ty2 4300 4791961
Salmonella Typhimurium LT2 4513 4857432 Serratia proteamaculans 568 4917 5448853 Shigella boydii 227 4283 4519823 Shigella boydii BS512 4706 411533 Shigella dysenteriae 1012 2766 450660 Shigella dysenteriae 197 4479 4369232 Shigella flexneri 2457T 4325 4599354 Shigella flexneri 301 3063 4607203 Shigella flexneri 8401 4094 4574284 Shigella sonnei 046 1358 4825265
Yersinia bercovieri ATCC 43970 3560 4301412
Yersinia enterocolitica 8081 4031 4615899
Yersinia frederiksenii ATCC 33641 4147 4845578
Yersinia intermedia ATCC 29909 3865 4677210
Yersinia mollaretii ATCC 43969 3730 4527725
25
Yersinia pestis Angola 3679 144150
Yersinia pestis Antiqua 4349 4702289
Yersinia pestis B42003004 3885 903826
Yersinia pestis CA88-4125 4105 1676077
Yersinia pestis CO92 4093 4653728
Table 6 Length distribution of the total experimental verified sRNA genes.
<100 100~200 200~300 300~400 400~500
No. of sRNAs 334 436 68 58 12
Table 7 Transcription start site distribution of the experimental verified sRNA genes in
Escherichia coli K-12 MG1655.
Type 1 Type 2 Type 3 Type 4 Type 5
No. of TSS 30 0 7 42 10
No. of sRNAs 30 0 5 28 10
Type 1: the sRNA has its own transcription start sites; Type 2: the sRNA belongs to the transcription unit and shares the transcription unit’s transcription start sites; Type 3: the sRNA resides in intergenic region of the transcription unit and maybe shares the transcription start sites of the transcription unit; Type 4: the length between the sRNA and the transcription start sites which don’t be included in front types is less 4000nt; Type 5: the literatures say the sRNA has transcription start sites but don’t tell us where is it.
2.5.2 Data Comparison
Table 8 gives the comparison of sRNAMap to other visible recourses including EcoCyc, RegulonDB, ASAP, NONCODE, NPInter, sRNATarBase and Storz et al.. We can find that the sRNAMap has the maximum number of the sRNAs and the abundance annotations. It also provides more additional function to facilitate the understanding the transcriptions
26
of the sRNAs. For example, the secondary structure of sRNAs, the expressed conditions of sRNAs, the expression profiles of sRNAs, the transcription start sites of sRNAs and the network visualization. Besides the above, we also provide computational identified data to give the researches to discover novel sRNAs or targets. In summary, the sRNAMap provides more plentiful information of sRNAs than other recourses.
27
Table 8 Comparing sRNAMap with other resources. EcoCyc [21] RegulonDB [22] ASAP [23] NONCODE [24] NPInter [25] sRNATarBas [26] Storz et al. [7] sRNAMap No. of sRNAs 79 79 881 134 103 69 79 908 No. of relations Regulators - sRNAs 16 16 0 0 50 - 9 62 sRNAs - Targets 55 45 0 0 43 140 0 181
No. of species supported 1 1 59 21 1 17 1 70
Computational sRNAs
supported - - - Yes
Computational relations
supported - - - Yes
Secondary structure of sRNAs - - - Yes - Yes
Transcription start site of
sRNAs 1 type 1 type - - - 5 types
Expression profiles supported - - - Yes
Network visualization Regulators
- sRNAs - - - - -
Regulators – sRNAs
sRNAs - Targets
28
2.5.3 Interface
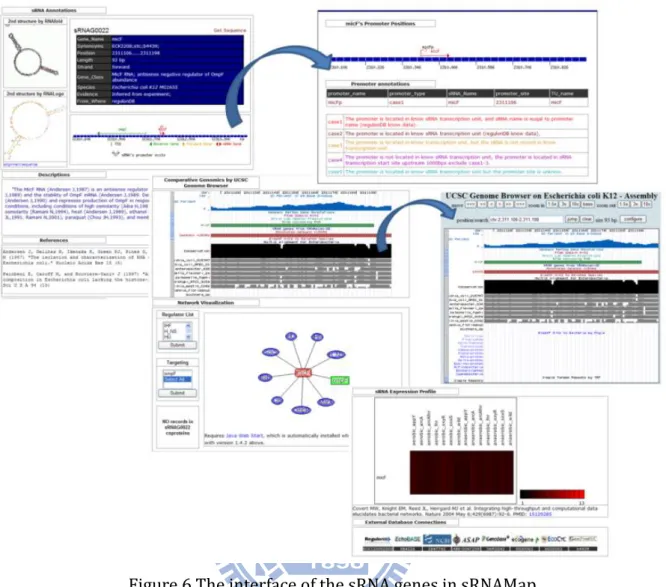
The sRNAMap devised a variety of query interfaces and graphical visualization pages to facilitatethe analysis for the sRNA research. For searching the sRNA information, we provide the two searching modes, such as the keyword search engine and the sequence search engine. Users can input some keywords or submit a sequence by inputtinga single sequence in FASTA format. In the sequence search engine, the sRNAMap compares nucleotide sequences to sRNA databases and calculates the statistical significance of matches to help identify members of sRNA gene families. Keyword search engine is an alternative searching method. sRNAMap will search all pages base on keywords and then show the pages contain keywords. The sRNA gene page will provide the sequence, the location, the promoter information, the secondary structure, literature citations, gene annotations, expression profiles, the conserved sequences from UCSC Archaeal Genome Browser and the network visualization. It is unusual for sRNAMap to provide the known present conditions of the sRNA genes. Similar to the sRNA gene page, the regulator page or the target page provide the brief information for regulator or target. Additionally, the sRNAMap has the regulation page and the targeting page which provide the experiment conditions and the relationship between the sRNAs and the regulators and the sRNAs and the targets, respectively. Figure 6 is the interface of the sRNA genes in sRNAMap and Figure 7 is the interface of the sRNA relations in sRNAMap.
Moreover, the sRNAMap provides five browse functions for data access, such as the genome browser, the network browser, the expression profile browser, the computational sRNAs browser and the literature record browser. Users can use differential viewpoints to browse the sRNAMap. As depicted in Figure 8, the browse view facilitates the browse of the sRNA genes or regulations.
29
30
31
32
2.6 Summary
We established the sRNAMap for sRNAs. This database is made to support sRNA annotations including the sRNA genes, the transcription regulators of sRNAs and sRNA targets and the regulations between regulators and sRNAs or sRNAs and targets in
Escherichia coli and in other bacteria. Besides, we also provide expression profiles and
the cross-species comparisons which can be used to identify the sRNA genes or targets. If the researchers want to understand or discover the synthesis of non-coding RNAs, the transcription start sites and the presentational environments of the sRNAs are provided. Among the transcription start sites, we bring up five types of the transcription start sites. First, the sRNA has its own transcription start sites; second, the sRNA belongs to the transcription unit and shares the transcription unit’s transcription start sites; third, the sRNA resides in intergenic region of the transcription unit and maybe shares the transcription start sites of the transcription unit; fourth, the length between the sRNA and the transcription start sites which don’t be included in front types is less 4000nt; final type is the literatures say the sRNA has transcription start sites but don’t tell us where is it. Figure 9 is the schematic diagram for the transcription start sites. We hope this database can provide sufficient information for any sRNAs related researches.
33
Figure 9 The promoter types of the sRNA in sRNAMap.
34
Chapter 3 Prediction of cAMP-CRP
dependent small non-coding RNAs
3.1 Introduction
For gene regulation, the various regulation mechanisms are studied at the transcriptional, posttranscriptional and translational level. In transcriptional label, RNA polymerase recognizes and specifically binds to the promoter region on DNA and additional proteins, such as general transcription factors and gene regulatory proteins, bind to regions of promoter and enhancer sequence elements either through direct binding to DNA or through binding other DNA-bound proteins. When everything has been prepared, transcription will start. Finally, RNA will be produced.
In Escherichia coli, cAMP receptor protein, CRP, also called catabolite gene activator protein, CAP, is the first purified, the first crystallized and the best studied transcription activator , and plays a key role in activation of a number of the genes for utilization of carbon sources other than glucose [42]. The binding of cyclic AMP to CRP causes conformational changes that enable the protein to bind to specific DNA sequences and interact with RNA polymerase [43], as shown the complex structure in Figure S4. The cAMP-CRP complex regulates several hundred genes, even small non-coding RNA. Until now, there were only two CRP regulated sRNAs have been reported in E. coli. The first one is Spf RNA. When glucose is low, the activated cAMP-CRP complex represses transcription of the Spf RNA [44]. Another is CyaR sRNA. CyaR is positively regulated by the global regulator Crp under conditions in which cyclic AMP levels are high [18].
35
3.1.1 Computational approach for motif discovery
HMMER
HMMER [45] (http://hmmer.janelia.org/) a new generation of sequence homology search software. Methods are available for searching either a single protein sequence, multiple protein sequence alignment or profile HMM against a target sequence database, and for searching a protein sequence against Pfam. It implements methods using probabilistic models called profile hidden Markov models (profile HMMs).
MATCH
MATCH [46] (http://www.gene-regulation.com/pub/programs.html#match) is a tool for searching transcription factor binding sites in DNA sequences. Match is a weight matrix-based tool for searching putative transcription factor binding sites in DNA sequences. Match is closely interconnected and distributed together with the TRANSFAC database.
3.1.2 Experimental approach for quantifying the
binding of proteins to specific DNA regions
An electrophoretic mobility shift assay (EMSA) or mobility shift electrophoresis, also referred as a gel shift assay, gel mobility shift assay, band shift assay, or gel retardation assay, is a common affinity electrophoresis technique used to study protein:DNA/RNA interactions [47]. This procedure can determine if a protein or mixture of proteins is capable of binding to a given DNA or RNA sequence, and can sometimes indicate if more than one protein molecule is involved in the binding complex based on differences in their electrophoretic mobilities in polyacrylamide gels. The overview of EMSA is shown
36
in Figure S5.
3.2 Related works
Identification of TFs binding sites is a field that has evolved quite rapidly in the past years. Computational approaches, mostly sequence-based, are generally designed to solve two related issues: (1) For a given set of sequences that harbor the binding sites of a particular TF, find the location of the sites; and (2) For a given set of known binding sites, develop a representation of their binding signature, and use it to scan new sequences for additional binding sites [48]. Table 9 is an overview of methods involved in TFBS discovery.
37
Table 9 Bioinformatics tools for discovery of TFBSs/motif (Sacha, 2009).
TFBS/motif discovery
tools Description URL Reference
MEME Motif discovery algorithm http://meme.sdsc.edu/ [49] AlignACE Motif discovery algorithm http://atlas.med.harvard.edu/ [50] MDScan/BioProspector Motif discovery algorithm http://seqmotifs.stanford.edu/ [51] Consensus Motif discovery algorithm ftp://www.genetics.wustl.edu/pub/stormo/Consensus/ [52] PhyloCon Motif discovery algorithm http://ural.wustl.edu/~twang/PhyloCon/ [52] PhyloGibbs Motif discovery algorithm http://www.phylogibbs.unibas.ch [53]
RSAT
Large series of regulatory analysis tools, containing oligonucleotide and dyad analysis
http://rsat.ulb.ac.be/rsat/ [54] SCOPE Ensemble motif discovery tool http://genie.dartmouth.edu/scope/ [55] MotifVoter Ensemble motif discovery tool http://compbio.ddns.comp.nus.edu.sg/~edward/MotifVoter2/ [56] rVista Phylogenetic footprinting tool http://rvista.dcode.org/ [57]
38
MEME
MEME [49] (http://meme.sdsc.edu/) is a tool for discovering motifs in a group of related DNA or protein sequences. A motif is a sequence pattern that occurs repeatedly in a group of related protein or DNA sequences. MEME represents motifs as position-dependent letter-probability matrices which describe the probability of each possible letter at each position in the pattern. Individual MEME motifs do not contain gaps. Patterns with variable-length gaps are split by MEME into two or more separate motifs.
AlignACE
AlignACE [50] (http://atlas.med.harvard.edu/) is a motif-finding algorithm. Whole-genome mRNA quantitation can be used to identify the genes that are most responsive to environmental or genotypic change. By searching for mutually similar DNA elements among the upstream non-coding DNA sequences of these genes, they can identify candidate regulatory motifs and corresponding candidate sets of coregulated genes.
MDScan
MDScan [51] (http://robotics.stanford.edu/~xsliu/MDscan/) is a fast and accurate motif finding algorithm with applications to chromatin immunoprecipitation microarray experiments. They introduce a computational method, Motif Discovery scan (MDscan), that examines the ChIP-array-selected sequences and searches for DNA sequence motifs representing the protein-DNA interaction sites. MDscan combines the advantages of two widely adopted motif search strategies, word enumeration and position-specific weight matrix updating, and incorporates the ChIP-array ranking information to accelerate searches and enhance their success rates.
39
BioProspector
BioProspector [51] (http://robotics.stanford.edu/~xsliu/BioProspector/) is the discovering conserved DNA motifs in upstream regulatory regions of co-expressed genes. BioProspector, a C program using a Gibbs sampling strategy, examines the upstream region of genes in the same gene expression pattern group and looks for regulatory sequence motifs. BioProspector uses zero to third-order Markov background models whose parameters are either given by the user or estimated from a specified sequence file.
PhyloCon
PhyloCon [52] (http://ural.wustl.edu/~twang/PhyloCon/) is the phylogenetic consensus for regulatory motif identification. PhyloCon takes into account both conservation among orthologous genes and co-regulation of genes within a species. This algorithm first aligns conserved regions of orthologous sequences into multiple sequence alignments, or profiles, then compares profiles representing non-orthologous sequences. Motifs emerge as common regions in these profiles.
PhyloGibbs
PhyloGibbs [53] (http://www.phylogibbs.unibas.ch) is an algorithm for discovering regulatory sites in a collection of DNA sequences, including multiple alignments of orthologous sequences from related organisms. Many existing approaches to either search for sequence-motifs that are overrepresented in the input data, or for sequence-segments that are more conserved evolutionary than expected. PhyloGibbs combines these two approaches and identifies significant sequence-motifs by taking both over-representation and conservation signals into account.
40
RSAT
RSAT [54] (http://rsat.ulb.ac.be/rsat/) is a regulatory sequence analysis tools. The suite includes programs for sequence retrieval, pattern discovery, phylogenetic footprint detection, pattern matching, genome scanning and feature map drawing. Random controls can be performed with random gene selections or by generating random sequences according to a variety of background models (Bernoulli, Markov).
SCOPE
SCOPE [55] (http://genie.dartmouth.edu/scope/) is an ensemble of programs aimed at identifying novel cis-regulatory elements from groups of upstream sequences. The SCOPE motif finder is designed to identify candidate regulatory DNA motifs from sets of genes that are coordinately regulated. SCOPE motif finder uses an ensemble of three programs behind the scenes to identify different kinds of motifs - BEAM identifies nondegenerate motifs (e.g. ACGTGC), PRISM identifies degenerate motifs (e.g. AWCGRYH), and SPACER identifies bipartite motifs (e.g. ACCNNNNNNNNNGTT).
MotifVoter
MotifVoter [56] (http://compbio.ddns.comp.nus.edu.sg/~edward/MotifVoter2/) a variance based ensemble method for discovery of binding sites. Though the existing ensemble methods overall perform better than stand-alone motif finders, the improvement gained is not substantial.
rVista
rVista [57] (http://rvista.dcode.org/) is the evolutionary analysis of transcription factor binding sites. rVISTA attempts to fill this great gap in genomic analysis by offering a
41
powerful approach for eliminating TFBSs least likely to be biologically relevant. The rVISTA tool combines TFBS predictions, sequence comparisons and cluster analysis to identify noncoding DNA regions that are evolutionarily conserved and present in a specific configuration within genomic sequences.
3.3 Motivation and the Specific Aim
Small RNAs (sRNAs) play important roles in cellular physiology in organisms from all domains of life. About 80 small RNAs have been reported in Escherichia coli and their synthesis is induced by various conditions and regulators. cAMP receptor protein (CRP) is a part of well-understood transcription regulator which regulates about 200 coding genes. Until now, however, CRP reported to regulate only 2 non-coding sRNA genes. To provide the complete and correct information of the CRP regulated non-coding sRNAs, it is necessary to screen all sRNAs. In this study, we report here the bioinformatics prediction and transcriptome analyses of expressed sRNAs that are subject to activation or repression mediated by CRP.
3.4 Materials and methods
The basic idea of this research was illustrated in Figure 10. First, we constructed and applied model to identify CRP regulatory sites on the promoter of sRNAs. Then the sRNAs’ promoter binding assays and expressions were provided by EMSA and sRNAs focused array, respectively. These could find the CRP-regulated sRNAs and help to adjust the cutoff value of prediction model.
42
Figure 10 The Flowchart of the computational and experimental steps used for genome-wide analysis of CRP-regualted sRNA genes.
3.4.1 Constructing of positive dataset and prediction
model
From EcoCyc, the non-redundant CRP regulatory sites are supported by the experiment of “Binding of cellular extracts”, “Binding of purified proteins” or “Site mutation” were used to generate the positive set. To reduce the effect from the error of data source, the
43
CRP-binding sites were aligned with ClustalW [58]. For construction of the prediction model, the HMM profile and CRP weight matrix were built from the positive set using
hmmbuild in the HMMER package 3.0 programs [45] and matrix2lib in the program
MATCH [46]. Subsequently, we have applied hmmsearch and match to estimate the score of every sequence in data set and determined the cut-off to advance performance of the predictor. After deciding the cutoff score, the model is used to identify the regulatory sites within the input small RNA promoter regions (-500 and 100 regions) relative to start position from the sRNA in sRNAMap. A search of a model with the score greater than the threshold 6.0 is defined as a positive prediction.
3.4.2 Escherichia coli 0.155 K Custom Small RNA Array
In order to measure the expression levels of sRNAs, our cooperator (Dr. Tseng’s Lab) design a powerful, efficient and multi-functional tool – Escherichia coli 0.155 K Custom Small RNA Array (GEO platform GPL10535). The probe sequences for sRNAs are designed by Array Designer 4.25. They are synthesized oligonucleotides of 46~50mer in length, except probes for dsrA and sokA in 37 and 30-mer, respectively. These probes are clarified into 4 groups. They are individually against 5 exogenous genes from Arabidopsis thaliana, 17 stable-expressing genes as internal control, 3 random sequences as negative control and 81 genes coding for sRNAs.
3.4.3 Microarray data analysis
To determine if the sRNA were expressed differently depending on the absent of cAMP receptor protein (CRP), we use Escherichia coli 0.155 K Custom Small RNA Array to examin RNA levels in wild-type cells BW25113 and crp mutant JW5702. Image analysis and extraction of the signal intensities were achieved using the GenePix software. We
44
use the stable-expression genes (yebK, polA, motB, yihA and serW) to normalize all array intensities and then the probe intensities bellow 64 were set to 64. In descriptive statistics, Q1 and Q3 represent the lower quartile, and upper quartile value. For each gene of nine probes, the intensities fall below Q1-1.5(Q3-Q1) or above Q3+1.5(Q3-Q1) were removed and the remaining intensities were averaged. The fold-change and a t-statistic were used to identify significantly regulated genes. A cutoff of 1-fold up- or down-regulation was chosen to define differential expression with a P-value of < 0.05.
3.5 Results
We report here the bioinformatics prediction and transcriptome analysis of expressed small RNAs that are subject to activation or repression mediated by cAMP receptor protein.
3.5.1 Strategy for the construction of prediction model
Using data available from EcoCyc (http://ecocyc.org/), we retrieved 311 CRP cis-elements. For 54 of 311 elements no position information or redundant position and 92 elements no experimental support were divided. Finally, a set of 165 CRP cis-elements was aligned with ClustalW and used to construct the model. In order to filter significant matches out of the high amount of possible matches, the appropriate cut-off selection is very important. For this purpose, we apply model to estimate the score of every sequence and select cutoff value which allow the recognition of 90% of 165 CRP binding sites in positive set. Our cutoff score was set at 6.0.
45
3.5.2 Identification of CRP binding sites on sRNAs
promoter region
We consider 82 sRNAs in Escherichia coli K12 and get the sequences between -500 and 100 regions of these sRNAs from sRNAMap. Through computational identification, there are 67 sites satisfied the cut-off score. If the sites cover each other, they would be merged and the best one would be selected. Ultimately, we have found 51 cAMP-CRP complex binding sites on 35 identified sRNAs’ promoter region. Five sRNAs (DicF, RyeB, GlmZ, RyfB and MicA) have weak affinity binding sites for CRP and the prediction scores of these sites are near the cutoff. Among 51 sites, the three experimental CRP binding sites at spf [59], cyaR [18] and fnrS [60] genes are identified. This confirms that our prediction model was reasonable. Table 10 shows the detailed result of identification of CRP binding sites on sRNAs promoter region. In the validation status, “Y”, “W”, and “X” represent high-affinity CRP binding sites, low-affinity CRP binding sites and no CRP binding sites in the EMSA reaction, respectively. Our cooperator also validates the binding sites those binding scores fall below cut-off score.
Table 10 The detailed result of identification of CRP binding sites on sRNAs promoter region.
sRNA Location Score Sequence Validation
isrB -61 9.924999 TTATGTGATTTGTATCACATAA Y rseX -191 9.870999 TTATGTGATAAAAGTCACATTT Y dsrA -97 8.7655 AGGGGTGACGTGCGTCACATTT Y rydB -481 8.174001 GTTTGTGCTGTTCGTCACGATT Y rybB -198 8.048 ATCAGTGATACAGCTCGCAGTA Y csrC -123 7.9515004 TTCTGCGATGCATGTCAAATAA Y C0299 -111 7.8000007 TAATATGATAAATATCAAACAA Y C0362 -480 7.5140004 CATTGCGATTTTCGTCGCACTG Y
46
isrA -4 7.5095005 TTTCGTGAAATCTGTCACTGAA Y isrC -77 7.3935003 GACTCTGAGTCTGCTCACAAAA Y arcZ -211 7.1150002 CTGCGTGAAATAGCTAACAACG Y spf -94 7.0899997 TTTTGTGATGGCTATTAGAAAT Y rttR -267 7.0150003 GATTGTGAAAGTTTGCACTCAT Y cyaR -50 6.9690003 TTCTTAGAAACCGATCACATAC Y ryeA -84 6.9140005 TCCCGCGCTAAAGATCACATAA Y gcvB -238 6.9065003 TACTGCGGCTTGGGTCACAAAA Y sroA -472 6.894 ACCTTTTATCAGGATCACAGTG Y ssrS -91 6.7629995 TTACTTGAACAAGGTCGCATCA Y ryhB 32 6.654 AAGCACGACATTGCTCACATTG Y tff -337 6.637 AGATGCGATCCAGCTCGCCGGT Y rnpB -461 6.5625005 TGATGTGAAAGATGTCCCCGGT Y C0343 -286 6.5025 AAGTTTGAGCGAAGTCAATAAA Y fnrS -52 6.5025 AAGTTTGAGCGAAGTCAATAAA Y csrB -202 6.499 GGTTGTGAGAGATCTCTTACAG Y sokC -101 6.4709997 GGCGGTGATACAGATGACGATC Y sroH -275 6.3554997 ATCTGGGACGCGCCTCGCAAAG Y micM -298 6.3385 CAAGGTGTTTCATATCACCGTT Y C0719 -413 6.287 GTCGGTGATGGAGATAACCGAG Y ryfD 20 6.2410007 GCGTGATTTTCTTTTCACATTA Y dicF 67 6.2390003 TTTTGTGATGTGGTGAATGCGG W sraF 40 6.224 CGATGTGTGAAAAAACACATCC Y ryeB -157 6.0845 CAGATTGATGATCCTAACAATC W glmZ -370 6.0509996 AATTGAGATCCCTCTCCCTGAC W ryfB -459 6.0385 TGCTGTGAAAGAAGCCGCAGCA W micA 12 6.0365005 ATTTGTTATCATCATCCCTGAA W symR 24 5.9825 AATAGTGATTGTGATTAGCGAT X
rydC -85 5.9125 TCGGGTGAATTGATTAAAAATA W istR-1 -87 5.9030004 AACTGTGATCGATACTCAACTA X
psrD -185 5.8685 TTAAATGATCCGGATAACGTGA sroC -109 5.8640003 GTTTGATAAGTGGTTCAAAAAT rybA -475 5.836 CTATCTGATGTCGCTCGCGGCT
tpke70 -308 5.7755 CATAAAGAAATATTTCACTTTA X C0293 -290 5.7710004 TTTTGTTAGGCTGCTAACGGTT
sroD -13 5.7690005 TTTTGCGACGAGAATTACGTGA sibA -392 5.7475004 CACCGGGCCGAACGTCACAATG