Development and Application of a Three-Dimensional GIS-Based Data and Information Visualization Environment
7
0
0
全文
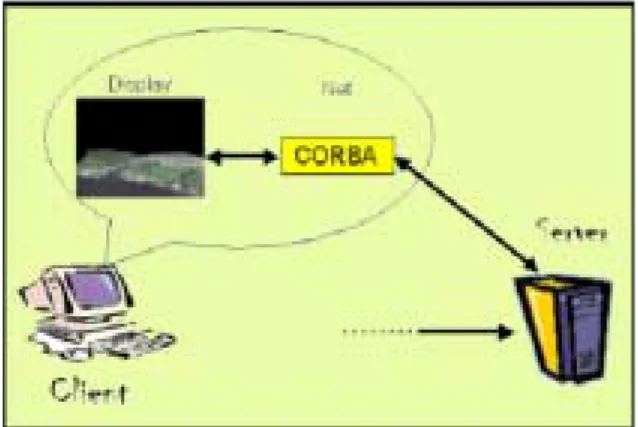
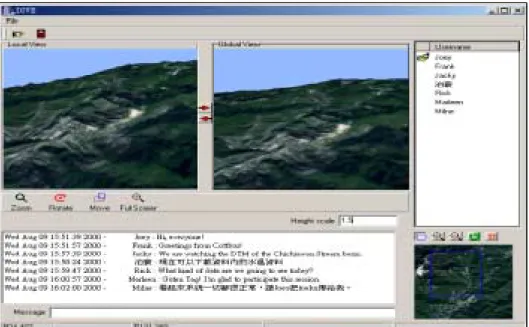
(2) uses the DTM (digital terrain model) as an. distributed collaboration as well as interactions.. infrastructure to present and visualize the. The system has been applied to the study and. geo-referred data and information, such as data,. visualization of tidal flows of Tamshui River,. text, image, audio/video, animation, and other. Taiwan [11]. DIVE basically consists of two. multimedia, in a three-dimensional virtual world.. components: the display module and net module,. We used the data and information of the study of. as illustrated in Figure 1. We employed OpenGL. population ecology of Formosan landlocked. for. salmon [1] to demonstrate the functions and. three-dimensional terrain model as well as the. features of the DBVE.. associated physical behavior of the system in the. Introduction and application of DIVE. rendering. and. navigating. the. display module, and CORBA (Common Object. Visualization. Request Broker Architecture) for distributed. Environment), which designed for visualization. communications between the clients and server. in the three-dimensional virtual world and. in the net module.. (Distributed. distributed. and. Interactive. collaboration,. is. introduced. in. Section 2. The GIS-based DBVE (Database Visualization Environment), which is a module of DIVE, and its implementation are given in Section 3. The applications of DBVE are illustrated. in. Section. 4.. Based. on. the. demonstrations, some concluding remarks are made in the final Section.. 2. Distributed and Interactive Visualization Environment. Figure 1. Architecture of Distributed and Interactive Visualization Environment.. DBVE is a module of the DIVE (Distributed and Interactive. Visualization. for. SPOT satellite image were processed to generate. the. the three-dimensional terrain model of the study. geo-referred data and information in the. area, Chichiawan Stream basin, as depicted in. three-dimensional virtual world via remote. Figure 2. Application of DIVE for Chichiawan. DBMS (database management system). DIVE. Stream basin was presented in Figure 3.. (Distributed. Visualization. Interface of DIVE showed that it contains of. developed,. logging in, file managing, exchanging of the. Windows-based networked visualization system. token, generating 3D object from 2D image,. [9, 10]. The early version of DIVE does not. chatting, zooming and navigation functionalities,. support the access of DBMS. It supports the. two views (local and global) of the current. visualization and navigation of terrain model. scene, and a list of the session participants.. and. the. Local window denoted the state of view for the. three-dimensional virtual world, and supports. local user, and global window the updated state. presentation. and. and. Environment). associated. is. Environment). The DTM (digital terrain model) data and. visualization. Interactive an. in-house. geo-referred. of. data. in.
(3) of view for all users. Users could visualize,. engineering projects. This innovative GIS-based. explore, gain insight, interact and collaborate. visualization system leads to the development of. with remote colleagues, and communicate their. DBVE to explore and present the geo-referred. insights to others via the Internet. Such approach. data and information in a three-dimensional. has. virtual world.. great. potential. for. visualization. and. collaboration, and therefore, can be widely applied to modern distributed science and. Figure 2.. Figure 3.. Terrain model of the study area - Chichiawan Stream basin.. Application of DIVE for the terrain model of the study area – Chichiawan Stream basin..
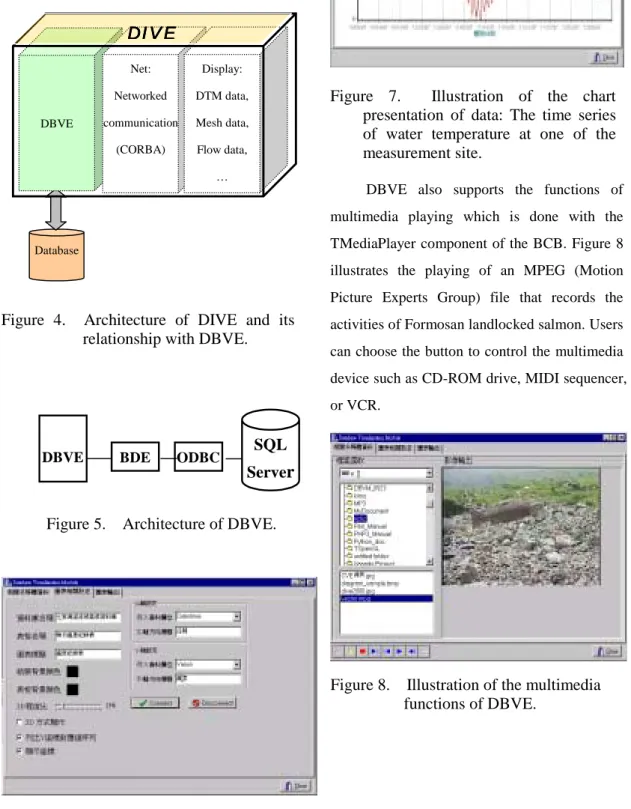
(4) 3.. Database Visualization Environment. Database. Engine). and. ODBC. (Object. Database Connection) to link the DBMS. Any. Traditional GIS supports the query and analysis. DBMS that meets the standard of ODBC can. of geo-referred data and information, and. be processed by DBVE. Figure 5 illustrates. presents the data in simple formats such as. the architecture of DBVE. DBVE connects to. charts and tables in a passive way. The. the standard interfaces, BDE and ODBC, to. presentation of data and information is, in. access SQL Sever. Users can remotely access. general, less attractive and lack of diversities as. the data and information via the SQL server,. well as interactivities. Due to the fast-changing. and present/visualize the data and information. network and multimedia technologies and. with the functions and formats of the display. advancement. graphics,. the. module of DIVE support. The data and. presentation. of. information, such as data, text, image,. information of GIS have therefore improved and. audio/video, animation, and other multimedia,. become one of an active research subjects [7]. In. are presented in a table or chart or multimedia. this study, we developed a GIS-based data and. in the three-dimensional virtual world.. exploration. information. of of. computer data. and. visualization. environment,. a. GIS-based DBVE. Contrary to classical GIS. 4.. which emphasize on data query and analysis,. Application of Database Visualization Environment. DBVE used the DTM (digital terrain model) as. The Formosan landlocked salmon is one of the. an infrastructure to present and visualize the. legally-protected endangered animals of Taiwan.. geo-referred data and information, such as data,. The small population can be found only in the. text, image, audio/video, animation, and other. Chichiawan Stream basin of the Shei-Pa. multimedia, in a three-dimensional virtual world.. National Park which locates in the upstream of. Figure 4 shows the architecture of DIVE and its. Daichia Stream. The authorities of Shei-Pa. relationship. an. National Park have persisted in population. independent module of the DIVE system. The. census of this precious species to effectively. DBMS is a standard server-client architecture. supervise and protect the relic natural treasure.. where server holds and manages the actual. Water temperature of the creek which is one of. database, and clients hold software to work with. the important indicators of the living condition. database [12]. It was designed to access the. for the Formosan landlocked salmon has been. target data of the database system, and present. recorded in the past years. We used the database. the geo-referred data and information in a. of the study [1] as an example to demonstrate. three-dimensional virtual world.. the functions and features of the GIS-based. We used Microsoft SQL Server as our back-end. DBVE.. with. DBVE.. DBVE. is. DBMS and developed the kernel of DBVE. Figure 6 depicts the interface of database. using the BCB (Borland C++ Builder).. connection and diagram setting of DBVE.. DBMS is used to store and manage the large. DBVE connects the target DBMS via DBE and. amount of data. We used DBE (Borland. ODBC. Users can navigate around the study.
(5) area in the 3D virtual environment as illustrated in Figure 3, and choose the locations and associated data and information, and present them in a table or diagram format. Figure 7 shows the time history of the water temperature of one of the measurement site.. DIVE. DBVE. Net:. Display:. Networked. DTM data,. communication. Mesh data,. (CORBA). Flow data,. Figure 7. Illustration of the chart presentation of data: The time series of water temperature at one of the measurement site.. …. DBVE also supports the functions of multimedia playing which is done with the TMediaPlayer component of the BCB. Figure 8. Database. illustrates the playing of an MPEG (Motion Picture Experts Group) file that records the. Figure 4.. Architecture of DIVE and its relationship with DBVE.. activities of Formosan landlocked salmon. Users can choose the button to control the multimedia device such as CD-ROM drive, MIDI sequencer, or VCR.. SQL. DBVE. BDE. Figure 5.. Architecture of DBVE.. ODBC. Server. Figure 8.. Figure 6.. Interface of database connection and diagram setting.. Illustration of the multimedia functions of DBVE..
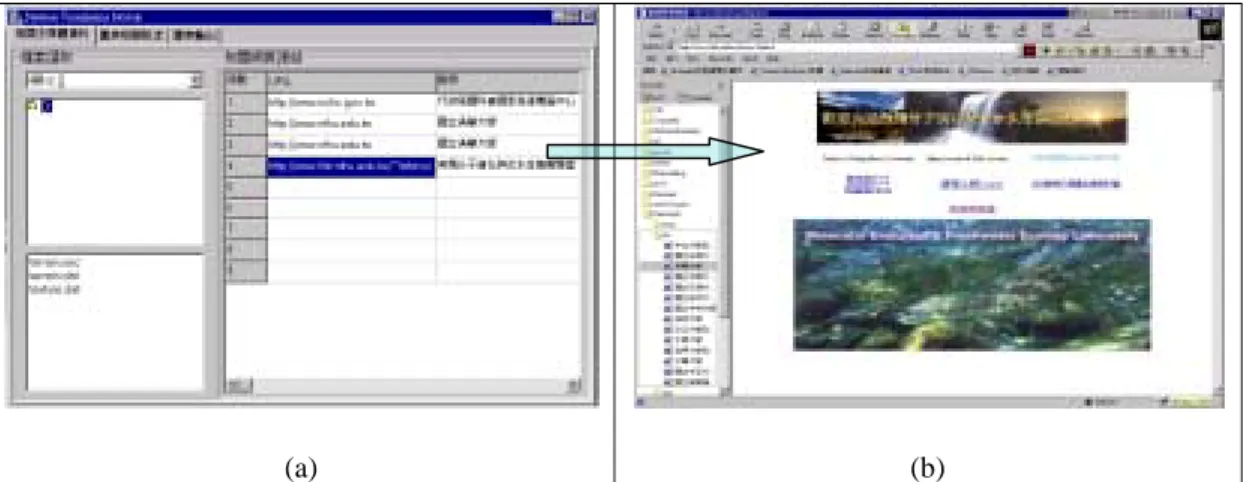
(6) Figure 9 illustrates the dynamic linkage of. panel of the window, users can automatically. DBVE to other organizational websites. Users. access to the hyper-linked URL, and launch the. can save the relevant websites in the database. default browser to view the organizational. for references. By double clicking the URL of. database as shown on the right panel of the. the websites listed on the text grid of the left. window.. (a). Figure 9.. (b). Illustration of dynamic linking to other relevant websites: (a) The listing of the organizational websites of the database, and (b) direct linkage and web view to the target website.. 5.. Conclusion. DBVE used the DTM (digital terrain model) as an infrastructure to present and visualize the. Traditional GIS (geographic information system) geo-referred data and information, such as data, integrates the technologies of topography, text, image, audio/video, animation, and other terrain features and databases. It supports query multimedia, in a three-dimensional virtual world. and. analysis. of. geo-referred. data. and The system was applied to explore and present. information as well as the visualization of various. types. of. geo-referred. data. and. two-dimensional topographies in a passive way. information of the study of population ecology The presentation of data and information is less of Formosan landlocked salmon [1]. This attractive and lack of diversities as well as innovation was found very useful and effective interactivities. in. general.. Due. to. the to present and visualize the geo-referred data. fast-changing. network. and. multimedia and information, and could be used as a CAI. technologies, and advancement of computer (computer-assisted instruction) for promoting graphics,. the. exploration. of. data. and computer graphics and environmental education.. presentation of information of GIS have hence General public can grasp the advancements and improved. A GIS-based data and information applications of computer technologies, and use visualization environment, a GIS-based DBVE, this system to learn the growing environment was developed. Contrary to classical databases and habitual behavior of Formosan landlocked which emphasize on data query and analysis, salmon..
(7) 6.. Acknowledgements. [3]. Tor Bernhardsen, Geographic Information Systems: An Introduction, 2nd ed., John Wiley & Sons Inc., 1999. [4]. N. DeMers, Fundamental of Geographic Information Systems, John Wiley & Sons. Inc., 1997.. [5]. C. Keith, Getting Started with Geographic Information Systems, University of California, Santa Barbara, Prentice Hall Inc., 1997.. [6]. Environmental Systems Research Institute, GIS for Everyone, January 1997, http://www.esri.com/. [7]. Bruce E. Davis, GIS: A Approach, OnWord Press, 1996.. [8]. Hilary M. Hearnshaw and David J. Unwin, Visualization in Geographical Information Systems, John Wiley & Sons Inc., 1994.. [9]. Po-Huan Chiou, Jaye-Jyh Tsai , Chen-An Huang, Shin-Jye Liang and Frank Molkenthin, “Development and Application of Distributed Interactive Visualization Environment: Using Tamshui River and Baltic Sea Ruegen Terrain Models as an Example,” Proceedings of the 1999 National Computer Symposium, Taipei, Taiwan, R.O.C., Vol. 2, pp. 507-516, 1999.. The authors want to thank Prof. Chyng-Shyan Tzeng of the Department of Life Science, National Tsing Hua University, Taiwan for providing the ecology data and information of Formosan landlocked salmon of Chichiawan Stream, Taiwan, R.O.C.. 7.. LIST OF ABBREVIATIONS. BCB:. Borland C++ Builder. CAI:. Computer-Assisted Instruction. CD-ROM: Compact Disk Read-Only Memory CORBA:. Common Object Request Broker Architecture. DBE:. Borland Database Engine. DBMS:. Database Management System. DBVE:. Database Visualization Environment. DIVE:. Distributed and Interactive Visualization Environment. DTM:. Digital Terrain Model. GIS:. Geographic Information System. MIDI:. Musical Instrument Digital Interface. MPEG:. Motion Picture Experts Group. ODBC:. Object Database Connection. SQL:. Structure Query Language. URL:. Uniform Resource Locator. VCR:. Video Cassettes Record. VR:. Virtual Reality. 8. References [1]. Chyng-Shyan Tzeng, et al., “Studies on population ecology of the Formosan landlocked salmon (II),” Research report 8806, the Shei-Pa National Park, Ministry of Interior, Taiwan, 1999. (in Chinese). [2]. John C. Antenucci, Kay Brown, Peter L. Croswell, and Michael J. Kevany, Geographic Information Systems: A Guide to the Technology, Van Nostrand Reihold, 1991.. Visual. [10] Jaye-Jyh Tsai, Chen-An Huang, Po-Huan Chiou, and Shin-Jye Liang, “Development of a Collaborative Visualization Environment: Using the Digital Terrain Model of Tamshui River as an Example,” The 14th International Conference on Information Networking, Hsinchu, Taiwan, R.O.C., 5B-4, pp. 1 ~ 6, 2000. [11] Shin-Jye Liang and Frank Molkenthin, “A Virtual GIS-Based Hydrodynamic Model System for Tamshui River,” Journal of Hydroinformatics, 2000. (accepted) [12] C. J. Date, An Introduction to Database Systems, Addison-Wesley, Reading, Mass., 1986..
(8)
數據
相關文件
Wi-Fi Supported Network Environment and Cloud-based Technology to Enhance Collaborative Learning.. Centre for Learning Sciences and Technologies (CLST) The Chinese University of
“Big data is high-volume, high-velocity and high-variety information assets that demand cost-effective, innovative forms of information processing for enhanced?. insight and
• Learn the mapping between input data and the corresponding points the low dimensional manifold using mixture of factor analyzers. • Learn a dynamical model based on the points on
Good Data Structure Needs Proper Accessing Algorithms: get, insert. rule of thumb for speed: often-get
Since the FP-tree reduces the number of database scans and uses less memory to represent the necessary information, many frequent pattern mining algorithms are based on its
“A Comprehensive Model for Assessing the Quality and Productivity of the Information System Function Toward a Theory for Information System Assessment.”,
Based on the observations and data collection of the case project in the past three years, the critical management issues for the implementation of
For Experimental Group 1 and Control Group 1, the learning environment was adaptive based on each student’s learning ability, and difficulty level of a new subject unit was
