Measurement of broadband gain spectrum of semiconductor
optical amplifiers using a two-section technique
Chao-Hsin Wu, Yi-Shin §U, Ching-Fuh Lin*
Graduate Institute of Electro-optical Engineering
*also with Department of Electrical Engineering and Graduate Inshtute ofElectronics Engineering
National Taiwan University Taipei 106, Taiwan ROC
Tel. 886-2-23635251 ext. 339/Fax: 886-2-23638247 Email: [email protected]
Abstract: A two-section technique is used to measure gain spectrum of semiconductor optical amplifiers. Without other external setup, broadband gain spectnun is measured for a spectral range of 290nm with the gain of above 30 cm-'.
02003 Optical Society of America
OCIS codes: (250.5980) Semiconductor optical amplifier; (140.4480) optical amplifiers
1. Introduction
Broadband characteristics of semiconductor optical amplifiem (SOAs) are highly desired in modern optical communication and have been successfully demonstrated [l, 21. The estimation of the SOA gain spectrum is important for the realization of its applications. So far, the ways to obtain the gain profile are mainly with external setup and quite complicated [3-51. In this work, we introduce a simple way to measure the broadband gain spectrum of SOA by using a two-section monolithic device. The broad bandwidth of the SOA gain spectrum covers about 290nm.
2. The two-section technique
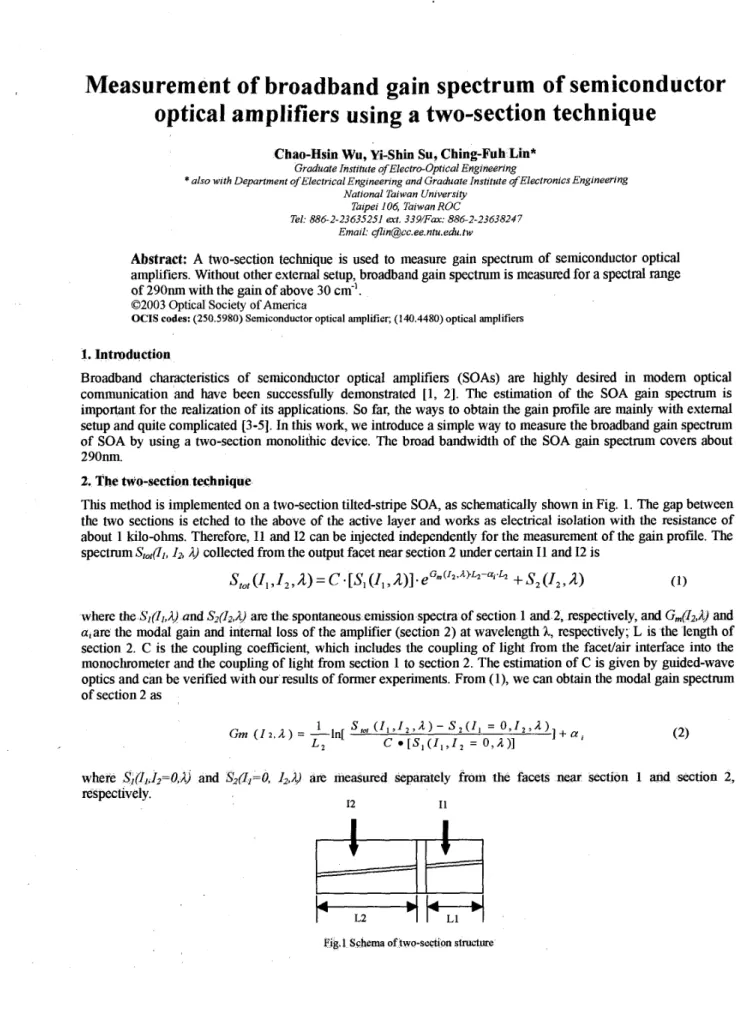
This method is implemented on a two-section tilted-stripe SOA, as schematically shown in Fig. 1. The gap between the two sections is etched to the above of the active layer and works as electrical isolation with the resistance of about 1 kilo-ohms. Therefore, I1 and I2 can be injected independently for the measurement of the gain profile. The spectrum Stot(l1, I,,
A)
collected from the output facet near section 2 under certain I1 and I2 is+
s2( 1 2
>4
(1)prn
( I ~ A . L , - ~ , . L ,s,
(1,
,I,,
4
=c
V I(1,
,
111
*where the SI(I1,A) and Sz(12,A) are the spontaneous emission spectra of section 1 and 2, respectively, and G,,,(Zz,& and a,are the modal gain and internal loss of the amplifier (section 2) at wavelength 1, respectively; L is the length of section 2. C is the coupling coefficient, which includes the coupling of light from the facedair interface into the monochrometer and the coupling of light from section 1 to section 2. The estimation of C is given by guided-wave optics and can be verified with our results of former experiments. From (l), we can obtain the modal gain spectrum of section 2 as
I,=O,A) and S,(I,=O, IZJ) are measured separately from the facets near section 1 and section 2,
I2 I1
3. Experiment results and discussion
The SOA is lmm long and is divided into two sections, L1=200pm and L2=800pm. Sl(I1,A) is obtained from the facet near section 1 while I2 is set to zero. Then similar measurement was made at the other facet to get S2(12,A). Those spectra
are
shown in Fig. 2. Because section 1 is very short,no
ampllfication is observed in Fig. 2(a).The SOA has two kinds of QWs with their first quantized energy levels corresponding to 1 . 3 ~ and 1 . 5 5 ~ 4
respectively. The emission moves toward 1 . 3 ~ as the injection current increases. Varying a series of injection c k n t I2 of SOA, we obtained the total output spectrum Stot(Zl, 12,A) changing with the current I2 under the constant current level 11. In this measurement, section 1 works
as
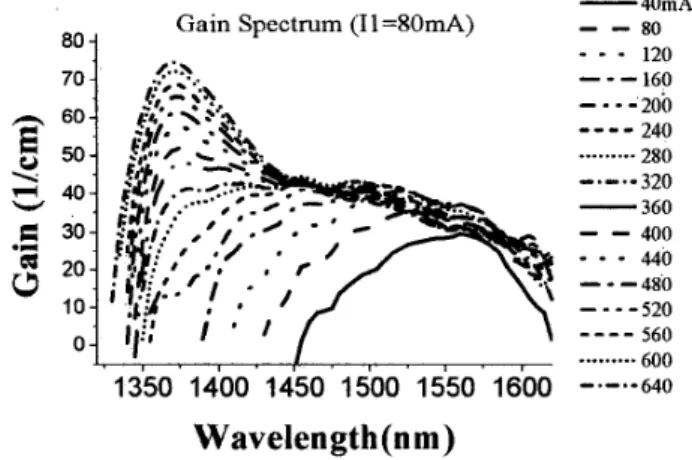
the light source, whde section2 is the amplifier. Even at the low current level 80 mA, section 1 has wide emission bandwidth, so the characteristics of broadband amplification can be measured.Fig. 3 shows the broadband gain spectrum of SOA under different injection current I2 from 40mA to 640mA for
11=80mA. Using the monolit& integration of two devices, extremely broadband gain spectrum can be acquired immediately without ~y ektemal setup of measurement. The result agrees with our QW gain simulation Further discussion about broadband gain measurement of SOA will be discussed in the presentation.
- 4 m 80 . I20 160 200 240 280 320 360 -4im 440 4x0 520 560 . 6 w 1200 1m 1400 1500 lax, 1m-640 II
-
-
65 6 0 5 5 50 4 5-
4 0 1111-
i
::
1
;:
-
-
1 5 1 0 0 5 00-
-
--
1200 1300 1400 1500 1600 17W wavelength(nm) WdVd€Xlg&(lUll) (a) (b)Fig.2 Spectra of (a) section 1 (200p1, with I2 = 0) and (b) section 2 (800pm, with I1 = 0)
rl v E .R
3
60 20 10I
0 Gain S p e c t r u m (I1=8OmA) , 1350 1400 1450 1500 1550 1600 40mA 120 160 200 240 280-
...
..
320-
360-
-
400 440 480 520 560 600 640-
- -
80- . .
---
-..-
----
...
- * .---
- _ _ -
----
...
-.-.-
Wavelength (n
m)
Fig. 3. Gain spectrum of different injection currents I2 from 40mA to 260mA.
4. References
[l] R. R. Wu, C. F. Lin., L. W. Laih, and ’I: T. Shih, “Extremely broadband InGaAsP/InP superluminescent diodes,” Electron. Lett., vol. 36, no.25,
[2] Ching-Fub Lin, Yi-Shin Su, and Bing-Ruey Wu, “Extremely broadband tunable semiconductor lasers for optical communication,” CLEO’O1, Technical Digest, Baltimore, MD, USA, 2001, pp 237-238
[3] T. Ssitoh and M. Mukai, ‘ ‘ 1 . 5 ~ GaInAs traveling-wave semiconductor laser amplifier,” IEEE J. Quantum Electron., QE-23,n0.6 1010-1020 (1987)
[4] R. Andrea, et al, “Gain dynamics in traveling-wave semiconductor optical amplifiers,” IEEE J. Selected Topics in Quantum Electronics, vol. 7,
no.2 293-299, (2001).
[ 5 ] K Magari, T. Ito, H. Kamioka, Y. Tohmori, and Y. Suzuki, “Novel gain measurement method without optical fiber alignment in a
semiconductor optical amplifier,” Conference Proceedings