L
Journal of Alloys and Compounds 270 (1998) 237–241
A study on lattice parameters of martensite in Ti
50.52xNi
49.5Zr shape
xmemory alloys
*
S.F. Hsieh, S.K. Wu
Institute of Materials Science and Engineering, National Taiwan University, Taipei, Taiwan 106, Republic of China Received 13 December 1997; received in revised form 28 January 1998
Abstract
Ti50.52xNi49.5Zr (x55|20 at.%) shape memory alloys exhibit the characteristics of B2x ↔B199 martensitic transformation and their transformation temperatures increase linearly with increasing Zr content. The lattice parameters of B199 martensite in these alloys are determined by XRD, SADP of TEM and the Rietveld method. Experimental results show that all of the lattice parameters a and c, monoclinic angle b and unit cell volume V increase, but lattice parameter b decreases with increasing Zr content in Ti50.52xNi49.5Zrx alloys. The results of the Rietveld method indicate that the martensite of Ti50.52xNi49.5Zr with x#10 at.% has a structure similar to thatx of Ti Ni , but that of Ti50 50 50.52xNi49.5Zr with x$15 at.% may change in structure.x 1998 Elsevier Science S.A.
Keywords: Ti50.52xNi49.5Zr shape memory alloys; Martensitic transformation; Lattice parameters; B199(Ti,Zr)Ni phase; Multiphase Rietveld methodx
1. Introduction [11–14]. However, the high cost of precious metals will limit the practical applications of these SMAs. For this The martensitic transformation of B2↔B199 in TiNi reason, other ternary TiNiX SMAs with lower costs need binary shape memory alloys (SMAs) has attracted consid- to be investigated. Among them, the most prospective erable attention for the past years. The structure of the candidates are TiNiZr and TiNiHf ternary alloys with Zr parent phase of TiNi SMAs is a B2 ordered cubic [1,2] and and Hf replacing Ti in these alloys [15]. Meisner et al. [16] that of the martensite phase is a B199 monoclinic in which reported that the lattice parameters of martensitic phase the space group is P2 /m and the lattice parameters are1 B199, by using the XRD method, are dependent on Zr a50.2889 nm, b50.4210 nm, c50.4622nm and b 596.88 content in Ti502xNi Zr50 x SMAs with Zr content in the [3–5]. It is reported that the martensitic transformation of range of 1 to 20 at.% at room temperature. Three phases Ti502xNi Cu SMAs with x50|30 at.% is B250 x ↔B19 or (Ti,Zr)Ni, (Ti,Zr) Ni and l2 1 are observed in Ti-rich B2↔B199 or B2↔B19↔B199 depending on the Cu-con- Ti532xNi Zr SMAs with the Zr content in the range of47 x
tent [6–8]. For example, the ternary Ti Ni Cu50 40 10 alloy 5|20 at.% at room temperature [17]. Here, l phase is a1
undergoes B2↔B19↔B199 two-stage martensitic trans- TiNiZr ternary solid solution and the (Ti,Zr)Ni phase can formation [9,10]. Here, the structures of B2 and B199 are exhibit the B2↔B199 martensitic transformation with Ms similar to those of TiNi binary SMAs, but the structure of higher than 1008C [17]. However, the lattice parameters of B19 is an orthorhombic martensite. Lo et al. [10] reported B199 martensite changing with Zr content in these Ti-rich that, during the B19→B199 in the Ti Ni Cu50 40 10 SMA, the Ti532xNi Zr alloys have yet to be reported. In this study,47 x
monoclinic angle b of B199 martensite will increase with martensitic transformation of another Ti-rich decreasing temperature, which indicates that the Ti50.52xNi49.5Zr SMAs with x55|20 at.% is studied. Thex
B19→B199 transformation has the characteristic of the effect of Zr content on lattice parameters of martensite in ‘‘continuous transformation’’. these alloys, by using the XRD, SADPs (selected area It is well known that Ti Ni50 502yXy ternary shape diffraction patterns) and multiphase Rietveld methods, is memory alloys with X5Pd, Pt or Au have a Ms, the also investigated.
martensite starting transformation temperature, much
high-er than 1008C and exhibit a one-way shape memory effect 2. Experimental procedure
*Corresponding author. Fax: 1886 22 3634562. The conventional vacuum arc melting with tungsten
0925-8388 / 98 / $19.00 1998 Elsevier Science S.A. All rights reserved. P I I : S 0 9 2 5 - 8 3 8 8 ( 9 8 ) 0 0 3 6 8 - 5
electrode technique was employed to prepare Ti50.52xNi49.5Zrx (x55, 10, 15, 20 at.%) alloys. The symbols Zr , Zr , Zr5 10 15 and Zr20 are hereafter used to denote specimens of Ti45.5Ni49.5Zr , Ti5 40.5Ni49.5Zr ,10
Ti35.5Ni49.5Zr15 and Ti30.5Ni49.5Zr20 alloys, respectively. Titanium (99.9%), nickel (99.9%) and zirconium (99.8%), totaling about 100 g, were melted and remelted at least six times in an argon atmosphere. A pure titanium button was used and melted before melting the alloys as an oxygen getter. The mass loss during the melting was negligibly small. The as-melted buttons were homogenized holding at 9508C for 72 h in vacuum and furnace-cooled. The homogenized buttons were cut into several plates with a low speed diamond saw and annealed at 9008C for 2 h in vacuum and quenched in water. The acquired specimens were polished for DSC, XRD, EPMA and TEM examina-tions.
DSC measurement was conducted by a Dupont 2000 thermal analyzer equipped with a quantitative scanning system 910 DSC cell for controlled heating and cooling runs on a sample encapsulated in an aluminum pan. The temperature range of measurement was from 0 to 4008C
21
with a scanning rate of 108C min . The X-ray analysis of annealed specimens were performed at room temperature by a Phillips X-ray diffractometer, using monochromated Cu Ka radiation and a fixed time (6 s), step scan (step width 0.048 in 2u ) technique. X-Ray diffraction patterns
were refined and analyzed by the multiphase Rietveld Fig. 1. DSC curves of homogenized Ti Ni Zr (x55|20 at.%) 50.52x 49.5 x
method [18]. The model parameters in this method that alloys. M and A are temperatures of forward and reverse martensite
s f
may be refined include not only atom-positional, thermal, transformation, respectively.
and site-occupancy parameters but also parameters for the background, lattice, instrumental geometrical–optical
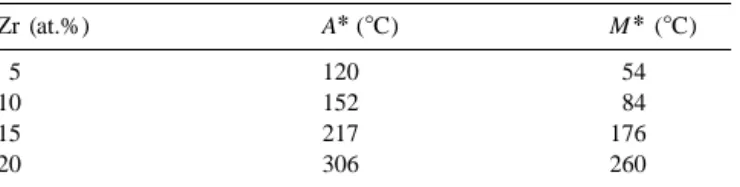
fea-tures, specimen aberrations and specimen reflection-pro- sitic transformation of B2↔B199 [15]. The transformation file-broadening agents such as crystallite size and mi- peak temperatures of these alloys are shown in Table 1. crostrain. Multiple phases may also be refined simul- From Fig. 1, it is clear that the transformation peak taneously and comparative analysis of the separate overall temperatures rise linearly from 50 to 3208C with increasing scale factors for the phases offers what is probably the Zr content. Therefore, based on the results of Fig. 1, a most reliable current method for quantitative phase analy- TiNiZr SMA with the desired transformation temperature sis [19]. The computer program used in this analysis is can be obtained by carefully controlling its Zr content. The RIETANfor the Rietveld method developed by F. Izumi [20]. more detailed shape memory properties of TEM images and electron diffraction were carried out Ti50.52xNi49.5Zrx alloys after different thermomechanical using a JEOL-100CXII electron microscope operated at processes are reported in another paper [21].
100 kV and equipped with a conventional double tilting A great number of second phase particles are seen stage. TEM specimens were prepared by electropolishing around the grain boundaries in Ti50.52xNi49.5Zrx alloys at 08C with an electrolyte consisting of 20% H SO and2 4 with x50|20 at.% and they are found to be (Ti,Zr) Ni, l2 1
80% CH OH by volume. The applied voltage of the3 and (Ti,Zr)Ni phases [21,22]. (Ti,Zr) Ni and l phases do2 1
electropolishing was 20 V. not transform martensitically within the temperature range
Table 1
The transformation peak temperatures of Ti50.52xNi49.5Zr alloysx 3. Experimental results and discussion
* *
Zr (at.%) A (8C) M (8C)
Fig. 1 shows the experimental results of DSC measure- 5 120 54
10 152 84
ments for annealed Zr , Zr , Zr5 10 15 and Zr20 alloys in both
15 217 176
forward and reverse transformations. Peaks appearing in
20 306 260
marten-Fig. 3. Dependence of lattice parameters a, b, c, b and volume of unit cell V on Zr content of B199 martensite in Ti50.52xNi49.5Zr alloys.x
Ti50.52xNi49.5Zr alloys. As seen in this figure, parametersx
a, c, b and V increase while b decreases with increasing Zr content.
Fig. 4(a) shows the TEM bright field image of marten-site in annealed Zr20 alloy. Fig. 4(b–d) are SADPs of Zr ,5
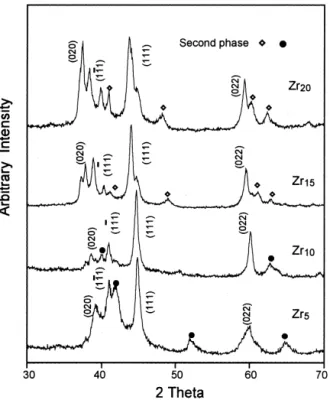
Fig. 2. X-Ray diffraction patterns of Ti50.52xNi49.5Zr alloys.x
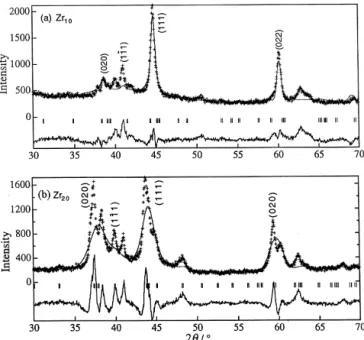
Zr10 and Zr20alloys, in which the foil normal is parallel to the [100]M direction. From Fig. 4(b–d), one can calculate described above. They are characterized by high brittleness the lattice parameters b and c and the results are shown in and limited plasticity. For the (Ti,Zr)Ni phase, Fig. 2 Table 2. From the TEM results of Table 2, we find that the shows its XRD spectra of (Ti,Zr)Ni phase from u 5308 to tendency of lattice parameters b and c versus Zr-content in u5708 for Zr , Zr , Zr5 10 15 and Zr20 alloys. By comparing these alloys coincides with that of the XRD results. these results with those of the B199 martensite in the Fig. 5(a,b) show the results of the multiphase Rietveld Ti Ni50 50 alloy [5], lattice parameters of B199 martensite analysis method of annealed Zr10 and Zr20 alloys,
respec-¯
can be calculated from the principal peaks (020) , (111) ,M M tively. In the upper curves of Fig. 5(a), the ‘‘cross-marked’’ (111)M and (022)M shown in Fig. 2. Table 2 is the line indicates the observed XRD data of Fig. 2 and the calculated lattice parameters a, b, c, b and the unit cell solid line indicates the pattern calculated by the multiphase volume V of the B199 martensite, where a, b, c are lattice Rietveld analysis method using the martensitic structure constants and b is the monoclinic angle of the B199 model (monoclinic B199, the space group P2 /m [5]). The1
martensite. Fig. 3 shows the dependence of lattice parame- differences between the observed and calculated values are ters and volume of the B199 phase on the Zr content of shown in the lower curve of Fig. 5(a). Fig. 5(a) indicates
Table 2
The lattice parameters and unit cell volume of B199 martensite in Ti50.52xNi49.5Zr alloysx
Zr (at.%) Parameter 3 3 a (nm) b (nm) c (nm) b (degree) V 310 (nm ) By XRD profile of Fig. 2 5 0.2916 0.4113 0.4718 97.20 56.14 10 0.2952 0.4094 0.4746 97.43 56.87 15 0.2976 0.4092 0.4790 97.53 57.83 20 0.2992 0.4080 0.4858 98.50 58.64 By SADP of TEM a 5 – 0.412 0.472 97.20 – a 10 – 0.408 0.481 97.43 – a 20 – 0.407 0.486 98.50 – By Rietveld method 5 0.2921 0.4109 0.4707 97.35 56.03 10 0.2932 0.4081 0.4736 97.49 56.19 a
Fig. 4. (a) TEM bright-field image of martensite in Ti30.5Ni49.5Zr20alloy, (b), (c) and (d) are SADPs for Zr , Zr5 10and Zr20alloys, respectively. The zone axes are [100] .M
that the curve fitting of calculated peaks to observed ones, ¯
such as (022) , (111) , (111)M M M and (020)M of Fig. 2, is rather good because the final reliability, R factor, Rwp is 13.28% and Rp is 10.17% which fall in the reasonable range (,15%) [23]. The subscript wp and p mean weighed pattern and pattern, respectively. Han et al. [24] found that lattice parameters of a monoclinic martensite in Ti36.5Ni48.5Hf15 alloy are a50.293 nm, b50.411 nm, c5 0.473 nm and b 5100.48. Therefore, it is reasonable to conclude that the space group of B199 martensite for Ti50.52xNi49.5Zrx alloys with x#10 at.% is still P2 /m.1
Under this assumption, the lattice parameters calculated by the Rietveld method for Zr and Zr5 10 alloys have nearly the same values as those calculated from XRD and TEM results, as shown in Table 2. Fig. 5(b) shows that the curve fitting of calculated peaks to observed ones for the martensite in annealed Zr20 alloy is not so good because the final reliability, R factor, Rwp is 20.84% and Rp is 16.88%. We suggest that the crystal structure of martensite
Fig. 5. Results of the Rietveld refinement for P2 /m model. Observed1
may change in Ti-rich Ti50.52xNi49.5Zr alloys for x$15x
diffraction profile and calculated one for (a) Zr , (b) Zr10 20 alloys,
at.%. A further study on this structural change is being
respectively. In each figure, the lower curve stands for the deviation
[3] K. Otsuka, T. Sawamura, K. Shmizu, Phys. Status Solidi 5 (1971)
4. Conclusion
457.
[4] G.M. Michael, R. Sinclair, Acta Crystallogr. B 37 (1981) 1803.
1. Ti50.52xNi49.5Zr (x55|20 at.%) alloys exhibit marten-x [5] P. Villars, L.D. Calvert, Pearson’s Handbook of Crystallographic
sitic transformation. The transformation temperatures Data for Intermetallic Phases, ASM International, Materials Park,
Ms and As rise linearly from 50 to 3208C with OH, 1991, p. 4714.
[6] T. Tadaki, C.M. Wayman, Metallography 15 (1982) 233.
increasing Zr content.
[7] T. Tadaki, C.M. Wayman, Metallography 15 (1982) 247.
2. The lattice parameters of the B199 martensite phase in
[8] T. Saburi, T. Kamatsu, S. Nenno, Y. Watanabe, J. Less-Common
these alloys are determined by XRD, SADP of TEM Metals 118 (1986) 217.
and the Rietveld method. Experimental results show [9] T.H. Nam, T. Saburi, Y. Kawamura, K. Shimizu, Trans. Jpn. Inst.
that all of the lattice parameters a and c, monoclinic Metals 31 (1990) 262.
[10] Y.C. Lo, S.K. Wu, H.E. Horng, Acta Metall. 41 (1993) 747.
angle b and unit cell volume V increase, while lattice
[11] V.P. Sivokha, V.N. Khachin, Phys. Met. Metall. 62 (1986) 534.
parameter b decreases with increasing Zr content in
[12] V.N. Khachin, N.M. Matveeva, V.P. Sivokha, Doklady AN SSSR 257
Ti50.52xNi49.5Zrx alloys. The results of the Rietveld (1981) 167.
method indicate that the martensite of Ti50.52xNi49.5Zrx [13] V.P. Sivokha, A.S. Savionov, V.N. Khachin, Phys. Met. Metall. 56
with x#10 at.% has a structure similar to that of (1983) 112.
[14] S.K. Wu, C.M. Wayman, Metallography 20 (1987) 359.
Ti Ni , but that of Ti50 50 50.52xNi49.5Zr with x$15 at.%x
[15] J.H. Mulder, J.H. Mass, J. Beyer, Proc. of ICOMAT-92, 1992, p.
may change in structure.
869.
[16] L. Meisner, V. Sivokha, J. Phys. IV (1995) C8–765.
[17] S.F. Hsieh, S.K. Wu, J. Alloys and Compounds, England, 1998 (in
Acknowledgements press).
[18] H.M. Rietveld, J. Appl. Crystallogr. 2 (1969) 65.
[19] R.A. Young, The Rietveld Method, International Union of
Crys-The authors are pleased to acknowledge the financial
tallography Oxford University Press, New York, 1995.
support of this research by the National Science Council [20] F. Izumi, in: H. Saisho, Y. Gohshi (Eds.), Application of Synchrot-(NSC), Republic of China under Grant NSC 86-2216- ron Radiation to Materials Analysis, Elsevier Science B.V.,
North-E002-033. The valuable discussion with Dr. W.K. Chang, Holland Physics Publishing, Amsterdam, 1995, p. 405.
[21] S.F. Hsieh, Ph.D. thesis, Institute of Materials Science and
Engineer-Institute of Materials Science and Engineering, National
ing, National Taiwan University, Taipei, Taiwan, 1997.
Taiwan University, in the calculation of the Rietveld
[22] V.N. Eremenko, E.L. Semenova, L.A. Tret9yachenko, Doklady AN
method is highly appreciated. Ukr. SSR, Ser. A 2 (1988) 76.
[23] W.K. Chang, Ph.D. thesis, Institute of Materials Science and Engineering, National Taiwan University, Taipei, Taiwan, 1996. [24] X.D. Han, W.H. Zou, R. Wang, Z. Zhang, D.Z. Yang, K.H. Wu, J.
References
Phys. IV (1995) C8–753. [1] T.V. Philip, P.A. Beck, Trans. Am. Inst. Min. Eng. 209 (1957) 1269.