行政院國家科學委員會專題研究計畫 成果報告
利用快速頻譜影像技術量測大腦谷氨酸濃度分布
研究成果報告(精簡版)
計 畫 類 別 : 個別型 計 畫 編 號 : NSC 100-2320-B-004-002- 執 行 期 間 : 100 年 08 月 01 日至 101 年 07 月 31 日 執 行 單 位 : 國立政治大學應用物理研究所 計 畫 主 持 人 : 蔡尚岳 共 同 主 持 人 : 尼大衛 計畫參與人員: 碩士班研究生-兼任助理人員:王宛琦 碩士班研究生-兼任助理人員:邱建佳 報 告 附 件 : 出席國際會議研究心得報告及發表論文 公 開 資 訊 : 本計畫可公開查詢中 華 民 國 101 年 09 月 11 日
中 文 摘 要 : 谷氨酸是大腦中一種重要的興奮性神經傳導物質,對於許多 大腦相關的臨床研究非常的重要。利用核磁共振頻譜來對谷 氨酸定量困難在於,谷氨酸本身頻譜特性相當複雜,同時會 跟其他代謝物重疊,特別是麩醯胺;目前利用多迴訊時間平 均法,可以簡化其譜線同時減少麩醯胺的影響,對於谷氨酸 定量很有用,此方法需要多個迴訊時間的頻譜互相平均,因 此會增加掃描的次數,通常十六組迴訊時間會增加十六倍的 時間,造成此方法在延伸至頻譜影像的臨床應用上,相當困 難,本計畫旨在建立一個掃描方法,利用面迴訊頻譜影像技 術增加掃瞄速度同時提高空間解析度,再配合多迴訊時間平 均方法來建立可靠的谷氨酸分布影像,此掃描方法將具有下 列特質;臨床使用可行的掃描時間,包含較多的大腦區域, 較好的空間解析度,不同截面掃描,受試者間及長期掃描結 果的比較;我們將先利用 GAVA 模擬最佳化的多迴訊時間平均 方法,再利用 LCModel 定量軟體來比較此計畫提出的分法和 過去傳統方法在谷氨酸定量上的改善,我們並將提出一套濃 度修正程序,讓濃度可以用在受試者間和長期掃描間的比 較,此技術將可用來探討正常人大腦不同區域的基本谷氨酸 濃度,本計畫對於未來許多臨床研究有相當大的幫助,例如 藥物造成的長期谷氨酸改變,神經退化疾病大腦谷氨酸濃度 的長期變化等。 中文關鍵詞: 迴訊時間平均方法,面迴訊頻譜影像技術,谷氨酸,麩醯 胺,核磁共振頻譜 英 文 摘 要 : 英文關鍵詞:
1
行政院國家科學委員會補助專題研究計畫
■成果報告
□期中進度報告
利用快速頻譜影像技術量測大腦谷氨酸濃度分布
Quantitative Mapping of the Cerebral Glutamate Concentrations Using Fast
Magnetic Resonance Spectroscopic Imaging Technique
計畫類別:▓個別型計畫 □整合型計畫
計畫編號:NSC 100 - 2320 - B - 004 - 002
-
執行期間: 2011 年 08 月 01 日至 2012 年 07 月 31 日
執行機構及系所:政治大學應用物理研究所
計畫主持人:蔡尚岳
共同主持人:尼大衛
計畫參與人員:王宛琦、邱建佳
成果報告類型(依經費核定清單規定繳交):▓精簡報告 □完整報告
本計畫除繳交成果報告外,另須繳交以下出國心得報告:
□赴國外出差或研習心得報告
□赴大陸地區出差或研習心得報告
▓出席國際學術會議心得報告
□國際合作研究計畫國外研究報告
處理方式:
除列管計畫及下列情形者外,得立即公開查詢
□涉及專利或其他智慧財產權,□一年□二年後可公開查詢
中 華 民 國 101 年 8 月 31 日
2 目錄 前言---2 研究目的---3 文獻探討---3 研究方法---4 結果與討論---5 參考文獻---7 計畫結果自評---9 與計畫相關著作---9 一、前言
Glutamate (Glu) as the most prevalent excitatory neurotransmitter in the brain plays important role in the cerebral energy metabolism. When Glu is released at glutamaterigic synapses astrocytes will convert it from extracellular space into glutamine (Gln). This process involves the consumption of energy. 1H Magnetic Resonance Spectroscopy (MRS) is able detect the Glu content in the brain noninvasively. With proper calibration procedure the concentration of Glu can be quantified for inter-subject or long–term comparison. In most cases, Glu and Gln are almost indistinguishable because they are structurally similar to each other. Even it is quite essential to identify Glu and Gln separately in order to understand the roles of Glu and Gln in brain metabolism, due to their strong overlapping property they are usually quantified as Glu plus Gln complex (Glx) in general clinical system with filed strength around 1.5T to 3T. TE-averaged (TE-avg) PRESS first proposed by Hurd et.al. in 2004 (1). The basic concept is to simplify Glu spectral shape by averaging spectra acquired from different TE. Through the computer simulation they found even both Glu and Gln have different spectral shape through coupling evolution at different TE a combination of spectra from 16 TE steps ranging from 35 to 185 with 10 ms step will make Glu show as a single peak while minimize Gln contribution.
Quantification of metabolites is another important issue on 1H MRS. Since metabolites is overlapped in a narrow spectra range with low concentrations and complex spectral shape the reliability and accuracy of quantified metabolic contents usually needs to be considered carefully. LCModel, a commercial software package, is one of the most popular frequency domain fitting programs which have been widely applied in many facilities and in many clinical researches (2). The prior knowledge needed for LCModel also known as the “basis” includes the information about spectral shape of each metabolite to be fitted. However if spectrum is acquired by special acquisition protocol or sequence such as TE-avg, corresponding basis set describing the spectral shape of each metabolite from TE-avg should be generated first for LCModel analysis. For this purpose simulation procedure should be performed. GAMMA C++ library developed in 1994 is a flexible and general tool to simulate behavior of metabolites in MR experiment. In 2007 B. Soher et al. developed an improved application of GAMMA package called GAMMA Visual Analysis (GAVA) tool which includes convenient graphic user interface with flexible development framework (3). It also facilitates advanced tool to directly edit pulse sequence to simulate MR experiment in more complicated
3
pulse design. GAVA provides a more convenient way to generate basis set used in all parametric spectral analysis procedures including LCModel.
二、研究目的
This project is aimed to build up a MRSI method to access the concentrations of Glu in the brain with clinical applicability. The MRSI protocol will be based on fast MRSI technique, PEPSI, to speed up the data acquisition and to increase the spatial information and will also adopt TE-avg method to simplify the quantification complexity of Glu and thus increase the reliability of quantification. We will set up the simulation environment for MRS experiments using GAVA. Through the simulation we will try to optimize the scan time needed for TE-avg scan by reduce the number of steps needed. We will also finish file format transformation between GAVA, Matlab and LCModel. Basis for different TE-avg steps will then be generated for LCModel to quantify TE-avg spectrum. The proposed TE-avg protocol will be verified on SVS experiments first. In the initial phase we will compare the performance of Glu quantification using TE-avg PEPSI and short TE PEPSI with the same total acquisition time on normal subjects.
三、文獻探討
Glu plays a central role for neurologist to understand the brain energetic function. Previous there are plenty of studies showing that the Glu can be a valuable marker for various diseases. For examples, cognitive impairments in schizophrenia is related to glutamatergic dysfunction. Glu plus Gln levels were correlated to the overall cognitive performance in schizophrenia (4-6). Several findings showed that energy metabolism and Glu-Gln cycle may be impaired in epilepsy. Increased Glu level is found in hippocampus possibly due to the slow Glu-Gln cycle in epileptic human hippocampus (7,8). Despite these two examples Glu have been linked to various neuro disorders diseases such as multiple sclerosis, amyotrophic lateral sclerosis, Huntington disease and Alzheimer disease (9,10). Other than marker of many diseases Glu response to given stimulus or drug and alcohol addiction is also of highly interest. It has been shown that the long term exposure to the ethanol may lead to imbalance of in excitatory and inhibitory neurotransmitter. Therefore elevated Glu level in hippocampus was found during the first cycle of ethanol withdraw and was much more higher in third cycle. During human ethanol detoxification taking drug is able to completely block the Glu increase (11,12). For drug administration significant Glu release was found in anterior cingulate after ketamine administration (13). For response to outside stimulus experiments showed that Glu level increases in anterior cingulated gyrus with pain stimulus. This information could be useful for the development of treatments for pain. (14). There were also studies showing dynamic Glu response to the visual stimulation as fMRI setup (15).
Direct measurement of Glu content is usually carried out using short-TE MRS. With sufficient prior information about the spectral shape of Glu concentration can be quantified using post quantification algorithms (6,16,17). To improve the efficiency and accuracy of Glu quantification at low and middle file strength such as 3T, there are a number of methods proposed by spectral editing methods. J-refocused PRESS and coherence transfer method collected spectra from two different TE (18). However the trimming for J-refocused RF is important to maintain the similar spectral shape of Glu at different TE for subtraction and the contamination of GABA at same spectral range is another issue to be solved. A similar extension of this method is Carr-Purcell selective PRESS (CPRESS) which used a Carr-Purcell pulse train with very
4
short interpulse interval. This has been shown to maintain the structure of multiplet such as Glu, Gln over a long TE range with only T2 relaxation decay (19). The further study showed that it can be used at low filed clinical system (1.5T) (20). One potential problem is the high SAR of multiple refocus RD pulse applied which can be optimized using the design of hyper echo pulse train. Multiple quantum coherence (MQC) is another way to simplify the detection of multiplets such as Glu. MQC filter design for Glu have been proposed before (21). The pulse sequence of MQC filtering is relatively complex and the design of sequence is based on the knowledge of coupling structure of spin system involving lots of basic knowledge in the NMR category. Another way to manipulate spin system is J difference editing which usually applies additional frequency selective RF pulse between regular 180 RF pulses to edit target resonance. For Glu the Gln filter, editing pulse takes 80~100 ms long to focus on ~13 hz gap between Glu and Gln resonances (22,23). The main challenging is that the spectrally selective RF is usually highly focused which means the duration of RF is rather long.
四、研究方法
Simulation of MRS experiments will be done on GAVA. GAVA is programmed in Interface Description Language (IDL) software environment, which is developed for the visualizations of complex numerical data. The installation of GAVA is instructed by the manual file provided by Dr. B.J. Soher (3). Except the installation of IDL virtual machine there are corresponding files needed to be correctly installed including GAMMA library for the simulation of spin evolution and the MySQL data base for information about the metabolites. The setting for MRS experiments will be done firstly by choosing the sequence. Regular PRESS and STEAM sequence is provided. The second step is to set the time parameters for example in PRESS there will be the first echo time (TE1), the second echo time (TE2) and repetition time (TR). The final step will be choosing the metabolites to be simulated. For the simulation of spin evolution the detailed information about the spin structure of metabolite such as the chemical structure, chemical shift and J coupling values for each proton groups needs to be input. This information has been listed in MRS related book (24) or reports (25). There are already up to 20 kinds of common metabolites in the brain input into the data base of GAVA. For the simulation of TE-avg protocol, we will use PRESS sequence with minimized TE1 and stepping TE2 to match the designed TE. Minimum TE1 will be related to the RF pulse and duration of spoil gradient which is around 10 ms in our PEPSI sequence. The TE-avg protocol will be simulated using regular 16 TE steps starting at 35 ms with 10 ms step size as suggested in the previous report (1,26). We will also simulate TE-avg spectrum using 8 steps starting at 35 ms with 20 ms step size. We will compare the spectral shape of Glu on these two protocols to evaluate if 8 steps are also able to show same editing effect on Glu and Gln. The TE-avg protocol should be optimized for TE steps for minimum acquisition times. 12 metabolites are simulated for each TE-avg protocol including Alanine (Ala), Aspartate (Asp), Creatine (Cre), Choline-containing compounds (GPC), Gamma-Aminobutyric Acid (GABA), Glutamine (Gln), Glutamate (Glu), Lactate (Lac), myo-Inositol (mI), N-Acertyl Aspartate (NAA), N-Acertyl Aspartylglutamate (NAAG), Taurine (Tau). They are commonly seen metabolites in the brain and have generally included in LCModel basis. The visualization of simulation results can be done on GAVA itself. However it is more convenient and necessary for us to do it on Matlab since we need to get simulated spectral shape of metabolites at different TE and to calculate the spectral shape for TE-avg protocol. For Matlab and GAVA file transformation GAVA results can be exported into binary file and we can read it into
5
Matlab by self-developed program. Finally the generation of the of 8 step and 16 steps TE-avg basis can be done by “makebasis” function provided in LCModel software package which is able to transform the metabolite signal saved separately as “RAW” file format specified by LCModel into LCModel basis. For this purpose we will calculate the spectral shape of TE-avg spectrum and save the signal of each metabolite as separate “RAW” file format using self-developed Matlab code.
Normal volunteers are enrolled in this study. All experiments will be performed on a 3T MR system (Trio, SIEMENS Medical Solutions, Erlangen, Germany) with a 32-channel coil array that covers the whole brain circumferentially with eight surface receive-only coils. We use the body coil for RF excitation. Before MRS acquisitions, we acquire a fast multi-slice, axial T1-weighted images using the gradient echo sequence for anatomy localization, as required for subsequent PEPSI experiments. The parameters are as followed: TR/TE/flip angle=10ms/2ms/15o, 240x240 mm2 FOV, 256x256 matrix size, 18 image slices of 3-mm thickness without gap to cover the whole brain. Routine shimming and adjustment for water suppression will be carried out automatically by the MR system. Both short TE PEPSI (TE30) and TE-avg PEPSI protocol are conducted on each subject. 2D PEPSI data are acquired from a para-axial slice at the region of interest with parameters: matrix size = 32x32, FOV = 224 to 256 mm, slice thickness = 15 mm. To compensate the scan time short TE protocol is conducted with 8 averages and a TE-avg protocol is conducted with 16 steps using TE form 35 ms to 185 ms. The TR was chosen to approximate the T1 values of metabolites for optimization of the acquisition efficiency for signal-to-noise ratio (SNR) (27). Given previously reported T1 values ranging between 1000 ms and 1500 ms at 3T (28), we chose TR of 1500 ms for this protocol. The scan time of short TE PEPSI is 6.4 minutes, and that for TE-avg PEPSI is 12.8 minutes. We will collect 6 subjects to evaluate the improvement in quantification of Glu using TE-avg PEPSI.
Routine post processing procedures including spectral and spatial filtering, phase correction, PEPSI reconstruction will be carried out as developed in by our self and have been reported previously (29). Before quantification, 8 steps TE-avg PEPSI data was generated by rearranging 16 steps TE-avg data. LCModel will be used to analyze the data from TE30, 8 steps TE-avg and 16 steps TE-avg protocol using corresponding basis. Water scaling will be used by collecting another PEPSI scan without water suppression. The performance of Glu quantification will be evaluated by directly comparing CRLB of Glu fitting. Two ROIs defined at outer and inner regions of the brain were used.
五、結果與討論
We are able to generate basis for TEavg protocols using GAVA. The basis for TE30, 8 steps TE-avg and 16 steps TE-avg protocol were shown in the figure (Left). The simulated bases from GAVA were successfully imported into LCModel. These bases were used to quantify the spectra and metabolite concentrations of Glu and Glu+Gln. Representative spectra selected from two voxels in a subject were shown in the figure (Right). Here, the fitting for TE30, 8 steps TEavg and 16 steps TEavf data was successful. The individual peak of Glu around 2.3 ppm can be identified on spectra from TEavg protocols. Instead, the spectra from TE30 protocol showed overlapped Glu and Gln resonances.
6
The quantified metabolite and CRLB maps of individual Glu and Glu+Gln were shown in the following figures. Similar spatial distribution of Glu was found for data from three protocols. As for Glu+Gln, concentration maps of TE30 protocol exhibited higher homogeneity than TEavg protocols. CRLB maps exhibited observable lower fitting errors in TEavg protocols on the quantification of Glu. The combination of Glu with Gln can improve the quantification by LCModel only on TE30 protocol.
Quantitatively, Averaged concentrations and CRLB from six subjects were summarized in the following table. As we expect, lower CRLB indicating more reliable fitting were found in TEavg protocols and the combination of Glu and Gln can improve the quantification in TE30 protocol. CRLB significantly increase in mI using TEavg protocols. This suggest that the disadvantage of TEavg protocol will be the lower accuracy in the quantification of mI.
7
concentrations (I.U.) Outer Inner
16 steps TEavg 8 steps TEavg TE30 16 steps TEavg 8 steps TEavg TE30 NAA 13.86 13.95 19.67 14.71 14.85 20.78 tCr 6.58 6.73 10.01 6.70 6.88 10.18 Cho 1.82 1.83 2.21 2.00 2.02 2.42 mI 6.51 6.81 6.61 6.58 6.90 6.82 Glu 7.43 7.68 9.45 7.56 7.74 9.57 Gln 2.53 3.34 5.85 2.47 3.08 5.41 Glu+Gln 8.71 9.57 13.95 8.91 9.63 14.18 CRLB (%) Outer Inner NAA 4.84 5.53 6.51 4.20 4.86 5.98 tCr 3.48 4.08 3.97 3.19 3.73 3.65 Cho 5.03 6.02 6.87 4.19 5.04 7.78 mI 16.50 20.86 13.23 14.92 19.07 11.77 Glu 13.29 16.94 22.50 11.83 15.33 20.23 Gln 55.41 54.79 43.24 54.07 55.95 42.69 Glu+Gln 13.07 16.41 20.15 11.71 15.03 18.29 六、參考文獻
1. Hurd R, Sailasuta N, Srinivasan R, Vigneron DB, Pelletier D, Nelson SJ. Measurement of brain glutamate using TE-averaged PRESS at 3T. Magn Reson Med 2004;51(3):435-440.
2. Provencher SW. Automatic quantitation of localized in vivo 1H spectra with LCModel. NMR Biomed 2001;14(4):260-264.
3. Soher BJ, Young K, Bernstein A, Aygula Z, Maudsley AA. GAVA: spectral simulation for in vivo MRS applications. J Magn Reson 2007;185(2):291-299.
4. Theberge J, Bartha R, Drost DJ, Menon RS, Malla A, Takhar J, Neufeld RW, Rogers J, Pavlosky W, Schaefer B,
Densmore M, Al-Semaan Y, Williamson PC. Glutamate and glutamine measured with 4.0 T proton MRS in never-treated patients with schizophrenia and healthy volunteers. Am J Psychiatry 2002;159(11):1944-1946.
5. Theberge J, Williamson KE, Aoyama N, Drost DJ, Manchanda R, Malla AK, Northcott S, Menon RS, Neufeld RW, Rajakumar N, Pavlosky W, Densmore M, Schaefer B, Williamson PC. Longitudinal grey-matter and glutamatergic losses in first-episode schizophrenia. Br J Psychiatry 2007;191:325-334.
6. Bustillo JR, Chen H, Gasparovic C, Mullins P, Caprihan A, Qualls C, Apfeldorf W, Lauriello J, Posse S. Glutamate as a Marker of Cognitive Function in Schizophrenia: A Proton Spectroscopic Imaging Study at 4 Tesla. Biol Psychiatry. 7. Pan JW, Williamson A, Cavus I, Hetherington HP, Zaveri H, Petroff OA, Spencer DD. Neurometabolism in human
epilepsy. Epilepsia 2008;49 Suppl 3:31-41.
8. Petroff OA, Errante LD, Rothman DL, Kim JH, Spencer DD. Glutamate-glutamine cycling in the epileptic human hippocampus. Epilepsia 2002;43(7):703-710.
9. Mattson MP. Excitotoxic and excitoprotective mechanisms: abundant targets for the prevention and treatment of neurodegenerative disorders. Neuromolecular medicine 2003;3(2):65-94.
10. Pitt D, Werner P, Raine CS. Glutamate excitotoxicity in a model of multiple sclerosis. Nature medicine 2000;6(1):67-70. 11. De Witte P. Imbalance between neuroexcitatory and neuroinhibitory amino acids causes craving for ethanol. Addictive
8
12. De Witte P, Pinto E, Ansseau M, Verbanck P. Alcohol and withdrawal: from animal research to clinical issues. Neuroscience and biobehavioral reviews 2003;27(3):189-197.
13. Rowland LM, Bustillo JR, Mullins PG, Jung RE, Lenroot R, Landgraf E, Barrow R, Yeo R, Lauriello J, Brooks WM. Effects of ketamine on anterior cingulate glutamate metabolism in healthy humans: a 4-T proton MRS study. Am J Psychiatry 2005;162(2):394-396.
14. Mullins PG, Rowland LM, Jung RE, Sibbitt WL, Jr. A novel technique to study the brain's response to pain: proton magnetic resonance spectroscopy. NeuroImage 2005;26(2):642-646.
15. Mangia S, Tkac I, Gruetter R, Van de Moortele PF, Maraviglia B, Ugurbil K. Sustained neuronal activation raises oxidative metabolism to a new steady-state level: evidence from 1H NMR spectroscopy in the human visual cortex. J Cereb Blood Flow Metab 2007;27(5):1055-1063.
16. Posse S, Otazo R, Caprihan A, Bustillo J, Chen H, Henry PG, Marjanska M, Gasparovic C, Zuo C, Magnotta V, Mueller B, Mullins P, Renshaw P, Ugurbil K, Lim KO, Alger JR. Proton echo-planar spectroscopic imaging of J-coupled resonances in human brain at 3 and 4 Tesla. Magn Reson Med 2007;58(2):236-244.
17. Henry ME, Lauriat TL, Shanahan M, Renshaw PF, Jensen JE. Accuracy and stability of measuring GABA, glutamate, and glutamine by proton magnetic resonance spectroscopy: A phantom study at 4Tesla. J Magn Reson.
18. Lee HK, Yaman A, Nalcioglu O. Homonuclear J-refocused spectral editing technique for quantification of glutamine and glutamate by 1H NMR spectroscopy. Magn Reson Med 1995;34(2):253-259.
19. Hennig J, Thiel T, Speck O. Improved sensitivity to overlapping multiplet signals in in vivo proton spectroscopy using a multiecho volume selective (CPRESS) experiment. Magn Reson Med 1997;37(6):816-820.
20. Soher BJ, Pattany PM, Matson GB, Maudsley AA. Observation of coupled 1H metabolite resonances at long TE. Magn Reson Med 2005;53(6):1283-1287.
21. Thompson RB, Allen PS. A new multiple quantum filter design procedure for use on strongly coupled spin systems found in vivo: its application to glutamate. Magn Reson Med 1998;39(5):762-771.
22. Choi C, Coupland NJ, Bhardwaj PP, Malykhin N, Gheorghiu D, Allen PS. Measurement of brain glutamate and glutamine by spectrally-selective refocusing at 3 Tesla. Magn Reson Med 2006;55(5):997-1005.
23. Choi C, Coupland NJ, Bhardwaj PP, Kalra S, Casault CA, Reid K, Allen PS. T2 measurement and quantification of glutamate in human brain in vivo. Magn Reson Med 2006;56(5):971-977.
24. de Graaf RA. in vivo NMR spectroscopy : Principles and Techniques: John Wiley & Sons; 2007.
25. Govindaraju V, Young K, Maudsley AA. Proton NMR chemical shifts and coupling constants for brain metabolites. NMR Biomed 2000;13(3):129-153.
26. Srinivasan R, Cunningham C, Chen A, Vigneron D, Hurd R, Nelson S, Pelletier D. TE-averaged two-dimensional proton spectroscopic imaging of glutamate at 3 T. NeuroImage 2006;30(4):1171-1178.
27. Prato FS, Drost DJ, Keys T, Laxon P, Comissiong B, Sestini E. Optimization of signal-to-noise ratio in calculated T1 images derived from two spin-echo images. Magn Reson Med 1986;3(1):63-75.
28. Traber F, Block W, Lamerichs R, Gieseke J, Schild HH. 1H metabolite relaxation times at 3.0 tesla: Measurements of T1 and T2 values in normal brain and determination of regional differences in transverse relaxation. J Magn Reson Imaging 2004;19(5):537-545.
29. Tsai SY, Otazo R, Posse S, Lin YR, Chung HW, Wald LL, Wiggins GC, Lin FH. Accelerated proton echo planar spectroscopic imaging (PEPSI) using GRAPPA with a 32-channel phased-array coil. Magn Reson Med
9 七、計畫成果自評
Overall, we have achieved the aim of this project. The quantification procedures for TE30 and TEavg protocols have been established and successfully implemented on in vivo experiments. The TEavg protocols based on PEPSI can be used to acquire 2-diemensional Glu maps in less than 10 minutes. Results showed that the TEavg protocols can achieve more reliable quantification on the Glu in 6 subjects. Optimization of TEavg protocols showed that 8 steps can have similar improvement in the quantification of Glu as 16 steps TEavg protocol. Based on current results, we can further compare the performance of these protocols on the quantification of Glu by accessing the reproducibility in the following projects.
八、與本計畫相關著作
會議論文
Wang, Woan-Chyi; Lin, Yi-Ru; Niddam, David M.; Tsai, Shang-Yueh, Reproducibility of glutamate and glutamine quantification in Cingulate Gyrus using proton echo planar spectroscopic imaging (PEPSI), Proceedings of International Society for Magnetic Resonance in Medicine, Melbourne, Australia, 2012
期刊論文
(SCI) David M. Niddam*, Shang-Yueh Tsai, Ching-Liang Lu, Cheng-Wen Ko, Jen-Chuen Hsieh. Reduced hippocampal glutamate-glutamine levels in irritable bowel syndrome: preliminary findings using magnetic resonance spectroscopy. Am J Gastroenterol. 2011 Aug;106(8); 1503-1511
1
國科會
補助出席國際會議報告
(補助編號:100-2320-B-004-002 )
20
thAnnual Meeting of the International Society for
Magnetic Resonance in Medicine
國際醫用磁共振學會第二十屆年會
2012/05/05~2012/05/11, Melbourne, Australia
會議心得報告
蔡尚岳 助理教授
政治大學應用物理研究所
2 一、參加會議經過 此會議乃磁振造影界一年一度的重要會議,因此不僅發表的論文水準相當 高,參與的人也多是在此領域研究多年,頗有心得的人。今年為國際醫用磁共振 學會第 20 屆年會於澳洲墨爾本市舉行,此次本人共有四篇文章發表。 會議於墨爾本市中心的 Convention Center 舉行,議程共分五天進行,之前再外 加兩天的 educational courses。五天內的 Scientific Meetings 總共涵蓋不同主題 的 oral presentations session 。 每 天 自 早 上 七 點 開 始 一 個 半 小 時 的 「 Sunrise educational course」,針對 MRI 各領域邀請傑出研究專家學者演講與進行座談。 每天有 9 個不同主題同時進行,此部分主要請一些相當有經驗的學者,已上課的 形式,介紹各領域技術的基礎和發展,雖然涵蓋很基礎的部分但是也會有很深入 的探討。本人今年主要專注於影像重建的部分和磁共振頻普及影像的部分
晨間的 session 結束後接下來會議當中安排了幾場特別的演講 (Plenary Lectures),請到領域中相當資深的研究人員主講,內容涵蓋現今較先進之研究現 況 , 如 :Psychological disease, microstructure 等 等 , 特 別 是 禮 拜 一 和 禮 拜 四 的
Lauterbur 以及 Mansfield lecture, 請到 MRI 領域的資深的研究者談論目前的發 展和未來,今年由 Prof. vivian Lee 談到 MRI 從科學到社會的連結,禮拜四則請 到 Prof. Paul Bottomley 教授談到關於開放式 MRI 的部分,受益頗多。
每天大會都會安排一家磁振造影設備大廠進行最新產品的介紹,對於目前 硬體上的發展,也提供相當多資訊。而且,由於世界各地優秀研究人員均會參 加,於休息時間,像 coffee break ,亦提供了一個跟其他國家研究人員交換意見 與討論的機會。 會議中參與的人士涵蓋醫界、工程界與業界。不僅可以得到工 程學術上的研究經驗,對於臨床上一些應用也更深入的瞭解 這樣的交流與學 習,不僅可以對目前頂尖 MRI 技術有更深認識,對於未來研究方向也有所助 益。 二、與會心得 此次會議本人主要選擇以磁振頻譜以及相關量化分析等議題(MRS of normal and fundamental physiology、MRS of disease);擴散影像應用及技術(Diffusion acquisition、acquisition of microstructure imaging);fMRI 連結性相關議題(fMRI connectivity mechanism、fMRI neuroscience applications and mechanisms);肝臟相 關議題(hepatobiliary and gastrointestinal),幫助了解目前的發展趨勢。同時關注的 還有在目前 MR 硬體技術上的發展。在一般議程中可參與晚間的研究論壇(study
3 group),由有興趣的研究人員共同參與討論,由資深研究人員發表實驗的一些經 驗,並由在場人員互相討論自身的使用情形,本人參與關於肝臟與肌肉脂肪量測 的議題。此外當然還有一些其他如硬體設備上的研究,以及廠商設備上的研發現 況。透過這樣的交流,使我對目前磁振造影界的發展與需求有更進一步的認知。 此行可為收穫頗豐。 三、攜回資料名稱及內容 會議論文隨身碟 四、發表論文附檔 共計發表論文四篇 僅附上論文摘要。
211
Re 1Depar Ta 4Grad Introd and ch these (GAB inform Spectr MRSI which contrib and th Metho Medic consta assess reprod param to 8 sl TEavg using LCMo quanti (Figur betwe Result were s (Table Gln. O and 10 with T assess simila Refere 1. Guss 2. Harr 3. Nidd 4. Tsai 5. Hurd 6. Prov19
eproducibility rtment of Electroni Taipei, Taiwan, 3Labduate Institute of Ap
duction
The cingulate c hronic pain [1,2,
conditions but A), the major in mation about pat roscopic imaging I protocol based h is in almost the bution of Gln an he combination o ods Sixteen healthy cal Solutions, Er ant short TE (TE sment of within-ducibility. Initial meters were used lices of outer vo g, eight TEs wer single average f Standard post p odel [6]. Metabo ified using the w re 1). The conc
en-week reprodu
ts and Discussio
Representative similar for the tw e 1). As expected Overall, COV for 0% for CC excep TEavg there wa sment of short-te ar performance o ence sew A, NeuroImag ris RE, Arthritis Rh dam DM, Am J Ga SY, MRM, 2008 d R, MRM, 2004 vencher SW, MRM Figur The R media (red) (green subjec y of glutamate ic Engineering, Na boratory of Integr pplied Physics, Na ortex (CC) in th ,3]. As the majo also as a mecha nhibitory neurot thological mech g (MRSI) metho on the PEPSI s e same spectral r nd in turn enhan of Glu and Gln (G subjects (7 mal rlangen, German E30) and (2) TE day reproducibi ly, a high-solutio : sagital PEPSI olume lipid suppr
re used from 35 for automatic pha processing was p olite concentratio water-scaling m centrations and ucibility of TE30 on maps of metab wo protocols ex d, smaller CRLB r TE30 were less pt for Gln (~20% as no obvious d
erm and long-ter on Glu but provid
ge,2011 heum., 2009 astro., 2011 M, 1993 re1 ROIs of al wall and CC n) of one ct and glutamin Woan-Chyi W ational Taiwan Un rated Brain Resear ational Chengchi U
he medial wall of or excitatory neu anism for drug ransmitter of th anisms and drug od that can be us sequence to dete range as Gln usi nce Glu in the sp
Glx) was evalua les/ 9 females; m ny) with a 32-ch E average (TEa lity. Eight subje on 3D T1 image acquisition; 14m ression were app ms to 185 ms w ase correction an performed for th ons of N-Acetyl method. ROIs of Cramer-Rao Lo 0 and TEavg pro olite concentrati xcept for Gln, G B for Glu and hig s than 5% for the %), which is in a difference in Glu
rm changes in b des more accurat
ne quantificati
Wang1, Yi-Ru Lin1, D
niversity of Science rch, Department of University, Taipei, T
f the brain is inv urotransmitter of intervention. G e brain. Quantif g dynamics. Pro sed to assess the ect Glu and Gln ing 1H MRS, a s
pectra [5]. Using ated with short-T mean±SD: 29.9± hannel head coi avg). All subjec ects returned for e was obtained fo mm slice thickne
plied along the p with 20 ms incr nd calibration of he PEPSI data a
Aspartate (NAA f the entire med
ower Bound (C otocols were asse
ions and CRLB Glx and mI (Tabl gher CRLB for G e medial wall an ccordance with t u COV between brain metabolite te quantification Figure2 Concentration m and CRLB map metabolites from TE30 protocol
ion in the cing imaging David M. Niddam e and Technology, f Medical Researc Taiwan, 5Reasear Taipei, Taiwan volved in a wide f the brain, gluta lutamine (Gln) fication of the G oton Echo Plana distribution of b in CC in less th spectral editing m g this protocol, TE PEPSI and TE ±8.2; range: 21 to l array. The rep ts were scanned
the same experi or localization o ess; 8 x 8 mm2 in perimeter of the rements. An add f metabolic conc as described pre A), total Creatine ial wall and CC RLB) of all m essed by the coe from one subje le 1). The CRLB Gln were found w nd 8% for CC (T
the CRLB result n the two protoc
s of the medial n of Gln and othe maps ps of 7 m Table 1 T concentra gulate cortex u m2,3, and Shang-Yue Taipei, Taiwan, 2B ch and Education, rch Center for Min
e range of pathol amate (Glu) play
is the precursor Glu and Gln met
ar Spectroscopy brain metabolite than 10 minutes method based on the reproducibil Eavg PEPSI. o 49 years;) wer producibility of d twice on the iment around 2 of the medial wa n-plane resolutio
brain. TE30 par ditional non-wate centrations. eviously [4]. Af e (tCr), Choline ( C were manually metabolites were efficient of varian ect are shown in B for NAA, tCr with TEavg indi Table 2). For TEa ts. It is notewort cols. In conclus wall. Compared er metabolites.
The average and st ation and CRLB fo
using proton e
eh Tsai4,5
Brain Research Ce Taipei Veterans G nd, Brain and Lear
logical condition ys an important r of both Glu a tabolism in CC Imaging (PEPS es [4]. In this stu . To further imp n TE averaging lity of the metab
re scanned on a MRSI was eval same day (with weeks later for ll and CC in the on; FOV=256 x rameters were T er suppression ( fter reconstructio (Cho), myo-Inos y selected on th calculated for nce (COV). n Figure 2. The r, and Cho were icating successfu avg, COVs were thy that although sion, the small d to the TEavg
tandard deviation o or all 16 subjects.
echo planar sp
enter, National Yan General Hospital, T rning, National Ch
ns including psy role not only in and Gamma-Am may therefore p SI) is a fast Mag udy, we propose
prove the detecti (TEavg) were u bolite concentrat
3T MR system luated by 2 PEP hout leaving the
the assessment e right hemispher
256 mm2; and T
TE = 30 ms and (NWS) PEPSI sc
on, spectra were sitol (mI), Glu, G he individual an
each ROI. The
mean metaboli e less than 8% fo
ul spectral editin e less than 6% fo h a better fit was COVs make PE protocol, the TE of Table 2 Within week COV of b pectroscopic ng-Ming University Taipei, Taiwan, hengchi University ychiatric disorder the pathology o mino Butyric aci provide importan gnetic Resonanc
a 2-diemensiona ion of Glu alone used to reduce th tions of Glu, Gl (Trio, SIEMEN PSI protocols: (1 scanner) for th of between-wee re. The followin TR=1500 ms. U NEX = 8 and fo can was acquire e quantified wit Gln and Glx wer natomical image e within-day an
ite concentration for both protocol ng/ suppression o or the medial wa s obtained for Gl EPSI suitable fo E30 protocol ha
n-day and between both protocols. y, y, rs of id nt ce al e, he ln S 1) he ek ng Up or ed th re es nd ns ls of ll lu or ad
-4408
Elimination of Frequency-modulated sideband artifacts for in vivo Non-Water Suppression MRS
Jyh-Miin Lin1, Tzu-Chao Chuang2, Wen-Chau Wu3, Hsiao-Wen Chung4,5, and Shang-Yueh Tsai6,7
1Department of Radiology, Duke University Medical Center, Durham, NC, United States, 2Department of Electrical Engineering, National Sun Yat-sen University,
Kaohsiung, Taiwan, 3Graduate Institute of Oncology, National Taiwan University, Taipei, Taiwan, 4Department of Electrical Engineering, National Taiwan University,
Taipei, Taiwan, 5Institute of Biomedical Electronics and Bioinformatics, National Taiwan University, Taipei, Taiwan, 6Graduate Institute of Applied Physics, National
Chengchi University, Taipei, Taiwan, 7Research Center for Mind, Brain and Learning, National Chengchi University, Taipei, Taiwan
Introduction
As an attractive alternative to water-suppressed (WS) MRS, non-water suppressed (NWS) MRS technique circumvents the disadvantages involving WS pulses which tend to suppresses surrounding metabolites. In addition, internal water references facilitate calibration of concentrations and retrospective motion correction [1]. However, parasitic frequency modulation (FM) sidebands are generally seen in NWS MRS. Although FM problem is not severe in long-TE spectra, the separation and removal of FM for short-TE NWS-MRS is difficult due to their decaying characteristics and the complexity of in vivo environments which contain multiplets, macromolecules, and distorted baselines.
Post-processing methods have the potential to fully remove the FM artifacts which were attributed to acoustic vibration caused by spoiler gradients [2]. Previous study has stated modulus signals to overcome FM sidebands [3], though no quantitative evaluations were made to compare its performance with WS spectra. In this study, we devised a novel algorithm based on time-domain model to remove the FM sidebands found in short-TE NWS MR spectra [2]. Since it is a post processing method without sophisticated prior knowledge, our method can be directly applied to practical usage. In addition, we quantitatively compare its performance with the modulus method and WS spectra.
Theory
Our work extends from time-domain algorithms, in which free-induction decays are modeled as the summation of complex sinusoids. First, by presuming eigenvalues of data matrices as the rotating and decaying rate of individual resonances, a pair of Hankel data matrices were built with FID. Second, to deal with FM sidebands, our method manipulates the FIDs with increases of the real-part of FID by (1+Δ), and decreases of the imaginary part by (1-Δ), where Δ is a freely adjustable parameter. Each of the original FIDs and the manipulated FIDs are used to build a pair of data matrices, which generate a total of four matrices. Ideally, these four matrices share the same eigenvalues and eigenvectors with additional information related to FM sidebands from the term (1+Δ) and (1-Δ). Thus, we can simultaneously solve these four matrices with two approaches of 1) generalized Schur decomposition (GSD, known as QZ) and 2) simultaneously GSD (SGSD) [4]. Notably, in the QZ method, we merely approximately enforce the transformation on the third and fourth matrices, since QZ is a method for two matrices. On the other hand, SGSD is a latest state-of-the-art algorithm which can deal with all four matrices. Finally, the FM sidebands are tracked by evaluating the changes of diagonal elements of these four matrices.
Methods
In vivo MR spectra were acquired from a 3T system (Trio, Siemens Medical Solutions, Erlangen, Germany) using an 8-channel coil array. Thirteen
healthy subjects were included in this study under informed consent. Single-voxel PRESS sequence was used to acquire MRS data from a selected volume (20×20×20 mm3) located in parietal lobe of the brain with experimental parameters of: TE=30 ms, TR=2000 ms, NEX=128, dummy scan =2,
bandwidth = 2000 Hz, and spectral points = 2048. For each subject, NWS and WS scans were collected sequentially. NWS data were processed with four different procedures for FM sideband removal, including regular NWS MRS without FM sideband removal, NWS MRS with QZ algorithm, NWS MRS with SGSD algorithm, and modulus NWS MRS, respectively. Three major metabolites of brain, N-acetylaspartate (NAA), Creatine (Cre), and total Choline (tCho) was quantified by jMRUI package with baseline subtraction and water scaling to calibrate the metabolites concentration.
Results and Discussion
FM sidebands are noticeably embedded at 3.2 ppm and 6ppm in the NWS MRS which increase the peak at 3.2 ppm compared with WS-MRS (Fig. 1). Qualitatively, the elevated peaks were restored through correction by SGSD algorithm, yielding better similarity to the WS-MRS spectrum (Fig 1). Quantitatively the metabolite concentrations were overestimated in NWS spectra before FM sideband removal, accompanied by larger standard deviations than WS spectra (Fig. 2). After sideband corrections, the mean concentrations were reduced by the QZ and the SGSD methods. The modulus method showed relatively inconsistent alterations in the concentrations for NAA (relatively unchanged) and tCho and Cre (reduced to values lower than WS spectra). Among all three methods, SGSD method shows best estimation in metabolite concentrations compared with the WS spectra treated as standard reference. In conclusion, we have demonstrated that the proposed QZ and SGSD algorithms are able to reduce water related FM sidebands artifacts in NWS MRS, which makes NWS MRS more practical in general applications. Further researches may include prior knowledge about FM sidebands for each scanner and experimental environments.
Acknowledgment
We thank the supports by National Science Council (NSC98-2320-B-182-003-MY2, NSC98-2221-E-002-095-MY3, NSC 97-2314-B-002-172-MY3) of this work.
References
1. Lin JM. MRM 2009;62:1394. 2. Clayton DB. JMR 2001;153:203. 3. Serrai H. JMR 2002;154:53. 4. De Lathauwer L. SIAM J Matr Anal App 2004;26:295. Fig.2. Mean and standard deviations of concentrations of NAA, tCho, and Cre from thirteen subjects. Clearly the FM sidebands caused over-estimation on the metabolic concentrations. SGSD shows restoration closest to the WS spectra treated as standard. Fig.1. Representative spectra of WS
MRS (upper), NWS MRS (middle) and NWS MRS after SGSD correction (bottom). Elevated choline peak can be clearly seen on the NWS MRS spectrum without sideband removal. After correction its level is reduced to the level close to that shown on the WS MRS spectrum.
2532
The potential underestimation of amino acids for the MR spectra analyzed by LCModel: the study of model spectra.
Hsiu-Fen Lin1, Cheng-Wen Ko1, Shang-Yueh Tsai2,3, Ping-Hong Lai4,5, and Thomas Lange6
1Dept. of Computer Science and Engineering, National Sun Yat-sen University, Kaohsiung, Taiwan, 2Graduate Institute of Applied Physics, National Chengchi
University, Taipei, Taiwan, 3Research Center for Mind, Brain and Learning, National Chengchi University, Taipei, Taiwan, 4Dept. of Radiology, Veterans General
Hospital-Kaohsiung, Kaohsiung, Taiwan, 5School of Medicine, National Yang-Ming University, Taipei, Taiwan, 6Department of Radiology, University Medical Center
Freiburg, Freiburg, Germany
Introduction
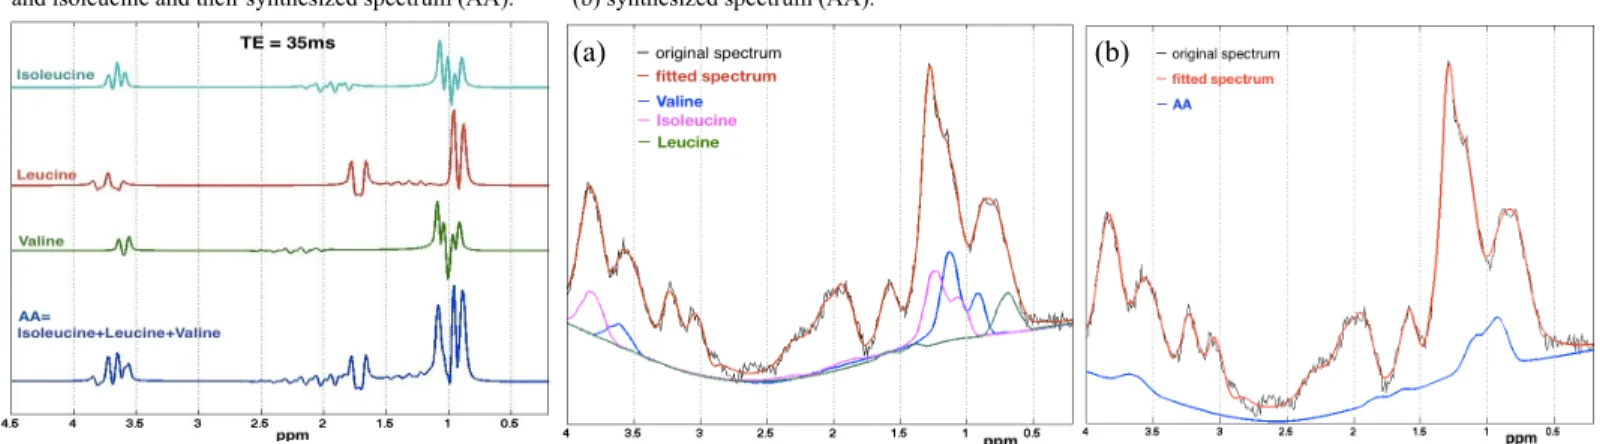
In vivo proton MR spectroscopy (MRS) along with LCModel [1] has been widely used as a reliable modality of diagnosis for brain tumors and abscesses [2]. In the meanwhile, amino acids (AA) such as valine, isoleucine and leucine have been recognized as key metabolites to categorize brain abscesses [2]. Therefore, in this study, we investigated the potential underestimation of amino acids caused by basis spectra for abscess patients. Short TE (35ms) spectra were analyzed by LCModel using basis set of AA (the combination of three metabolites) and that of valine, isoleucine and leucine respectively. Cramér-Rao lower bounds (CRLBs) were used as the criteria to identify the presence of amino acids in MRS.
Materials and Methods
A total of 8 patients with pyogenic brain abscesses were included in this study. All patients underwent MR studies on a 1.5T system (General Electric, Milwaukee, WI) using a quadrature head coil with conventional single voxel MR spectroscopy (MRS) protocol (PRESS, TR/TE = 1600/35 ms, Ave =192, voxel size = 2x2x2 cm3). Additional acquisitions with two different TEs (136 and 272 ms) were also performed in order to facilitate identifying the presence of amino acids in MRS for radiologists. The MRS data were analyzed by LCModel with two simulated basis sets generated by GAMMA [3] Visual Analysis (GAVA) [4] respectively. Both of the basis sets contained the following metabolites: alanine (Ala), aspartate (Asp), acetate(Ace), succinate (Suc), creatine (Cr), ©-aminobutyric acid (GABA), glucose (Glc), glutamine (Gln), glutamate (Glu), myo-inositol (m-Ins), lactate (Lac), NAA, N-acetylaspartylglutamate (NAAG), scyllo-inositol (s-Ins), glycerophosphorylcholine (GPC) and phosphorylcholine (PC). In addition, one of the basis sets includes separate basis spectra for valine (Val), leucine (Leu) and isoleucine (ILc) simulated with chemical shift and J-coupling values from Tikhonov and Kostromina [5], while the other one basis set included one synthetic AA basis spectrum composed of Val, Leu and ILc (composition ratio = 1:1:1) as illustrated in figure 1. Quantitative results obtained with the two basis sets were compared in terms of CRLBs (SD%). Only when the SD values of either valine, leucine, isoleucine or AA were smaller than or equal to 20%, the AA quantification was considered reliable.
Results and Discussion
All of 8 patients were diagnosed and confirmed the presence of AA in the MR spectra by radiologists. For 3 out of total 8 cases, AA could not be reliably quantified with any of the basis sets due to the poor quality of the short-TE spectra. Table 1 shows the SD values of the other 5 cases. Valine could be reliably quantified in these 5 cases when fitting with individual basis spectra of valine, isoleucine and leucine. On the other hand, when the synthesis spectrum of AA was used as the fitting model, AA could not be detected successfully in two cases. Figure 2 demonstrates the fitted spectra of case no. 4. In figure 2(a), it is obvious that valine and isoleucine can be
fitted more precisely with separate basis spectra than fitted with synthesized AA basis spectrum (Fig. 2(b)).
Our example shows that the synthetic basis spectrum of Val, Leu and ILc may reduce the reliability of spectrum fitting because the characteristics of each multiple resonances could become indiscernible due to the summation of three metabolites. Our result suggests that using individual model spectra as basis sets would achieve better fitting than using synthesized multiple model spectra for J-coupled metabolites. Investigators also need to be aware of this potential bias when acquiring the basis spectra from phantom solution.
References
[1] Provencher, SW., et al., MRM, 1993; 30: 672-79. [2] Garg M., et al., Radiol., 2004; 230: 519-27. [3] Smith SA., et al., J Magn Reson, Series A 1994; 106: 75-105.
[4] Soher, B.J., et al., J Magn Reson, 2007; 185: 291-9.
[5] Tikhonov VP. and Kostromina NA., Theor. Exp. Chem., 1978; 13: 372-78.
No
fitted by Basis sets of separate AA spec.
fitted by Basis sets of synthesized AA Valine Isoleucine Leucine AA
1 18% - - 19%
2 12% 25% - 8%
3 14% 38% - 10%
4 12% 20% 24% 26%
5 19% - - 37%
Figure 1. Simulated model spectra of valine, leucine, and isoleucine and their synthesized spectrum (AA).
Table 1. The SD values of fitted results using two different basis sets. SD% >40% indicated by “-”. Only SD%≤20% were recognized as reliable fitting (blue).
Figure 2. Fitted spectra of case no. 4 by using basis set of (a) separate model spectra (Val, Leu, ILc) and (b) synthesized spectrum (AA).
2585
Assessment of Liver Fat With T2 Correction Using Magnetic Resonance Spectroscopic Imaging
Jian-Jia Chiu1, Yi-Ru Lin1, and Shang-Yueh Tsai2,3
1Department of Electronic Engineering, National Taiwan University of Science and Technology, Taipei, Taiwan, 2Graduate Institute of Applied Physics, National
Chengchi University, Taipei, Taiwan, 3Reasearch Center for Mind, Brain and Learning, National Chengchi University, Taipei, Taiwan
Introduction
Non-alcoholic fatty liver disease (NAFLD) prevalence is increasing world-wide in recent decades. Early detection of NAFLD can prevent the further complications such as steatohepatitis, fibrosis and cirrhosis [1]. Among all noninvasive imaging techniques such as ultrasound, computed tomography, magnetic resonance imaging (MRI) and magnetic resonance spectroscopy (MRS) have been used to detect hepatic steatosis [2-4], MRS is known to be the most accurate method for the quantification of lipid contents for hepatic steatosis [5]. Previous we have shown that fast magnetic resonance spectroscopic imaging (MRSI) technique, proton echo planar spectroscopic imaging (PEPSI) [3], is able to detect the spatial distribution of liver fat content with around 3 c.c. in-plane resolution. With PEPSI, one acquisition can be finished in less than 20 seconds [6]. In this study, we will extend our work to further consider the quantification errors from relaxation effects [7]. The aim of this study is to investigate the influence of T2 relaxation effects and the accuracy of quantification on the measurement of hepatic fat content.
Method
A total of 6 subjects without history of hepatitis or other liver diseases participated in this study (all male, averaged age: 25.4, range: 22~33, body mass index (BMI) range: 25.1~32.7 kg/m2). Subjects were in supine position using an abdominal surface array coil along with spine array coil. Before PEPSI a set of T1-weighted anatomic images were acquired for localization. Non-water suppressed liver spectra were obtained using PEPSI sequence. Experiment parameters include: matrix size 16x32, FOV ranging from 270x360~300x400 mm2 according to
subject size, slice thickness = 15 mm, TR=1000ms, and TE varied from 15 to 55 ms (5 steps). The scan time is 17 seconds for one acquisition and all subjects were instructed to hold breath during the period of single scan. Regular reconstruction process was carried out first for PEPSI data as described in previous report [3]. For each spectrum, signal from water and lipid were quantified by Lorentzian function curve fitting with baseline correction. In this preliminary study, only signal from methylene (-(CH2)n-, 1.3ppm) group were fitted for lipid. T2 relaxation times of
water and Lipid were calculated by nonlinear exponential curve fitting and water and lipid signal without T2 relaxation were acquired by extrapolating the fitting curve . Hepatic fat content (Fat%) was defined as . Only voxels with both fitting reliability (R2 values)
of water and lipid larger than 0.8 were included for analysis. The averaged Fat% and T2 values were then obtained from a manually selected ROI within liver. To exclude the influence of subcutaneous fat, ROI is chosen to be smaller than boundary of liver. PEPSI scans were repeated 8 times for each subject to observe the reproducibility of T2 correction.
Result and Discussion
The lipid contents were successfully detected in all subjects. Figure 1 showed the original spectra and fitted spectra of 5 TEs of the same voxel from one subject. It can be observed that water and lipid peaks progressively decreased as TE increased. Representative T2 relaxation plot of water and lipid signal were shown in Figure 2. The spatial distribution of Fat% and T2 values were shown in Figure 3. Table 1 listed quantified T2 values of water and fat and the T2-corrected Fat%. Measured T2 values ranged from 20.52 to 27.81 ms for water, and from 41.75 to 61.69 ms for fat. We also listed uncorrected Fat% measured from TE=15, 35, and 55ms in Table 1 for comparison. It is obvious that the overestimation of Fat% becomes more crucial as TE becomes longer. However, even for the shortest TE, there were still 1~23% overestimation. The standard deviation of Fat% between scans were less than 1.4% for all subjects, indicating high reproducibility.
In conclusion, PEPSI as a fast MRSI method is a reliable method for the quantification of liver fat content. With our protocol, hepatic fat content distribution with T2 correction can be achieved in less than 3 minutes. And the measured fat content is highly reproducible. In addition to better accuracy for quantification of fat content, T2 relaxations of fat and its potential spatial variation may be also useful information, which is under further investigation.
Reference
1. NA Johnson, et al., Hepatology, 2008, 47: 1513-1523 2. GJ Cowin, et al., JMRI, 2008, 28: 937-945
3. SM Mazhar, et al., Clin Gastroenterol Hepatol, 2008,7: 135-140 4. ES Siegelman, MA Rosen, Semin Liver Dis, 2001, 21: 71-80 5. AE Bohte, Eur Radiol, 2011, 21: 87-97 6. SR Chen, et al., ISMRM, 2011
7. P Sharma, et al., JMRI, 2009, 29: 629-635
Age BMI(kg/m2) T2
Fat (ms) T2Water (ms) Fat% Fat%TE15 Fat%TE35 Fat%TE55
S1 24 32.7 45.84±5.53 21.91±0.70 10.40±0.68 14.9±1.22 22.94±1.47 41.98±3.92 S2 23 27.4 41.75±9.07 25.49±0.92 6.58±0.76 7.79±0.58 9.93±0.51 14.97±2.28 S3 33 30 61.69±4.61 27.81±0.34 34.23±1.38 57.38±1.56 116.6±2.35 230.92±4.18 S4 27 28.7 42.14±5.24 23.96±0.38 7.3±0.61 8.77±0.44 12.12±0.64 18.15±1.16 S5 25 25.2 43.62±8.10 23.77±1.44 7.61±0.80 8.54±0.27 12.72±2.31 16.35±2.19 S6 29 32.2 59.42±6.85 20.52±1.46 17.53±0.95 28.49±0.76 54.92±2.57 116.53±17.58
Figure1 Representative spectra of 5 TEs
from one subject Figure2 Signal intensity vs. TE for fat and water
10 20 30 40 50 60 0 0.1 0.2 0.3 0.4 TE (ms) S ig n al In te ns ity (IU ) Fat Water
Figure3 Fat% map and T2 maps
Table1 The averaged and
standard deviation of T2 values and Fat% for all 6 subjects
water fat/S
S
= Fat%
國科會補助計畫衍生研發成果推廣資料表
日期:2012/08/31國科會補助計畫
計畫名稱: 利用快速頻譜影像技術量測大腦谷氨酸濃度分布 計畫主持人: 蔡尚岳 計畫編號: 100-2320-B-004-002- 學門領域: 醫學工程無研發成果推廣資料
100 年度專題研究計畫研究成果彙整表
計畫主持人:蔡尚岳 計畫編號: 100-2320-B-004-002-計畫名稱:利用快速頻譜影像技術量測大腦谷氨酸濃度分布 量化 成果項目 實際已達成 數(被接受 或已發表) 預期總達成 數(含實際已 達成數) 本計畫實 際貢獻百 分比 單位 備 註 ( 質 化 說 明:如 數 個 計 畫 共 同 成 果、成 果 列 為 該 期 刊 之 封 面 故 事 ... 等) 期刊論文 0 0 100% 研究報告/技術報告 0 0 100% 研討會論文 0 0 100% 篇 論文著作 專書 0 0 100% 申請中件數 0 0 100% 專利 已獲得件數 0 0 100% 件 件數 0 0 100% 件 技術移轉 權利金 0 0 100% 千元 碩士生 0 0 100% 博士生 0 0 100% 博士後研究員 0 0 100% 國內 參與計畫人力 (本國籍) 專任助理 0 0 100% 人次 期刊論文 1 1 100% 研究報告/技術報告 0 0 100% 研討會論文 1 1 100% 篇 論文著作 專書 0 0 100% 章/本 申請中件數 0 0 100% 專利 已獲得件數 0 0 100% 件 件數 0 0 100% 件 技術移轉 權利金 0 0 100% 千元 碩士生 2 0 100% 博士生 0 1 100% 更 換 至 政 治 大 學 應用物理研究所 ,因所內無博士班 因 此 均 轉 換 為 碩 士 班 兼 任 研 究 助 理 博士後研究員 0 0 100% 國外 參與計畫人力 (外國籍) 專任助理 0 0 100% 人次其他成果