行政院國家科學委員會專題研究計畫 成果報告
臺灣地震地質研究-臺灣西南部活斷層研究--臺灣西南部活
動斷層活動性近斷層監測之研究(IV)
研究成果報告(精簡版)
計 畫 類 別 : 整合型 計 畫 編 號 : NSC 95-2745-M-002-003- 執 行 期 間 : 95 年 08 月 01 日至 96 年 07 月 31 日 執 行 單 位 : 國立臺灣大學地質科學系暨研究所 計 畫 主 持 人 : 胡植慶 共 同 主 持 人 : 饒瑞鈞 計畫參與人員: 碩士班研究生-兼任助理:陳雅琳、楊宜蓉、童忻、黃筱婷 共同主持人:饒瑞鈞 報 告 附 件 : 出席國際會議研究心得報告及發表論文 處 理 方 式 : 本計畫可公開查詢中 華 民 國 96 年 11 月 26 日
國科會計畫成果報告
臺灣地震地質研究-臺灣西南部活斷層研究--臺灣西南部活動斷層活動性近斷層 監測之研究(IV) 計畫主持人 胡植慶 國立臺灣大學地質科學系 計畫成果:二篇投稿於 Tectonophysics 接受,文章如後:1. Huang, M.-H., *Hu, J.-C., Hsieh, C.-S., Ching, K.-E., Rau, R-J., Pathier, E., 2007. Active deformation of Tainan Tableland of southwestern Taiwan based on geodetic measurements and SAR interferometry. Tectonophysics, accepted. (SCI) 2. Cheng, L.-W., Lee, J.-C., *Hu, J.-C., Chen, H.-Y., 2007. Inversion of the 2003
Chengkung Earthquake in Eastern Taiwan, Revealed by GPS data. Tectonophysics, accepted. (SCI)
計畫成果: Abstract
The D-InSAR technique is applied to detect the active fault-related folding structure of the Tainan tableland near the deformation front in SW Taiwan by using ERS SAR images during 1996-2000. The Tainan tableland is located in-between a blind fault in the west and the Houchiali fault in the east, thus the Tainan tableland is interpreted as a pop-up structure in a fold-thrust belt at active tectonic margin. Interferometric processing of six SAR images reveals the average slant range deformation (SRD) as ~12.5 mm/yr. The uplift rate is higher in eastern Tainan tableland than that in western Tainan tableland, and it increases from west edge of Tainan tableland and decreases across the Houchiali fault. The campaign-mode GPS data set from 1999 to 2003 indicate an average horizontal movement of 12±4 mm/yr in the direction of N44oW for the Tainan tableland with respect to western coastline. Furthermore 5 precise leveling surveys across Tainan tableland over a period of 2 years show an uplift rate of ~14 mm/yr for the benchmarks on the tableland. Based on the 2-D analytical solution with the constraint of he inferred fault geometry, the slip rate along the inferred Tainan fault is ~16 mm/yr, ~10 mm/yr along the Houchiali fault, and ~25 mm/yr along the inferred Chungchou fault. Consequently we propose that active deformation of the Tainan Tableland is likely resulted from the freely slipping of the Tainan fault and the Houchiali fault. The locking depth should be located on the deeper part of décollement, eastern of the Chungchou fault. In addition,
the combination of D-InSAR, GPS data and the precise leveling data reveals that the short-term deformation rate is larger than long-term deformation rate, which implies that a destructive seismic event could occur in the eastern Tainan area.
1. Introduction
Space geodetic techniques, especially the Interfreometric Synthetic Aperture Radar (InSAR), have become a powerful tool for high accuracy geodetic monitoring of a wide range of deformation associated with earthquakes and volcanoes, fault activity and crustal deformation at plate boundaries (Massonnet and Feigl, 1998; Bürgmann et al., 2000). The still ongoing collision between the Luzon volcanic arc and the China continental margin of Eurasian plate began ca. 5 Ma (e.g., Suppe 1984; Angelier, 1986; Ho, 1986; Teng, 1990, 1996). The collision belt connects the Ryukyu subduction zone, where Philippine Sea plate is subducting beneath the Eurasian plate, and the Manila subduction zone, where the Philippine Sea plate is overriding the crust of South China Sea (Fig. 1). The GPS measurements and the NUVEL-1 and -1A models of global plate motion predict motion of the Philippine Sea plate toward the northwest (~305o-310o), at a rate of 70-82 mm/yr relative to the Eurasia plate, in good directional agreement with the previous estimates (Seno et al., 1993; Yu et al., 1997, 1999; Zang et al., 2002). The orogenic belt of central-southern Taiwan is undergoing strong crustal deformation, rapid uplift and high denudation and erosion rate in a typical compressional regime. Thus Taiwan is one of the most active seismic regions in the world. More than twelve large earthquakes (Mw > 6) occurred since 1900, including the 1999 Mw 7.6 Chi-Chi earthquake (Fig. 1). These destructive earthquakes resulted in serious damage and causality in the dense population area. To this respect, the situation of the coastal plain area of western Taiwan is particular, because newly initiated blind fault systems are present near the deformation front of the Taiwan mountain belt. This fault activity resulting from the arc-continent collision induces larger earthquake hazard than previously thought in the western alluvial plain.
The Tainan tableland is a significant morphological expression of an active growing structure near the deformation front located in SW Taiwan (Fig. 2a). The Tainan City is located on this active structure. Recent research suggested that the Houchiali fault, which is located along the eastern boundary of the Tainan tableland, may be an active fault (Lin et al., 2000). Based on the study of Holocene sea-level curve and the 14C dating of driftwoods and mollusc samples of coastal sediments, the long-term (Holocene) uplift rate of the Tainan tableland is about 5 mm/yr (Chen and Liu, 2000). However the preliminary result of InSAR (Interfreometric Synthetic Aperture Radar) revealed a ground motion of 2.8 cm along the radar line of sight towards the satellite during the period 1996-1998 (Fruneau et al., 2001). Using
geodetic constraints from limited campaign-mode GPS, the latter authors pointed out that the displacement vectors of vertical and horizontal components reached 32 mm/yr and 16 mm/yr (respectively), for a period of about two years. Their results thus suggested an uplift rate of ~16 mm/yr.
After these first reconnaissance works, a dense survey mode GPS network and precise leveling have been established around the Tainan tableland by the Central Geological Survey of Taiwan (Rau et al., 2003). The goal of this study is to take advantage of these more accurate geodetic data, together with new interferometric analyses based on the InSAR technique, to better characterize the deformation pattern and the uplift rate of the Tainan tableland.
2. Tectonic Setting
The complex tectonic environment in Taiwan is the result of the collision of Eurasian Plate and Philippine Sea Plate at the rate of 78.7 mm/yr toward northwest relative to Penghu Islands (Yu et al., 1999) and the change in polarity of the subduction between the two plates (Fig. 1). The investigated area of SW Taiwan corresponds to the southern part of a Plio-Pleistocene foreland basin which developed in response to lithospheric flexure due to the tectonic loading of the Central Range orogenic belt (Lin and Watts, 2002). The westernmost surface exposures of the fold-and-thrust belt reach the boundary between the Foothills region near the Tainan tableland (Sun et al., 1998; Chen and Liu, 2000).
The Tainan plain can be divided into three main geomorphic features that differ in structural grain. From the west to the east, these major features are the Tainan tableland, the Tawan lowland and the Chungchou terrace (Fig. 2a). The major part of the Tainan city has been built on an approximately 12.5 km long, 4 km wide and 30 m high N-S elongated tableland. This tableland has a N20oE trending axis; it shows an east-west asymmetry, because the western part it is gently dipping to the west whereas the eastern part is bounded by a steep slope considered as a fault scarp. This fault scarp was mapped as the Houchiali fault, based on geophysical and geological data (Chen and Liu, 2000). The Tawan lowland has an average altitude of about 6 m above see-level and the elevation is increasing eastward. The Tawan tableland thus gradually merges with the third morphological unit, the Chungchou terrace, which is located just west of the Western Foothills, the westernmost main unit of the mountain range of Taiwan (Fig. 2a).
According to recent studies (Deffontaines et al., 1997; Lacombe et al., 1999; Chen and Liu, 2000), the Tainan tableland, Tawan lowland, and the Chungchou terrace are separated by two major thrust faults: the Houchiali fault and the Chungchou fault. A third major thrust fault, the Tainan fault, bounds the Tainan
tableland to the west. This Tainan fault is regarded as the outermost thrust and probably corresponds to the outermost deformation front of the collision zone between the Eurasian Plate and the Philippine Sea Plate. The structural grain of the accretionary wedge trends NNW-SSE in the deep offshore area but bends toward a NNE-SSW trend in the shallow offshore area west of Kaohsiung (Liu et al., 1997, 2004). It is thus suggested that the Manila Trench connects to the onland thrust structure in SW Taiwan, near the Tainan-Kaohsiung area.
3. Method and Data
We applied the InSAR technique with two-pass approach using the ROI (Repeat Orbit Interferometry) for InSAR processing and SNAPHU (Statistical-Cost, Network-Flow Algorithm for Phase Unwrapping) for phase unwrapping (Chen and Zebker, 2002). The principle of such interferometric analysis is relatively simple: if a spatial ground displacement occurs between two acquisitions of SAR images from satellite, one can accurately measure this displacement provided that other causes of perturbation are identified and ruled out (the details of this process are not discussed herein). Then, subtracting the topography from the interferogram by using the existing digital elevation model (DEM), one obtains the displacement along the line of sight (LOS) towards the satellite. The method is referred to as the D-InSAR (Differential InSAR) technique (for details see Massonnet and Feigl, 1998; Bürgmann et al., 2000). The satellites ERS-1/2 developed by ESA (European Space Agency) carry the C-band (λ = 5.67 cm) SAR equipment and can monitor on Earth from an altitude of about 800 km in all-day and all-weather conditions.
We used the Taiwan 40m×40m DEM with 5 m average height accuracy for the topography in the Tainan area, showing an average height of 20 m on the Tainan tableland. The magnitude of the signal of interferograms is strongly dependent on the baseline of the satellites. Generally the shorter baseline distance is more suitable for crustal deformation monitoring; in contrast, the longer baseline is more suitable for DEM construction, so the shortest baseline pair can provide a better signal (Zebker et al., 1997; Hanssen, 2001). In this study we apply InSAR for crustal deformation, and therefore the short baseline selection is needed. During the interferometry process, the phases due to the topography and the curvature of the earth were removed by the Taiwan 40m×40m DEM and from the precise orbit indicated by the Delft University, Nederland. The interferograms are processed by using ROI from JPL (Jet Propulsion Laboratory), NASA and the phase unwrapping procedure is achieved by SNAPHU (Chen and Zebker, 2002).
The InSAR data used in this study consist of six SAR images from a descending orbit (track 232, frame 3145) spanning a time interval of four years (1996-2000).
These images were acquired on (A) 16 May 1996; (B) 12 Nov 1998; (C) 21 Jan 1999; (D) 6 May 1999; (E) 28 Oct 1999 and (F) 12 Oct 2000. In order to observe the continuously deformation, we chose image (A) as the master image and other five as slave images, in order to obtain the relation of deformation with time in study area. Therefore five interferograms (pairs B-A, C-A, D-A, E-A and F-A) are obtained and are correspond to the time span of deformation of 910, 980, 1085, 1260, 1610 days (ambiguity height: 80.1, 103.7, 42.2, 43.2, 103.6 m) from 16 May 1996, respectively (Table 1).
Interferogram patterns are commonly affected by poor image coherence caused by abrupt terrain and dense vegetation in Taiwan. However, several studies have successfully used this technique to identify deformation in urban areas (Fruneau et al., 2001; Pathier et al., 2003; Chang et al., 2004). Because the central and northern Tainan tableland is occupied by typical urban areas, the quality of interferograms is good enough to detect the crustal deformation in a long time interval. However, in the southern Tainan tableland, the interferogram quality remains poor even for the 2 years pair.
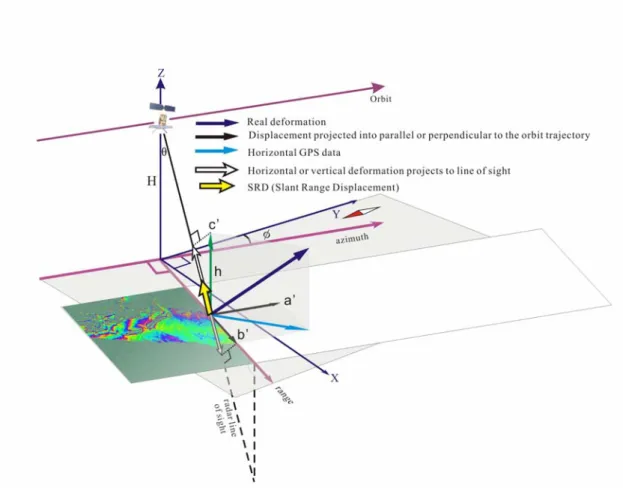
3.1. Coordinate transformation from SRD to 3D deformation based on geodetic data
The slant range displacement (SRD) detected by D-InSAR, both for descending and ascending orbit, which imply only one-dimensional deformation. The goal of our study is to obtain 3-D deformation based on precise GPS horizontal displacement, vertical height changes from leveling and SRD of D-InSAR calculated by geometric relationship (Fig. 3). We derive the equations that can transfer coordinate from SRD into Cartesian coordinate system. Assume that the GPS displacement vector V = (a, b, 0), so we need to project V onto the direction of the trace of satellite, denote as (a', b', c'),
' cos sin 0 cos sin
' sin cos 0 sin cos
' 0 0 1 0 0 a a a b b a c b b
φ
φ
φ
φ
φ
φ
φ
+φ
⎡ ⎤ ⎡ ⎤ ⎡ ⎤ ⎡ ⎤ ⎢ ⎥ ⎢= − ⎥ ⎢ ⎥ ⎢= − + ⎥ ⎢ ⎥ ⎢ ⎥ ⎢ ⎥ ⎢ ⎥ ⎢ ⎥ ⎢ ⎥ ⎢ ⎥ ⎢ ⎥ ⎣ ⎦ ⎣ ⎦ ⎣ ⎦ ⎣ ⎦ , (1)where φ is intersection angle between the trace of satellite and the north; a and b are the projection of displacement of GPS along east and north, respectively. a' and b' are the projection of V onto parallel and perpendicular the trace of the satellite, respectively. After that we project the displacement onto the LOS,
cos ( cos sin )sin
h θ + a φ+b φ θ = Δ (2) r
D-InSAR, θ is the looking angle of satellite, h is the vertical displacement, and we can rewrite Equation 2 as,
sec ( cos sin ) tan
h= Δr θ − a φ+b φ θ (3) from Equations 2 and 3 we can derive the relationship between LOS and Cartesian coordinate system, and this would imply that we can obtain the vertical displacement from D-InSAR based on horizontal displacement of the GPS data, even though the GPS data is sparse distribution relative to the very dense data of D-InSAR in urban area.
4. Results and Analysis
4.1. D-InSAR
The five interferograms (B-A, C-A, D-A, E-A and F-A) revealed similar fringes style and patterns (Fig. 4) evolved with time (see the fringe patterns within 910 days and much denser ones within 1610 days as shown in Figs. 4b and f). With the comparison of the topography, we can find that the boundary of the deformation pattern is fitted to the shape of the Tainan tableland. As Figs. 4b to f shows, the gradient of the fringes in pair F-A (1610 days) is better expressed than in pair B-A (910 days), while the area covered by fringes is smaller. The denser fringes (which mean higher deformation rate) represent the continuing deformation on the Tainan tableland. On the contrary, the sparser fringes represent the lower coherence. In the urban area (the northern Tainan tableland and the middle part of Tawan lowland), the phase is well preserved because the buildings or walls acted as corner reflectors which can nearly totally reflect the signals.
A fringe of phase corresponds to a SRD of about 2.8 cm (a phase variation of 2π radians) along the LOS to the satellite. For the profile AA’ (Fig. 2a), all the five interferograms reveal that the SRD trend indicates uplifting of the Tainan tableland and relative subsidence in the Tawan lowland. Interesting, this conclusion fits quite well simple consideration of the topographic profile across the Tainan tableland (Fig. 2b). However, in detail the eastern boundary of the uplift area of eastern Tainan tableland is not located along the eastern edge of the Tainan tableland, but further east (at a distance of ~1 km east from the Houchiali fault). We consequently consider that another shallower dipping active back-thrust fault exists east of the Houchiali fault. We discuss it in detail later.
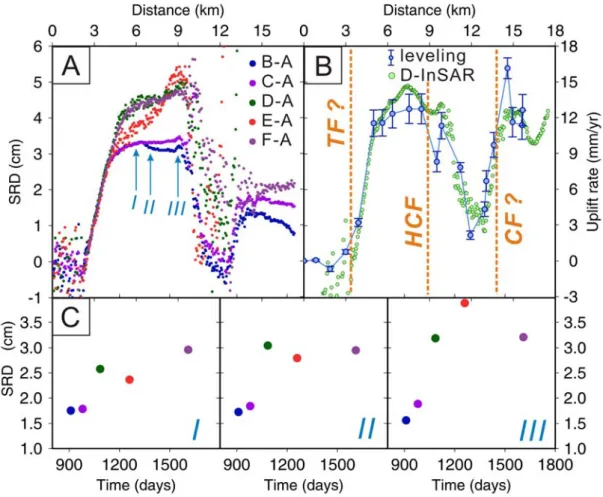
Concerning to the temporal analysis, we selected the westernmost benchmark of the precise leveling as a reference point along profile AA’ to show the evolution of displacement with time (Fig. 5). The SRD rate is increasing with time, and the curve
of SRD rate is roughly linear with values of about 7.7 mm/yr, 11.6 mm/yr and 18.9 mm/yr at points I, II and III, respectively. This shows that the uplift rate is higher in eastern Tainan tableland than that in western Tainan tableland. Note that in pair E-A the shape of the curve near the Houchiali fault is different from others. Interestingly, this pair was temporally located across the occurrence of the Chi-Chi earthquake in central Taiwan. We infer that this major earthquake probably induced limited displacement on the Houchiali fault, which accounts for the greater SRD near the Houchiali fault with respect to other profiles.
4.2. GPS & leveling data
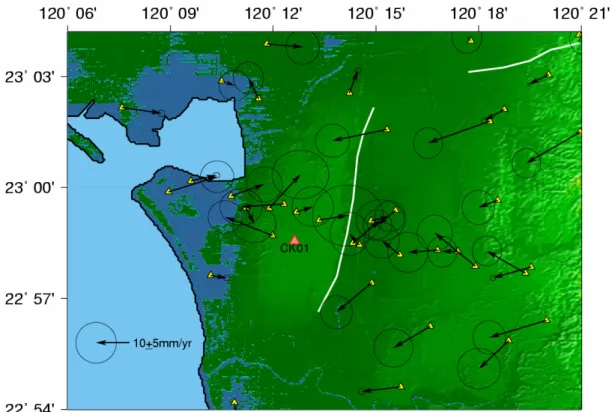
Rau et al. (2003) used GPS and precise leveling data to detect the surface deformation and earthquake potential of the Tainan tableland. We use S01R located in the Penghu Island as a reference station (Fig. 1), the average station velocity is about mm/yr in a direction of 316° on the Tainan tableland. On the eastern edge of Tainan tableland and toward eastern side, the average horizontal velocity is about 17 mm/yr in the direction of 271°. In generally the horizontal velocity on the Tainan tableland is increasing from west to east with the rate 17-40 mm/yr in a direction of 260°, and the direction of horizontal velocity in the Tainan tableland is almost perpendicular to the direction of long axis of the Tainan tableland (N20°E). Due to the small velocities differences between the stations in the Tainan area, we change the reference station to the CK01 station which located in the center Tainan tableland, so that we can find the velocities distributed from outside Tainan tableland inward into the Tainan tableland (Fig. 6). Opposite to the outside stations, the stations located in the Tainan tableland indicate the outward velocities distribution, which imply an extensional circumstance in the Tainan tableland, in good agreement of with the strain rate distribution in Section 4.3.
Using the precise leveling measurements for a period of 2 years (from 2001 to 2003) (Rau et al., 2003), the average uplift rate is about 11-13 mm/yr on the tableland relative to the western most station (Fig. 2), and it decreases to about 2.5 mm/yr on the Tawan lowland. But on the Chungchou terrace which located in further eastward to the Tawan lowland, increases again and up to 12-17 mm/yr. In Fig. 5b, the orange dotted lines indicate the locations of the faults system, and we can find the Tainan fault and the Chungchou fault are located in the places with strong deformation. This ongoing activity implies the continuously active in the faults system. However, on the eastern side of the Tainan tableland, there are two deformation drops between the distance 9 km and 13 km (Fig. 5b), but the Houchiali fault is not located in the most deformation drop area, so maybe the there exists another fault which makes the eastern deformation drop.
We adopted the GPS horizontal data as constraints to transfer the displacement from LOS into the vertical direction. For ERS-1/2, the looking angle (θ) is between 19°-27° and the direction of descending orbit (φ) is N12.5°E. We thus substituted these parameters into Equation 3, so that we could obtain the vertical deformation rate along profile AA’. The vertical velocities show an abrupt decrease near the Houchiali fault and another noticeable decrease east of the Houchiali fault (Fig. 5b). In a similar way, the velocity also decreases westward at the western edge of the Tainan tableland. It also shows a convex shape near the centre of the Tainan tableland, with an uplift rate about 12.48 mm/yr that is slightly larger than the SRD rate. To summarize, the results of leveling measurements resemble those from D-InSAR observation throughout the studied area but are slightly smaller on the Tainan tableland. Deffontaines et al. (1997) and Lacombe et al. (1999) suggested an anticline with east dipping thrust and west dipping back-thrust system beneath Tainan tableland and an east-dipping thrust fault further East beneath Chungchou terrace. All these structures were connected to a shallower décollement on the depth of about 3.5 km. Our observations based on SAR interferometry and geodetic data are in good agreements with their conclusion.
4.3. Deformation revealed by Strain rates & rotation rates
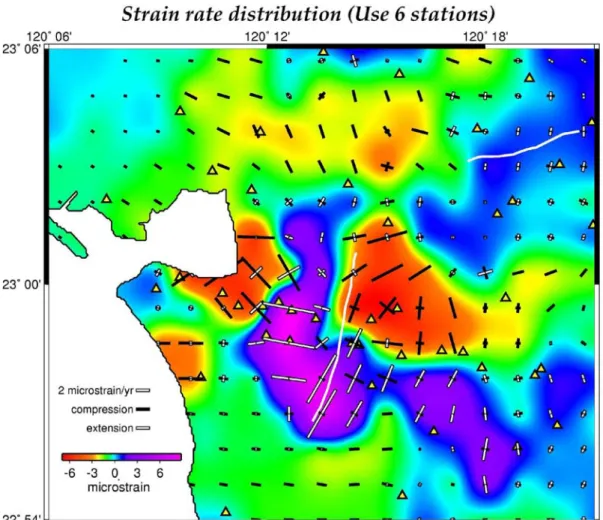
Strain rates using grids distribution can reveal a uniformly deformation and strain pattern and highlight the compressional and extensional regions. In Tainan area we chose grids intervals as 0.015o (1.65 km) for one grid with calculation of velocities from 7 nearest GPS stations. Furthermore, we take the uncertainty for weighting. The deformation is made by the linear interpolating of these grids. Figure 8 showed the deformation and principal strain in Tainan area, the warmer color represented the compression area, the cooler color represented the extension area and the light blue represented the undeformed area.
The major extension area locates on Tainan tableland and changes to be compression (about +6 μstrain/yr) on the surrounding area of Tainan tableland. The value of western compression region is about -4 μstrain/yr and located on the northwest side of Tainan tableland; the value of eastern compression region was about -6 μstrain/yr and located on Tawan lowland separated from the extension region by the Houchiali fault. On the Tainan tableland the two principal strain rate axes were both extension and the major axis is orientated about E-W direction and slightly rotated into NE-SW direction. As across the eastern edge of Tainan tableland, the maximum principal strain rate axis became compressional in E-W direction and maintains the similar value and orientation of minimum principal strain rate on Tainan tableland. To the north, the orientation of the compression axis rotated
counterclockwise into NE-SE direction. In the similar way, the principal axes on western Tainan area became a compression region when across the western edge of Tainan tableland (the “Tainan fault”) and to the north the compressional axis rotated clockwise from E-W into SE-NW direction. From the result of the strain rate and deformation rate pattern, we may find that the orientations of principal axes and the deformation pattern are symmetric to the center of the Tainan tableland. It is reasonable to infer that the outline of the major extension figure is similar to the periphery of the Tainan tableland. But due to the limitation of the non uniform distribution and larger uncertainties of the GPS measurements, we can only obtain a deformation pattern that roughly similar to the periphery of the Tainan tableland (Fig. 2).
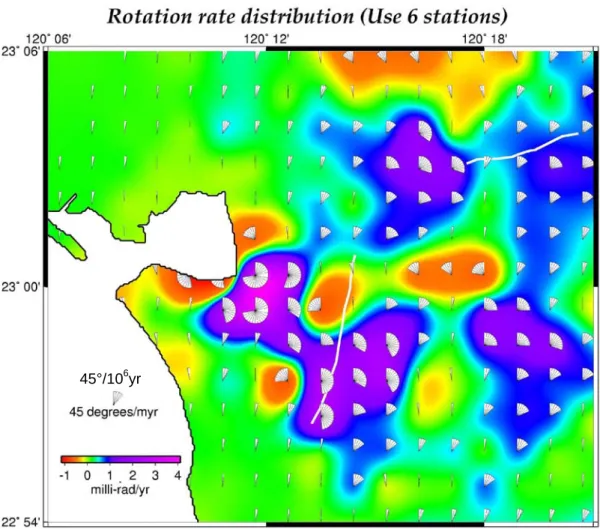
Figure 8 showed the rotation rate distribution, most grids reveal the clockwise rotation, and the maximum value is predicted on the Tawan lowland with the value of 62 degree/myr. But on the northern Tawan lowland the rotation rates are counterclockwise rotation with the value of about 40 degree/myr. We also can find the symmetry on both eastern and western sides of Tainan tableland in rotation rates. It is considerable that the extension and uplifting phenomena are the result of the pop-up structure beneath Tainan tableland and the symmetrical regions are the transition zones in order to balance the stresses from the central Tainan tableland.
4.4. 2-D dislocation models
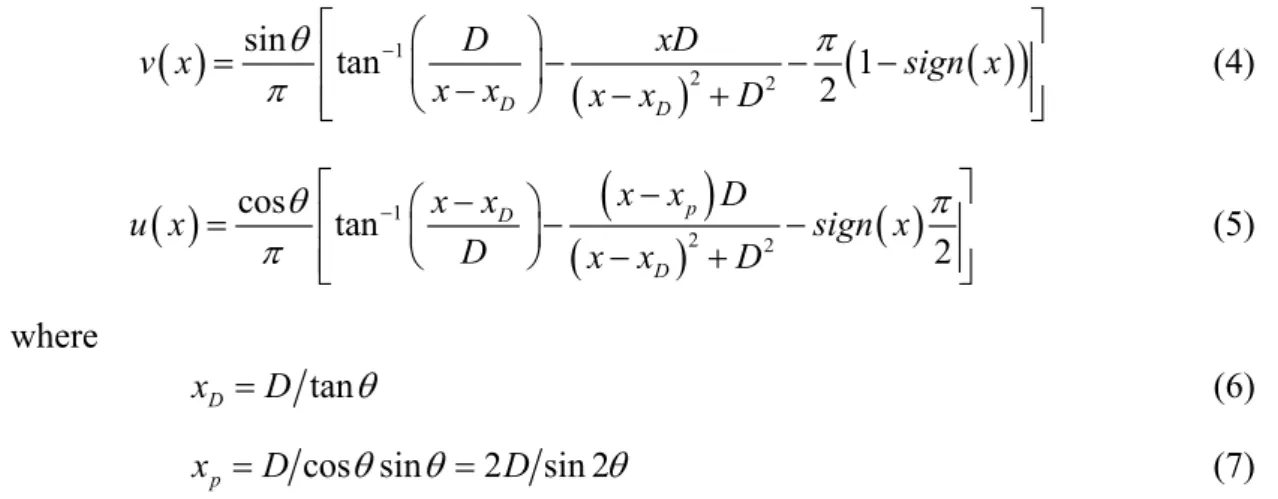
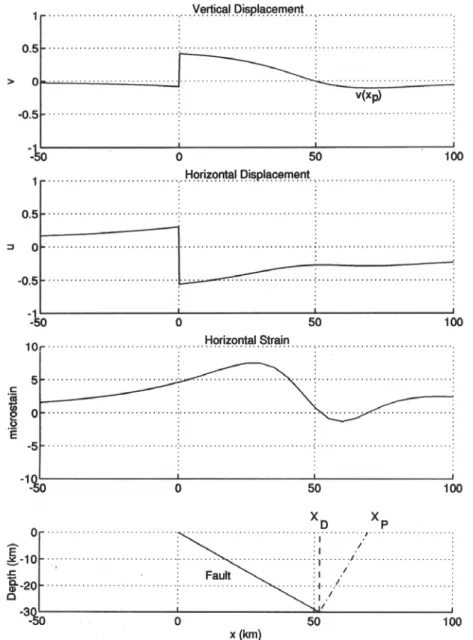
Cohen (1996) provided a 2-D analytical solution for the simplified dislocation model. He derived convenient formulas for determining dip-slip faults parameters that can estimate slip magnitude, fault dip angle, width of the zone of compression by the depth and dip angle of fault information (Fig. 9). Assume v x
( )
and be the (slip-normalized) surface vertical and horizontal displacements, respectively,( )
u x( )
(
)
(
( )
1 2 2 sin tan 1 2 D D D xD v x sign x x x x x D θ π π − ⎡ ⎛ ⎞ ⎤ = ⎢ ⎜ ⎟− − − ⎥ − − + ⎢ ⎝ ⎠ ⎥ ⎣)
⎦ (4)( )
(
)
(
)
( )
1 2 2 cos tan 2 p D D x x D x x u x sign x D x x D θ π π − ⎡ ⎛ − ⎞ − ⎤ = ⎢ ⎜ ⎟− − ⎥ ⎝ ⎠ − + ⎢ ⎥ ⎣ ⎦ (5) where tan D x =D θ (6) cos sin 2 sin 2p
x =D θ θ = D θ (7) are the surface points obtained by projecting the down-dip end of the fault to the
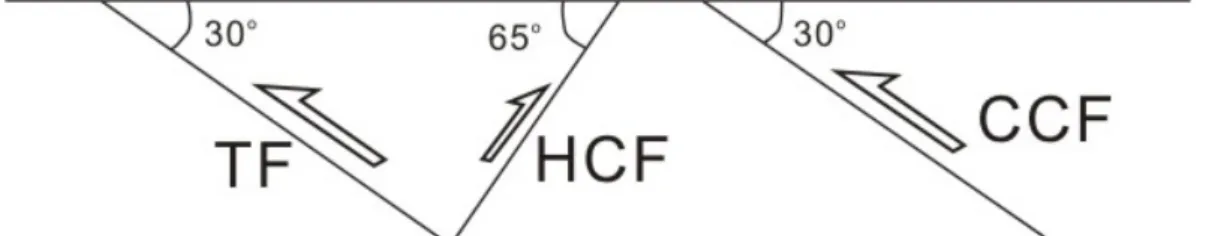
surface of the Earth on vertical and fault-normal paths, respectively (Fig. 9). For the multi-fault system such as Tainan area, one needs to superpose several faults. For this reason, we adopt three faults: the inferred the Tainan fault (TF), the Houchiali fault (HF), and the inferred Chungchou fault (CCF), with the dip angle of 30°E, 65°W, and 30°E, repectively (Fig. 10). The depths of the Tainan fault and the Houchiali faults are 4 km, and the depth of the Chungchou fault is 4.1 km, which can represent the very shallow east dipping décollement (Fig. 10). One of the limits in this model is that the fault would cut through surface, i.e. there model can not simulate the blind fault system. Indeed, the 3 faults in Tainan area (Fig. 10) are all blind faults, for the sake of simplification, we consider them as free-slipping fault system.
Figures 11a and c shows the result for the deformation in Tainan area in vertical and horizontal directions, respectively. The vertical velocity shows the increasing velocity in the Tainan tableland and the Chungchou terrace due to the pop-up structure in the Tainan tableland and the reverse fault in the Chungchou terrace (Fig. 11). However, for the horizontal velocity distribution, it is eastward in the western side of the Tainan tableland, westward in the Tainan tableland, and further westward east from the Tawan lowland. In general, the horizontal velocity distributes a westward to eastward distribution from east to west. For the comparison with the measurements, the leveling data also show the same velocity trend in vertical direction with lower uplift rate in the Tawan lowland. However, for the horizontal velocity, there is no similarity near the Tainan tableland. But only has the same trend of the minus slope (decreasing from west to east). I suppose the major reason is that the fault plane must connect into the surface. Thus no blind faults exist. Therefore, it would make obvious discontinuity near the fault rupture. From the previous studying (Rau et al., 2003), the three faults are all blind faults, it is expectable that one will obtain a continuous velocity distribution (represents a smoother trend).
5. Discussion and Conclusion
We have considered this nonlinear deformation as suggested by Figure 5. We choice three points located on Tainan Tableland to see how the trend of SRD over time is. It is obvious that the pairs D-A (in green) and E-A (in red) deviate the linear trend. In the case E-A, the SRD at point III demonstrates a significant deviation of linear trend which we attribute it to transient deformation due to the Chi-Chi earthquake. Please see our response 3 for this argument. However, the deformation rate increases between scenes C (21 Jan. 1999) and D (6 May 1999). The mechanics of this increasing deformation rate is not clear for instance. One possibility is attributed to the change of friction properties of the fault plane caused by the change of hydrological properties. In Taiwan, an interesting deformation rate that varies over
time is documented at the Chihshang fault, a creeping segment of the Longitudinal Valley fault (Lee et al., 2003). The significant seasonal change (wet and dry season) is observed using extension meter. So the future study will concentrate on the nonlinear behavior of Houchiali and Tainan faults with the constraints of hydrological data.
The assessment of seismic hazards of Tainan tableland is a crucial topic for the dense population in Tainan City. The kinematic of structural evolution and deformation pattern is a fundamental issue to get access to this evaluation. In the past, most studies suggested that the diapirism structures occurring onshore and offshore the southwestern Taiwan (Liu et al., 1997; Chen and Liu, 2000). Thus Chen and Liu (2000) suggested that the Tainan tableland can be interpreted as a mud diapiric dome and the Chungchou terrace as the product of a blind thrust fault. Furthermore, they pointed out that from the analysis of radiocarbon ages, the long-term (Holocene) uplift rates of these two terrains are about 5 and 7 mm/yr, respectively, whereas a subsidence rate of 1 mm/yr in Tawan lowland. Based on the recent geodetic data (Fruneau et al., 2001; Rau et al., 2003), the short-term uplift rate is obviously larger than the long-term uplift rate deduced form radio carbon dating from Holocene (Chen and Liu, 2000). In our study, the average uplift rate on central Tainan tableland is ~13.5 mm/yr related to the westernmost precise leveling benchmark (Figure. 3b). An increasing uplift rate is observed on ~2 km east of the Houchiali fault from both the levelling and D-InSAR observation. It suggested that the branch of the Houchiali fault may develop eastward to Tawan lowland. The proposed new back-thrust fault should have a shallower dipping angle than that of the Houchiali fault (Fig. 12). Except for the pair D-A and E-A, the SRD shows a linearly accumulation trend with time (Fig. 5). In pair E-A the deformation pattern is suddenly increasing on the eastern Tainan tableland, we consider that this is the result of the remote triggering of the 1999 Chi-Chi Earthquake (Another pair across the Chi-Chi earthquake showed similar SRD pattern but not shown here). However after the earthquake, the deformation became to rebound to the original uplift rate so that we can’t find this anomaly in pair F-A.
Our observation of D-InSAR revealed the significant uplift rate of 12~15 mm/yr on the Tainan tableland and the uplift rate of ~2 mm/yr on the Tawan lowland (Fig. 5). Furthermore the gradient of the deformation across the edge of the Tainan tableland increase dramatically (Fig. 2a), thus a décollement-related ramp and a pop-up model is proposed (Fig. 12). This pop-up structure is also suggested by the data of seismic reflections, surface geology and subsurface well (Huang et al., 2004). We conclude that the on-land anticlines and the offshore elongated ridges have an identical tectonic origin with initiation along NE trending folds and thrusts resulted from the movement of the major décollement, which is generated by the collision of two plates.
decollement-and-ramp model is proposed based major on the interpretation of seismic profiles of Chinese Petroleum Company in this area (Huang et al., 2004) and some drilling data. Base on the 2-D analytical solution (Cohen, 1996) and the inferred fault geometry, the slip rate along the inferred Tainan fault is ~16 mm/yr, ~10 mm/yr along Houchiali fault, and ~25 mm/yr along the inferred Chungchou fault (Fig. 12). Thus we propose that growing of the Tainan tableland is mostly resulted from the freely slipping of the Tainan fault and the Houchiali fault. The locking depth should be located on the deeper part of décollement, eastern of the Chungchou fault. In addition, the combination of D-InSAR, GPS data and the precise leveling data reveals that the short-term deformation rate is larger than long-term deformation rate, which implies that a destructive seismic event could occur in the eastern Tainan area. Further work will concentrate on more complete SAR image analysis and the dense GPS survey.
Acknowledgements
We are grateful to Stéphane Dominguez and anonymous reviewer for constructive comments and suggestions. The discussions and suggestions from Jacques Angelier, Chung-Pai Chang, and Chia-Yu Lu are deeply appreciated. This research was supported by grants from the National Science Council of Taiwan (NSC 91-2119-M-002-020) and the Central Geological Survey of the MOEA.
References
Angelier, J., 1986. Preface. Geodynamics of the Eurasia-Philippine Sea plate boundary. Tectonophysics 125, IX-X.
Bürgmann, R., Rosen, P. A., Fielding E. J., 2000. Synthetic aperture radar interferometry to measure Earth’s surface topography and its deformation. Annu. Rev. Earth Planet. Sci. 28, 169-209.
Chang, C.-P., Wang, C.-T., Chang, T.-Y., Chen, K.-S., Liang, L.-S., Pathier, E.,. Angelier, J. 2004. Application of SAR interferometry to a large thrust deformation: the 1999 Mw = 7.6 Chichi earthquake in central Taiwan. Geophys. J. Int. 159, 9-16.
Chen, C.-W., Zebker, H.A., 2002. Phase unwrapping for large SAR interferograms: Statistical segmentation and generalized network models. IEEE Tran. Geosci. Rem. Sens. 40, 1709-1719.
Chen, Y.-G., Liu, T.-K., 2000. Holocene uplift and subsidence along an active tectonic margin southwestern Taiwan. Quat. Sci. Rev. 19, 923-930.
Cohen, S.C., 1996. Convenient formulas for determining dip-slip fault parameters form geophysical observables. Bull. Seism. Soc. Am. 86, 1642-1644.
Deffontaines, B., Lacombe, O., Angelier, J., Chu, H.-T., Mouthereau, F., Lee, C.-T., Deramond, J., Lee, J.-F., Yu, M.-S., Liew, P.-M., 1997. Quaternary transfer faulting in the Taiwan Foothills: evidence from a multisource approach. Tectonophysics, 274, 61-82.
Fruneau, B., Pathier, E., Raymond, D., Deffontaines, B., Lee, C.-T., Wang, H.-T., Angelier, J., Rudant, J.-P., Chang, C.-P., 2001. Uplift of Tainan Tableland (SW Taiwan) revealed by SAR interferometry. Geophys. Res. Lett., 28, 3071-3076. Ho, C.-S., 1986. A synthesis of the geological evolution of Taiwan. Tectonophysics
125, 1-16.
Hanssen, R.F., 2001 Radar interferometry: Data interpretation and error analysis, Kluwer Academic, Dordrecht, 308 pp.
Huang, M.-H., Hu, J.-C., Hsieh, C.-S., Ching, K.-E., Rau, R.-J., Pathier, E., Fruneau, B., Deffontaines, B., 2006. A growing structure near the deformation front in SW Taiwan as deduced from SAR interferometry and geodetic observation. Geophys. Res. Lett. 33, L12305, doi:10.1029/2005GL025613.
Huang, S.-T., Yang, K.-M., Hung, J.-H., Wu, J.-C., Ting, H.-H., Mei, W.-W., Hsu, S.-H., Lee, M., 2004. Deformation front development at the northeast margin of the Tainan basin, Tainan-Kaohsiung area. Taiwan, Mar. Geophys. Res. 25, 139-156, DOI 10.1007/s11001-005-0739-z.
Lacombe, O., Mouthereau, F., Deffontaines, B., Angelier, J., Chu, H.-T., Lee, C.-T., 1999. Geometry and Quaternary kinematics of fold-and-thrust units of southwestern Taiwan. Tectonics 18, 1198-1223.
Lee, J.-C., Angelier, J., Chu, H.-T., Hu, J.-C., Jeng, F.-S., and Rau, R.-J., 2003. Active fault creep variations at Chihshang, Taiwan, revealed by creepmeter monitoring, 1998-2001, J. Geophys. Res. 108(B11), 2528, doi:10. 1029/2003JB002394.
Lin, C.-W., Chang, H.-C., Lu, S.-T., Shih, T.-S., Huang, W.-J., 2000. An introduction of the active faults of Taiwan. Spec. Publ. Cent. Geol. Surv. 13, 122 pp.
Lin, A.T., Watts, A.B., 2002. Origin of the west Taiwan basin by orogenic loading and flexure of a rifted continental margin. J. Geophys. Res. 107, 2185-2203.
Liu, C.-S., Huang, I.-L., Teng, L.S., 1997. Structureal features off southwestern Taiwan. Mar. Geol. 137, 305-309, 1997.
Liu C.-S., Deffontaines, B., Lu, C.-Y., Lallemand, S., 2004. Deformation patterns of an accretionary wedge in the transition zone from subduction to collision offshore southwestern Taiwan. Mar. Geophys. Res. 25, 139-156, DOI 10.1007/s11001-005-0738-0.
Massonnet, D., Feigl, K., 1998. Radar Interferometry and its application to changes in the earth’s surface, Rev. Geophys. 36, 4, 441-500.
1999. Quaternary transfer faulting and belt front deformation at Pakuashan (western Taiwan), Tectonics 18, 215-230.
Pathier, E., Fruneau, B., Deffontaines, B., Angelier, J., Chang, C.-P., Yu, S.-B., Lee, C.-T., 2003. Coseismic displacements of the footwall of the Chelungpu fault caused by the 1999, Taiwan, Chi-Chi earthquake from InSAR and GPS data. Earth Planet Sci. Lett. 212, 73-88.
Rau R.-J., Ching, K.-E., Hsieh, T.-J., Yu, C.-I., Hou, C.-S., Lee, Y.-H., Hu, J.-C., Chan, J.-C., Lee, J.-C., Hung, J.-H., Lin, C.-W., 2003. Surface Deformation and Earthquake Potential of Tainan Tableland, Southwestern Taiwan. Spec. Publ. Cent. Geol. Surv. 14, 147-156.
Suppe, J., 1984. Kinematics of arc-continent collision, flipping of subduction and back-arc spreading near Taiwan. Memor. Geol. Soc. China 6, 21-33.
Sun, R., Sung, Q.-C., Liu, T.-K., 1998. Near-surface evidence of recent Taiwan Orogeny detected by a shallow seismic method. Earth Planet. Sci. Lett. 163, 291-300.
Seno, T., Stein, S., Gripp, A.E., 1993. A model for the motion of the Philippine Sea plate consistent with NUVEL-1 and geological data. J. Geophys. Res. 98, 17941-17948.
Teng, L.S., 1990. Geotectonic evolution of late Cenozoic arc-continent collision in Taiwan. Tectonophysics 183, 57-76.
Teng, L.S., 1996. Extensional collapse of the northern Taiwan mountain belt. Geology, 10, 949-952.
Yu, S.-B., Kuo, L.-C., Punongbayan, R.S., Ramos, E.G., 1999. GPS observation of crustal deformation in the Taiwan-Luzon region, Geophys. Res. Lett. 26, 923-926. Zang, S.-X., Chen, Q.-Y., Ning, J.-Y., Shen, Z.-K., Liu, Y.-G., 2002. Motion of the
Philippine Sea plate consistent with the NUVEL-1A model. Geophys. J. Int. 150, 809-819.
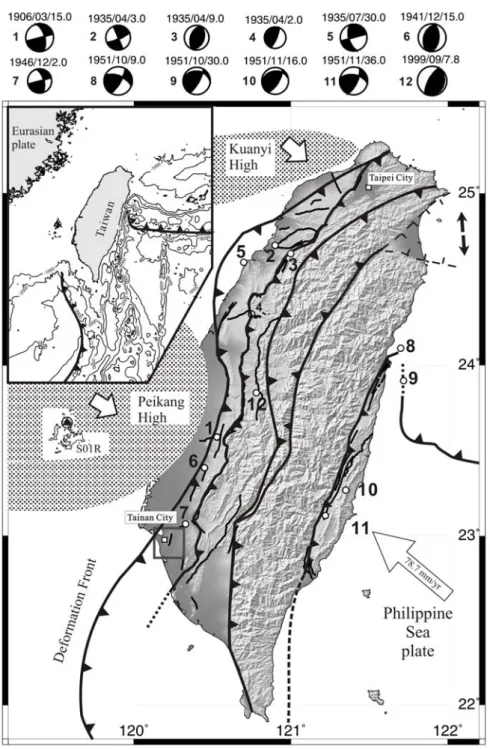
Fig. 1. Geodynamic framework and structural map of Taiwan. Rectangle indicates the study area. Open circles star coded with number indicate the destructive historical earthquakes since 1906. The date (yy/mm) and the focal depth are shown in the upper part of beach ball. Open arrow indicates the rate of the Philippine Sea Plate (PSP) with respect to the Paisha Station (S01R) of Penghu Island of the Eurasia Plate (EU).
Fig. 2. (a) Topographic map and structural units around Tainan area. The yellow triangles represent GPS stations, the black dots represent the leveling benchmarks co-sited with GPS stations. 1: inferred Tainan fault; 2, Houchali fault; 3, Chungchou fault. I: Tainan tableland, II: Tawan lowland, and III: Chungchou terrace. Topogrpahic profile showed across the central part of Tainan tableland. The yellow triangles represent GPS stations, the black dots represent the leveling benchmarks co-sited with GPS stations. (b) The leveling data surveyed during 2001 to 2003 (2 years) indicates similar deformation pattern to the topography of the same profile (Rau et al., 2003).
Fig. 3. Schematic configuration of the geometric relationship among real deformation, GPS measurements and SRD. The real vertical displacement inferred from D-InSAR can be obtained using Equation 3.
Fig. 4. (a) The SAR intensity image in Tainan area. (b) Interferogram B-A (910 days, ha = 80.1 m). (c) Interferogram C-A (980 days, ha = 103.7 m). (d) Interferogram D-A (1085 days, ha = 42.2 m). (e) Interferogram E-A (1260 days, ha = 43.2 m). (f) Interferogram F-A (1610 days, ha = 103.6 m). Detail information, see Table 1.
Fig. 5. (a) Profile of 5 interferograms after phase unwrapping along AA’ from Fig. 2a. (b) Comparison of uplift rate along AA’ profile with the results of precise leveling and the vertical displacement induced from D-InSAR and GPS data. The green belt represents the standard deviation of D-InSAR. Trend of uplift rate for three selected 3 points at a distance of 6 km (I), 7 km (II) and 9 km (III) from the westernmost benchmark along profile AA’.
Fig. 6. The GPS horizontal velocity relative to CK01 continuous station in central Tainan tableland. The yellow triangles represent the campaign GPS stations. The 95% confidence ellipse is shown at the tip of each velocity vector.
Fig. 7. The strain rates distribution. The colorbar indicates the deformation rate in study area. The red color represents compressional; the blue color represents extensional region. And the white bars represent extensional and the black bars represent compressional strain rate axes.
45°/106yr
Fig. 8. The rotation rates distributions in Tainan area. The cool color represents clockwise rotation, and the warm color represents counterclockwise (unit: radiant per million year). The scale fan-shape represents 45°/myr.
Fig. 9. Deofrmation due to thrust faulting (Cohen, 1996). Slip = 1 m, dip = θ = 30°, depth of faulting = 0-30 km (D = 30 km).
Fig. 10. The illustration of the fault system in Tainan area used in 2-D dislocation model. This profile is the same as profile AA’ in Fig. 2. The depth of TF and HCF are 4 km and 4.1 km for CCF.
A B
C
D
Fig. 11. (a) The simulated vertical velocity distribution in Tainan area. (b) The observed velocity in the same profile as (a). (c) The simulated horizontal velocity distribution in Tainan area. (d) The observed velocity in the same profile as (c).
Fig. 12. (a) SRD of interferogram after phase unwrapping on shaded topography, which can indicate the deformation pattern of a pup-up structure. (b) Inferred structural model as a décollement-related pop-up structure.
Table 1. The interferograms list and their basic information
ID Master Slave B_|_ (m) Ha (m) Delta days B-A 16 May 1996 12 Nov 1998 62 80.1 910
C-A 16 May 1996 21 Jan 1999 50 103.7 980 D-A 16 May 1996 6 May 1999 143 42.2 1085 E-A 16 May 1996 28 Oct 1999 138 43.2 1260 F-A 16 May 1996 12 Oct 2000 50 103.6 1610
出席國際學術會議心得報告
計畫編號 95-2745-M-002-003- 計畫名稱 臺灣地震地質研究-臺灣西南部活斷層研究-臺灣西南部活動斷層活動性近 斷層監測之研究(IV) 出國人員姓名 服務機關及職稱 國立臺灣大學地質科學系 胡植慶副教授 會議時間地點 95 年 12 月 11 日至 95 年 12 月 15 日於美國舊金山(San Francisco) 會議名稱 2002 年美國地球物理聯合會(AGU 2006 Fall Meeting|發表論文題目 Neotectonic Deformation in SW Taiwan as Deduced from Persistent Scatterers SAR
Interferometry and Geodetic Observation
一、參加會議經過
本次會議共有六位研究生參與報告,兩位口頭報告,四位海報展示。
邱詠恬: Crustal Deformation in Taiwan as Deduced from Continuous GPS Measurements
童忻: Crustal Deformation Revealed from Persistent Scatterer Inteferometry in SW Taiwan
楊宜蓉: Influence of Growth Strata on the Evolution of Faulted-related Folds by 2-D Distinct-element Models: Case Studies for Coseismic Deformation of the Chi-Chi Earthquake
唐昭榮: Using Distinct-Element Method (DEM) to Investigate Tsaoling Landslide Induced by Chi-Chi Earthquake, Taiwan.
黃鐘:
Construction of high-resolution earthquake fault plane geometry at shallow
depth: a detailed analysis from city planning benchmarks measurements.
黄筱婷:Active uplift at the Taiwan belt front revealed by morphotectonic features: The Chiayi area, southwestern Taiwan
二、與會心得
今年 AGU 在構造地球物理有一臺灣主題:地震地質、自然災害與東南亞活動構造 (Earthquake Geology, Natural Hazards, and Active Tectonics in South and East Asia),由臺灣 大學陳于高教授、美國華盛頓大學 Rubin 教授與中研院地球所詹瑜璋主持,有不少臺灣 學者與會,共有 40 篇文章發表,成果相當豐碩。
攜回資料名稱及內容 會議議程及摘要之光碟片