Power-oriented partial-scan design approach
J.-Y. JOU M.-C.Nien
Indexing terms: Design, VLSL Algorithms, Partial scan approach, Automatic test pattern genevation
Abstract: Power consumption and testability are two of major corisiderations in modern VLSI design. A full-scan method had been used widely in the past, to improve the testability of sequential circuits. Owing to the lower overheads incurred, the partial-scan design has gradually become popular. The authors propose a partial- scan selection strategy which is based on the structural analysis approach and considers the area and power overheads simultaneously. A powerful sample-and-search algorithm is used to find the solution that minimises the user-specified cost function in terms of power and area overheads. The experimental results show that the sample-and-search algorithm derived by the authors can effect~vely find the best solution of the specified cost function, for almost all circuits, and, on average, the saving of overheads for each specific cost function is significant.
1 Introduction
Testability is one of the major concerns in VLSI design. However, automatic test pattern generation (ATPG) of sequential circuits is still considered a diffi- cult problem to be solved, because of the lack of direct controllability and dilrect observability of the flip-flops.
To enhance the testability of sequential circuits, the full-scan method has been popular. In full scan, all the flip-flops are chained together into a shift register dur- ing the test mode. As the value of flip-flops can be assigned and observed directly in test mode, only a combinational test generator is required to generate test vectors, and the ATPG becomes much simpler. However, the area and delay overheads imposed by the full-scan approach can be significant due to the extra multiplexers in the scan flip-flops and the extra routing area for the scan chains. To reduce the overheads, the partial-scan approach, has been proposed as an alterna- tive method. In partial-scan design, only a subset of flip-flops are selected1 to be replaced by the scan flip- flops.
Many approaches have been proposed to select the right set of scan flip-flops [I-121. All the approaches mentioned aim at the low area overhead without con- @ IEE, 1998
IEE Proceedings online no. 19981920
Paper first received 19th May 1997 and in revised form 8th January 1998 The authors are with the National Chiao Tung University, Department of Electronics Engineering, 1001 Ta Hsueh Road, Hsinchu 300, Taiwan
IEE Proc-Circuits Devices Syxt., Vol. 145, No. 4, August 1998
sidering the timing or power overheads. Only the approach proposed in [ 131 considers performance deg- radation. The authors of [13] proposed a method that is based on the structural analysis of sequential circuits. In this method, heuristics were used to select a minimal set of flip-flops to eliminate cycles in a condensed ver- sion of the circuit graph, where vertices represent flip- flops and arcs represent combinational paths, such that the least performance impact after the scan logic is added.
Power consumption has become one of the major concerns in modern VLSI design. In a CMOS circuit, power dissipation is directly related to the extent of switching activity of the nodes and the capacitance of the nodes in the circuit. The equation for dynamic power consumption is typically defined as
Power = 0.5V2d C f D ( f )
where f is a node in the circuit N , Cf,is the capacitance of the nodefand Dcf> is the switching activity of the node
S.
The power consumption of flip-flops incurred in the normal operation is also directly related to the switching activity and total capacitance of the flip- flops. The scan flip-flops have higher power consump- tion than nonscan flip-flops due to the addition of an extra multiplexer which incurs extra capacitance. In the partial-scan flip-flop selection, if we select the flip-flops that have lower switching activities, the circuit will con- sume less extra power in the functional mode, because the power consumption is in proportion to the switch- ing activity of flip-flops. Furthermore, when a flip-flop has lower activity, the controllability of the flip-flop is, thus, not good. So we can use the switching activity of flip-flops as a heuristic measurement to achieve both better testability and lower power consumption. Please note that our objective is to minimise the overhead of the power consumption incurred by the added test logic in the functional mode instead of in the test mode.As discussed so far, we can use the switching activity of flip-flops as a new measurement for the selection of scan flip-flops in partial-scan design. In addition, the structural-analysis-based method has shown its effec- tiveness on scan flip-flop selection to have both high fault coverage and low area overhead. Our new method is thus based on the structural-analysis method by incorporating the switching activities of flip-flops into the heuristic algorithm. A sample-and-search algorithm is also added to find the best solution for a specified cost function which can be expressed in terms of area
and power overheads for each circuit.
Testability, area, delay and power consumption are the four major concerns in VLSI designs. However, it is impossible to get an optimal design which is optimal in
f E N
terms of all four aspects. It is because those four fac- tors are usually in the trade-off situation. The more realistic situation is to minimise some factors while sat- isfying another constraints in terms of other aspects. In this paper, we try to minimise the users’ specified cost function which is expressed as the weighted costs of both area and power consumption while satisfying the requirement of high testability. Performance is another very important factor for VLSI designs and deserves more attention. However, as discussed in [13], the per- formance degradation caused by the test logic cannot be analysed easily and can vary significantly when dif- ferent time-driven logic synthesis tools are used in the experiments. Therefore, we limit the scope of this paper by not discussing the issue on the performance factor. Certainly, our formulation of the problem and the pro- posed algorithm could be extended to cover the factor as well.
2 Calculating activity of flip-flops
Let us define signal probability and transition probabil- ity [14] first.
2.
I
Signal probabilityThe signal probability P,(x) at a node x is defined as the average fraction of clock cycles in which the steady state value of x is a logic high.
2.2 Transition probability
The transition probability P,(x) at a node x is defined as the average fraction of clock cycles in which the value of x at the end of the cycle is different from its initial value.
In the following discussion, we will use switching activity, activity or transition probability, interchangea- bly.
A synchronous sequential circuit or a finite-state machine (FSM) can be seen as some flip-flops acting together with a combinational circuit. Many approaches were proposed to calculate the transition probabilities of flip-flops [15-221. The approach pro- posed in [21] is a statistical method in which the circuit is simulated repeatedly under randomly generated input vectors while monitoring the outputs of flip-flops. This is, essentially, a Monte-Carlo simulation approach. In this paper, we use this approach to obtain the signal probabilities and transition probabilities of flip-flops because the method can handle large circuits with rea- sonable fast turn around time.
3 Our n e w approach
The activity of flip-flops, which is a kind of controlla- bility measurement, cannot be the only criterion in choosing scan flip-flops to achieve high testability. In addition, a structural-analysis based method has shown its effectiveness with high fault coverage and low area overhead. Our new method is thus based on a struc- tural-analysis method in which the switching activities of flip-flops are incorporated into a heuristic algorithm. A sample-and-search algorithm is also added to find the best solution for a cost function in terms of area and power overheads for each circuit.
3.1 Cycle breaking algorithm
The typical partial-scan selection algorithm based on the structural analysis is to select thenminimum 230
number of vertices to break all cycles and all paths of length more than d,,, in the graph [4, 81. The algo- rithm proposed by Lee and Reddy [8] is shown to be very efficient in solving this problem. The algorithm is divided into two parts; one to break the cycles and the other to break the paths. The cycle-breaking problem is reduced to a minimal feedback vertex set problem, which is NP-hard. A contraction-based algorithm developed in [23] was adopted to solve this problem. In the algorithm of the feedback vertex set, five graph reduction operations are used to reduce the graph. if the process of reduction cannot be completed, a heuris- tic is then used to select additional vertices from the reduced graph to break the cycles. Thus, we repeat the process of reduction and heuristic selection until the graph is empty. The five reduction operations are as follows:
1. INO(v) ~ If vertex-indegree(v) = 0 then contract G
by removing v and all the edges leaving v.
2. OUTO(v) - The symmetric operation to INO(v).
3. IN1(v) - If vertex-indegree(v) = 1 and U (U f v) is the predecessor of v, then contract G by collapsing v
into U as follows: For every edge v
1
v’, remove e and add an edge U 3 v’. Remove v and the edge. U+
v. Remove all parallel edges created by this transforma- tion.4. OUTl(v) - The symmetric operation to INl(v). 5. LOOP(v) - If v
+
U is a self-loop edge in G, then contract G by removing v and all the edges incident to v.Notice that the self-loop of the operation 5 is not the
self-loop of the initial graph. It is the self-loop created by the reduction process. The overall algorithm of the feedback vertex set is as follow:
(1) If G is the empty graph, stop.
(2) Repeatedly apply the basic contraction operations to G until no longer possible. Collect the vertices removed by the LOOP operation in S1.
(3) If the graph is empty, stop. Else, heuristically select a vertex v, contract the graph by removing the selected vertex, add v to S2 and go to step (1).
The outputs of the algorithm are sets S I and S2. The union of S1 and S2 is the minimal vertex set to break all cycles in a directed graph.
Modifying the acyclic graph G, the algorithm men- tioned here can be used to break all paths whose lengths are longer than d,,, [8].
3.2 Cost function
In this Section, we first define a flexible cost function which can account for both area and power overhead of the partial-scan selection. We then propose a struc- tural-analysis-based method to minimise the cost func- tion in the partial-scan selection. The general form of the cost function is defined as follows.
cost = W,
*
N s / N t+
wP
*
EP,/P,where N, and Nt are the number of selected scan flip- flops and the number of total flip-flops in the circuit,
EP, is the extra power incurred by the scan flip-flops
and P, is the total power consumption of all original flip-flops. Assuming the capacitance of each original flip-flop is normalised to 1, the total capacitance of the scan flip-flop is (1 + a) which can be derived directly from the standard cell library. In the following experi-
ments, we assume a is equal to 0.2. We can thus calcu- late the EP, by summing up the products of scan flip- flops' activities and the factor a in our experiments. The
P,
can be calculated, correspondingly, by summing up the activities of all flip-flops. The parameters ofw,
and wp can be specified by users,
w,
and w p are the area weight and power weight of the cost function. Based on different situations, users can specify different w, and w p for the cost function, so that our algorithm can find the partial-scan set to minimise such cost functions. For example, if w p is set to 0, the algorithm will aim at selecting the minimum number of flip-flops for the scan. This corresponds to the solution with minimum area overhead. Ifw,
is set to 0, the algorithm will aim at selecting scan flip-flops to minimise the power over- head. In other situations, the algorithm can be used to trade-off between area and power.We have modified the Lee-Reddy algorithm and introduced a sample-and-search algorithm to find the optimal solution for each specific cost function.
3.3 Modifications of Lee-Reddy algorithm
The Lee-Reddy algorithm can be divided into two parts, one is to break cycles and the other is to break paths. The same algorithm can be used in both parts as shown in Section 3.1.
The algorithm of break cycles consists of two major steps: graph reduction and heuristic selection. In the graph reduction step, we modify the two operations of IN1 and OUT1, and keep the other three, INO, OUTO, LOOP, intact. The modifications are shown as follows: 1. IN1(v) - If vertex-indegree(v) = 1 and U (U # v) is the predecessor of v, and if the activity of flip-flop U 5 activity of flip-flop v. then contract G by collapsing v
into U as follows: For every edge v 4 v', remove e and add an edge U 3 v' if edge U 3 v' does not exist. Remove v and the edl, ye U
-+
v .2. OUTl(v) ~ The symmetric operation to INl(v).
The purpose of these modifications is to select the flip- flops that have lower activities so that the extra power incurred by the scan flip-flops will be lower.
We also modify the heuristic selection part. The orig- inal Lee-Reddy algorithm uses the sum (or product) of in-degree and out-degree of each node as the heuristic measurement to minimise the number of selected flip- flops. The larger the heuristic number, the higher the priority to select the corresponding flip-flop for scan. However, the new cost function is a weighted combina- tion of the number of selected flip-flops and the extra power consumed by the scan flip-flops. A new heuristic of selection that is similar to the heuristic used in [13] is thus proposed. The heuristic is as follows:
(in-degree)
*
(out-degree)+
w*
threshold/acttvetyThe threshold is assigned as 0.01 in our experiment. The activity is the transition probability of flip-flop, and if activity is smaller than threshold, it is adjusted to threshold. When w is :;et to 0, the heuristic is reduced to the original heuristic aiming at minimising the area overhead. If w is set to a relatively large number, then the heuristic is aiming at selecting flip-flops with lower activities.
Given a dependency graph G and a parameter w, the overall algorithm that breaks cycles, breaks paths and calculates the cost is its follows:
cost(G, w )
c
while (G is not empty) { /* break cycle */ graph-reduction( G);
heuristic-selection(G, w); }
G' = modify-graph(G); while (G' is not empty) { I*
graph-reduction(G'); heuristic-selection(G', w);
1
calculate cost; return cost;1
break path "1As the cost function specified by the users can be any weighted combinations of the power overhead and the area overhead, and every circuit can have dramatically different structures, the parameter w must be adjusted to find the scan flip-flop set that has the optimal cost function for every different circuit. Therefore, a search algorithm to find the best w to minimise the cost func- tion for a different circuit is needed.
3.4 Sample-and-search algorithm
The search algorithm is used to find the best parameter w that can bias the heuristic selection part of the cycle breaking algorithm in order to find the set of scan flip- flops with minimum cost. Typically, the number of scan flip-flops selected is directly proportional to the magnitude of the parameter w , and the power overhead incurred is inversely proportional to the magnitude of
w. Given a cost function with specific weights w, and
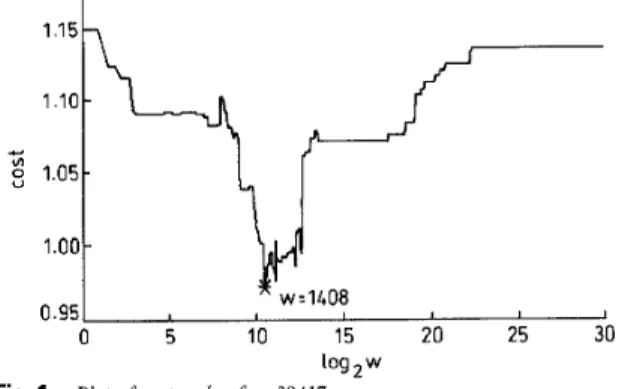
wp, the cost against w plot can be drawn as shown in Fig. 1. The plot is obtained as follows. Use different values of w in the heuristic selection, apply the cycle breaking algorithm to find the scan flip-flop set and calculate the associated cost. From Fig. 1, we can see that the cost reduction can be as high as 20%, if we choose the right value of w for the circuit with the specified cost function. However, the plot can be very irregular and the best w can only be found by trying out different ws exhaustively. However, this process can be too time consuming. To find the best parameter
w without going through an exhaustive search, we use a sample-and-search approach. 1 .IO - c
$
1.05- 1.00 - * - w =1L08 I I I 0 5 10 15 20 25 30 log 2wFig. 1 Plot of cost and w for ~38417
Circuit 938417, cost z lTNJN,+lOTdYJY,, lhreshold z 0 01
In the first step of the search algorithm, we sample many points that have exponential intervals in the cost 23 1 IEE Proc.-Circuits Devices Syst., Vol. 145, No. 4, August 1998
curve, i.e. w = 0, 2O, 2', . . ., 2n, perform the partial- scan selection algorithm using these ws in the heuristic selection parts, and then calculate the costs of the results for every sample point. The three ws that have minimal costs were picked out as the start points of the second step of detail search. The reason for choosing
ws in this manner is that, when
w
is large, w' = (wsmall number) will not make visible difference in terms of flip-flop selections. Therefore, in order not to waste too much effort, we sample w using this strategy in the first step of search. The second step will then perform a more detailed search from the three start points wsi and get the result wri, respectively. Then compare the costs of the three results and select the wri that has the lowest cost as the final result. As can be seen in our experi- mental results, three ws selected in the first step are always enough for our algorithm to find the best
w.
We realise that the cost curve nearby the wsi is in much smoother shape. We can thus apply a binary search to locate the best solution around wsi. Hope- fully, this two-step search can quickly identify the best results by sampling at the first step but doing more detail search at the second step. Given a wsi, this algo- rithm calculates the cost of 312ws, first. If the cost of 3/2w,, is smaller than the cost of 312wsi then the search space is set to the interval of (wsi, 2 w J , else the space is set as (1/2w,, 3/2wsi). We define the left value of the search interval as wL, the right value as
wR,
and middle value as wM. The recursive algorithm of detailed search is as follows:bestcost(G, wL, w M , wR ) t
W L M = ( W L
+
wM)/2, W M R = (w&f+
wR)/2; if (wR- w L is equal to 2);f (cost(G, w L M ) 2 cost(G, wM) and cost(G, wMR) 2
return best-cost(G, wLM, wM, wMR); I" Fig. 2a */
else if (cost(G, wLM) 2 cost(G,
wM)
and cost(G, wMR)return best-cost(G, wM, wMR, wR); I* Fig. 2b "I else if (cost(G, wLM) < cost(G, wM) and cost(G, wMR) 2 cost(G, wM))
return best-cost(G, wL, wLM, wM); I* Fig. 2c */ else {
costL = best-cost(G, wL, wLM, wM);
return the result that has lower cost; I" Fig. 2d */
return wM; cost(G, W M ) ) < cost(C, W M ) ) CoStR E best-cost(G, W M , W M R , W R ) ;
1
} 1 I I I a b I I C d Fig. 2 a Case I b Case I1 c Case 111 d Case IVDifferent situations of binary search
3.5
Overall algorithmCombining the modified Lee-Reddy algorithm and the sample-and-search algorithm, the overall algorithm of our partial scan selection can be presented as follows: (1) Use the statistical technique that was proposed in [21] to compute the activities of every flip-flop in the circuit.
(2) Construct the dependency graph from the circuit structure.
(3) Apply the search algorithm and the modified Lee- Reddy algorithm to find the best parameter w which is used in the heuristic selection part of the cycle breaking algorithm with minimum cost and report the corre- sponding scan flip-flops selected.
4 Experimental results
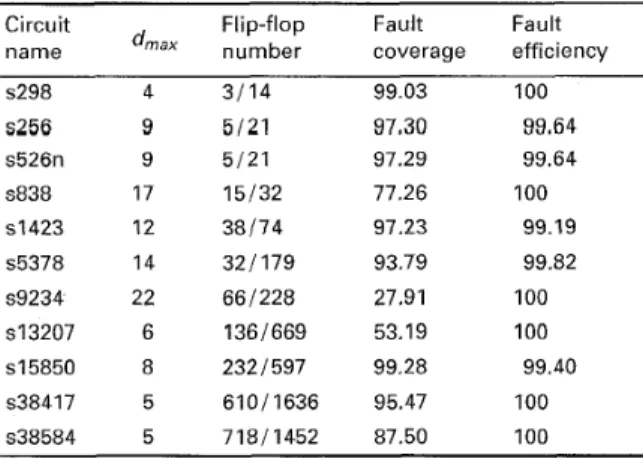
With regard to the approach that breaks all cycles and all paths with lengths longer than a d,,,, to decide the d,,, for different circuits is a critical and difficult prob- lem. A practical method is to use ATPG in the partial- scan selection process to determine a d,,, that causes reasonably high fault coverage. In our experiments, several possible values of d,, were tried in the Lee- Reddy algorithm for every ISCAS89 benchmark cir- cuit, and a value of maximal length d,,, that results in fault efficiency higher than 99% is selected. Fault effi- ciency is defined as the ratio of the number of detected faults over the number of the irredundant faults in the circuit. Fault coverage is defined as the ratio of the number of detected faults over the number of total faults (including the redundant faults). We use a sequential ATPG to generate the test patterns and cal- culate the fault efficiency for the benchmark circuits. Table 1 shows the results we obtained in this experi- ment. The column of flip-flop number shows the number of scan flip-flops over the number of total flip- flops. All other ISCAS89 benchmark circuits which are not listed in Table 1 have high fault efficiency, even when only cycle breaking is applied. As the Lee-Reddy algorithm can obtain results with high fault efficiency when it breaks paths with lengths longer than d,,, listed in Table 1 for all ISCAS89 benchmark circuits, we assume that the fault efficiency will also be high in our modified algorithm when we use the same lengths d,,, to break long paths. We do evaluate the results of many benchmark circuits, and the fault efficiency of them is almost 100%.
Table 1: Maximal path length of benchmark circuits
Circuit Flip-flop Fault Fault name number coverage efficiency s298 4 3 / 1 4 99.03 100 s256 9 5 / 2 1 97,30 99.64 s526n 9 5 / 2 1 97.29 99.64 s838 17 15/32 77.26 100 s1423 12 38174 97.23 99.19 s5378 14 321179 93.79 99.82 s9234 22 661228 27.91 100 ~ 1 3 2 0 7 6 1361669 53.19 100 ~ 1 5 8 5 0 8 2321597 99.28 99.40 s38417 5 61011636 95.47 100 s38584 5 71811452 87.50 100
IEE Pvoc -Circuits Devices Syst , Vol 145, No 4, August 1998
Table: 2: Overhead comparisons of ISCAS'89 circuits
Lee-Reddy algorithm Our algorithm Circuit name s298 s344 s349 s382 s400 s420 s444 s510 s526 S52611 s641 s713 s820 s832 s838 s953 SI 19tj SI 238 ~ 1 4 2 3 s 1 488 s1494 s53713 s9234 SI 3027 ~ 1 5 8 5 0 ~35932 ~384'17 ~385134 ~- - avereae Flip-flop number 3/14 5/15 5/12 9/21 9/21 0116 9/21 516 5/21 5/21 7/19 7/19 415 415 15/32 5/29 0116 0116 38/74 516 516 321179 661228 1361669 2321597 30611 728 61 O/ 1636 71811636 Total cost 1.23 1.01 1.01 1.23 1.23 0 1.61 2.46 1.29 1.29 1.09 1.08 2.69 2.70 2.07 0.46 0 0 1.52 2.28 2.28 0.47 0.88 0.79 1.34 0.59 1.16 1.16 ~ W 32 0 0 0 0 0 1 0 4 4 0 0 1 1 16 1 0 0 49152 1 1 0 256 24 1024 0
Flip-flop Total Cost reduction CPU number cost ratio,% time, s
3/14 0.74 39.84 0.8 5/15 5/12 9/21 9/21 0116 9/21 516 5/21 5/21 7/19 7/19 415 415 12/32 5/29 0116 0116 38/74 516 516 321179 681228 1371669 2321597 30611728 704(3)* 63211636 0 7 1811 452 0.76 0.76 0.83 0.82 0 0.82 2.15 0.31 0.31 1.08 1.07 1.58 1.57 0.38 0.38 0 0 0.98 2.25 2.23 0.44 0.59 0.58 1.21 0.40 1
.oo
1.40 24.75 0.4 24.75 0.3 32.52 0.6 33.33 0.5 0 0.5 49.07 0.5 12.60 0.2 75.97 1.2 75.97 1.2 0.92 0.5 0.93 0.6 41.26 0.1 41.85 0.1 81.64 17.7 17.39 0.7 0 0.2 0 0.2 35.53 23.8 1.32 0.4 2.19 0.3 6.38 15.0 32.95 176.6 26.58 177.2 9.70 1173.0 32.20 1003.4 13.79 2424.7 2.78 2169.9 25.58 256.8 .,-
w,= 1, w P = IO,cost= I*N.JNt+ lO*EPJPf Table 3: Area overhead comparisons
Lee-Reddy algorithm Our algorithm Circuit
name Flip-flop Total number cost
Flip-flop Total Cost reduction CPU
W
-
s298 3/14 0.21 0
. .
number cost ratio,% time, s
3/14 0.21 0 0.5 s344 s349 s382 s400 s420 s444 s510 s526 s526n s641 s713 s820 s832 s838 s953 ~11986 s1233 s1423 s148B s1494 s5378 s9234 s13027 ~ 1 5 8 5 0 s35932 s38584 avemae 538417 5/15 5/12 9/21 9/21 0116 9/21 516 5/21 5/21 7/19 7/19 415 415 15/32 5/29 0116 0116 38/74 516 516 321179 661228 1361669 2321597 30611728 61 0 f 1636 71811636 0.33 0.33 0.43 0.43 0 0.43 0.83 0.24 0.24 0.37 0.37 0.80 0.80 0.47 0.17 0 0 0.51 0.83 0.83 0.18 0.29 0.20 0.39 0.18 0.37 0.49 0 0 0 0 0 0 0 4 4 0 0 0 0 16 0 0 0 0 0 0 0 0 1 8 0 0 4 5/15 5/12 9/21 9/21 0116 9/21 516 5/21 5/21 7/19 7/19 415 415 12/32 5/29 0116 0116 38/74 516 516 321179 681228 1371669 2321597 30611728 71811452 632/1636 0.33 0.33 0.43 0.43 0 0.43 0.83 0.24 0.24 0.37 0.37 0.80 0.80 0.38 0.17 0 0 0.51 0.83 0.83 0.18 0.30 0.20 0.39 0.18 0.39 0.49 0 0.3 0 0.3 0 0.5 0 0.5 0 0.5 0 0.5 0 0.2 0 1.4 0 1.4 0 0.5 0 0.5 0 0.2 0 0.2 20 11.2 0 0.7 0 0.3 0 0.3 0 10.8 0 0.3 0 0.4 0 15.5 -3.03 69.1 -0.74 92.1 0 591.0 0 866.5 -3.61 1246,8 0 1494.4 1.05 157.4 .,
-
W , = 1, wP = 0, cost = 1"NJNtWe conduct our experiments on the SPARC-20 workstation. Table 2 lists the comparisons of overheads between the Lee-Reddy algorithm and our algorithm. The user-specified parameters w, and wp are set to 1 and 10 in these experiments, and the activities threshold is set to 0.01. The fourth column in Table 2 shows ws
that our search algorithm found for the heuristic selec- tion step of our break-cycle algorithm. In Table 2, our search algorithm found the best w for every circuit except s38417 which is marked by a
*
sign. Even though it is not the global minimum, it is still a local minimum. Compared to the Lee-Reddy algorithm, our algorithm incurs less extra cost for all cases. On aver- age, our algorithm has 25.58% cost reduction compared to the original Lee-Reddy algorithm. For s838, the cost reduction is as high as 81.64 Table 3 shows the case where we set w, = 1 and wp = 0 in the cost function. This set up is totally aimied at area overhead reduc- tion. We can find that the results are comparable to the results of the Lee-Reddy algorithm. The consideration of the activities of flip-flops does not offer significantly additional reduction, if the area minimisation is the only goal for the partial-scan selection. The static struc- tural information such as number of fanins and number of fanouts is doing well in the structural analy- sis based approach. Table 4 shows the case where w, =0 and wp = 10. This set up is totally aimed at minimis- ing power overhead. The results show that our algo- rithm can have 38.70% power reduction, as compared to the original Lee-Reddy algorithm.
234
From the experimental results, we can see that this proposed algorithm only takes about 200 seconds on average to find the appropriate w for each case. How- ever, the timing complexity increases when the circuit size increases. This is because the underlined cycle breaking algorithm will take longer time in those cases. It takes about one CPU hour to find the w for ~38417 according to the Table 2. The time complexity is still
acceptable because we only need to run this program once for each case.
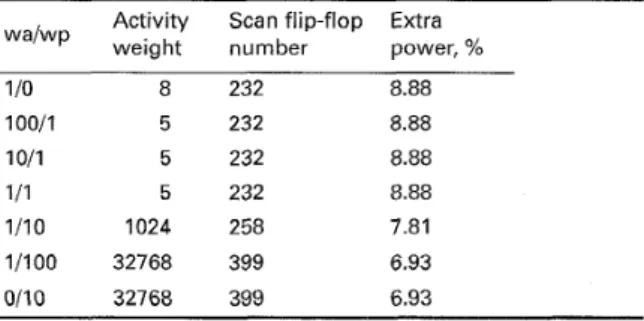
Table 5: Result of search algorithm for circuit ~ 1 5 8 5 0
Activity Scan flip-flop Extra wa/wp weight number power, %
1 IO 8 232 8.88 100/1 5 232 8.88 1011 5 232 8.88 111 5 232 8.88 1110 1024 258 7.81 1/100 32768 399 6.93 0110 32768 399 6.93
Total flip-flop number is 597
Since the sample-and-search algorithm can find the best heuristic selection weight(w) for different cost function with user-specified parameters w, and wp, we run our algorithm with some different w, and wp for some circuits. The results of circuit ~ 1 5 8 5 0 are shown Table 4: Extra power overhead comparisons
Lee-Reddy algorithm Our algorithm Circuit
name Flip-flop Total Flip-flop Total Cost reduction CPU
number cost number cost ratio, % time, s
s298 3/14 1.10 32 311 4 0.09 91.82 0.6 s344 s349 s382 s400 s420 s444 s510 s526 s526n s641 s713 s820 s832 s838 s953 SI 196 s1238 s1423 s1488 s5378 s9234 s13027 SI 5850 ~35932 s38417 s38584 average S1494 5/15 5/12 9/21 9/21 0116 9121 516 5/21 5/21 7/19 7/19 415 415 15/32 5129 0116 0116 38/74 516 5/6 321179 661228 1361669 2321597 30611728 6101 1636 71 81 1636 0.67 0.67 0.80 0.80 0 1.18 1.62 1.05 1.05 0.73 0.72 1.89 1.90 1.60 0.29 0 0 1.01 1.45 1.44 0.29 0.59 0.59 0.96 0.41 0.78 0.95 0 0 0 0 0 1 0 4 4 0 0 I 1 16 1 0 0 49152 1 1 0 256 128 32768 0 2048 848 5/15 5/12 9/12 9/21 0116 9/21 516 5/21 5/21 7/19 7/19 415 415 12/32 5/29 0116 0116 42/74 516 5/6 321179 711228 1531669 3951597 30611728 9831 1636 79011452 0.43 0.43 0.40 0.40 0 0.39 1.32 0.07 0.07 0.71 0.70 0.78 0.77 0 0.20 0 0 0.41 1.41 1.40 0.26 0.28 0.35 0.69 0.23 0.41 0.90 35.82 0.2 35.82 0.3 50.00 0.4 50.00 0.4 0 0.3 66.95 0.4 18.52 0.1 93.33 1 .o 93.33 1
.o
2.74 0.4 2.78 0.4 58.73 0.1 59.47 0.1 100 15.5 31.03 0.6 0 0.1 0 0.2 59.41 20.9 2.76 0.2 2.78 0.2 10.34 10.4 52.54 92.3 40.68 119.5 28.13 984.1 43.90 1074.4 47.44 1974.8 5.26 1063.4 38.70 191.5w, = 0, wp = IO, cost = 10*EPJPt
in Table 5. We can see that the smaller the w,lw, ratio is, the larger the optimal w is, and the lower that the extra power is. On the contrary, the number of scan flip-flops selected is larger. This phenomenon confirms our intuition that when w p is set high, the goal is to minimise the power overhead.
5 Concluding remiarks
In this paper, we proposed an approach that can exploit between area and power overheads for the par- tial-scan selection problem. Because of the powerful sample-and-search algorithm, our approach can find efficiently a very good solution for this objective. Cur- rently, our approach only considers the area and power overheads, a method that considers area, power and timing simultaneously will be studied in the future.
References
TRISCHLER, E.: ‘Incomplete scan path with an automatic test generation approach’,Proceedings of Int. Test Conf., 1980, pp. AGRAWAL, V.D., CHENG, K.T., JOHNSON, D.D., and LIN, T.: ‘A complete solution to the partial scan problem’. Pro- ceedings of Int. Test Conf., 1987, pp. 44-51
MA, H-K. T., DEVADlAS, S., NEWTON, A.R., and SANGIO-
VANNI-VINCENTELLI, A.: ‘An incomplete scan design approach to test genera tion for sequential machines’. Proceedings of Int. Test Conf., 1988, pp. 730-734
CHENG, K.T., and AGRAWAL, V.D.: ‘An economical scan design for sequential logic test generation’. Proceedings of 19th Int. Symp. Fault-Tolerant Comput., 1989, pp. 28-35
GUPTA, R., and BREUER, M.A.: ‘BALLAST: A methodology for partial scan design’. Proceedings of 19th Int. Symp. Fault-Tol- erant Comput., 1989, pp. 118-125
WUNDERLICH, H-J.: ‘The design of random-testable sequential circuits’. Proceedings of 19th Int. Symp. Fault-Tolerant Comput., 1989, pp. 110-117
GOLDSTEIN, L.H.: ‘Controllabilityiobservability analysis of digital circuits’, ZEEE Trans. Circuits Syst., 1979, 26, pp. 685-693
153-162
8 LEE, D.H., and REDDY, S.M.: ‘On determining scan flip-flops in partial scan designs’. Proceedings of Int. Conf. Computer- Aided Des., November 1990, pp. 322-325
9 ABRAMORICI, M., KULIKOWSKI, J.J., and ROY, R.K.: ‘The best flip-flops to scan’. Proceedings of Int. Test Conf., 1991, pp. 166173
10 CHICKERMANE, V., and PATEL, J.H.: ‘An optimization based approach to the partial scan design problem’. Proceedings of Int. Test Conf., 1991, pp. 377-386
11 CHICKERMANE, V., and PATEL, J.H.: ‘A fault oriented par- tial scan design approach’. Proceedings of ICCAD, 1991, pp. 400403
12 LIN, C.-C., LEE, M.T.-C., MAREK-SADOWSKA, M., and CHEN, K.-C.: ‘Cost-free scan: A low-overhead scan path design methodology’. Proceedings of Int. Conf Comput.-Aided Des., November 1995, pp. 528-533
13 JOU, J.Y., and CHENG, K.T.: ‘Timing-driven partial scan’, ZEEE Des. Test Comput., Winter 1995, pp. 52-59
14 NAJM, F.N.: ‘Power estimation techniques for integrated cir- cuits’. Proceedings of Int. Conf. Comput.-Aided Des., November 1995,
15 GHOSH, A., DEVADAS, S., KEUTZER, K., and WHITE, J.: Estimation of average switching activity in combinational and sequential circuits’. Proceedings of 29th ACMLEEE Des. Autom. Conf., June 1992, pp. 253-259
16 ISMAEEL, A.A., and BREUER, M.A.: ‘The probability of error detection in sequential circuits using random test vectors’, J. Elec- tron. Testing, 1991, 1, pp. 245-256
17 HACHTEL, G.D., MACII, E., PARDO, A., and SOMENZI, F.: ‘Probabilistic analysis of large finite state machines’. Proceedings of 31st ACMiIEEE Des. Autom. Conf., June 1994, pp. 270-275 18 MONTEIRO, J., and DEVADAS, S.: ‘A methodology for effi-
cient estimation of switching activity in sequential logic circuits’. Proceedings of 31st ACMiIEEE Des. Autom. Conf., June 1994, pp. 12-17
19 TSUI, C.-Y., PEDRAM, M., and DESPAIN, A.M.: ‘Exact and approximate methods for calculating signal and transition proba- bilities in FSMs’. Proceedings of 31st ACMiIEEE Des. Antom. Conf., June 1994, pp. 18-23
20 CHOU, T.L., and ROY, K.: ‘Estimation of sequential circuit activity considering spatial and temporal correlations’. Proceed- ings of Int. Conf. Comput. Des., 1995, pp. 577-582
21 NAJM, F.N., GOEL, S., and HAJJ, I.N.: ‘Power estimation in sequential circuits’. Proceedings of 32nd Des. Autom. Conf., June 1995, pp. 635-640
22 CHOU, T.L., and ROY, K.: ‘Statistical estimation of sequential circuit activity’. Proceedings of IEEE Int. Conf. Cornput.-Aided Des., November 1995,
23 LEVY, H., and LOW, D.W.: ‘A contraction algorithm for find- ing small cycle cutsets’, J. Algorithms, 1988, 9, pp. 470493