程式弱點視覺化技術 - 政大學術集成
58
0
0
全文
(2) Abstract Web application security has become a critical issue as more and more personal and business applications have appeared in recent years. It is known that Web applications are vulnerable due to software defects. Open to public users, vulnerable Websites may experience malicious attacks from the Internet. We present a new Web-service platform with which system developers can detect and patch potential vulnerabilities of their Web applications online. Taking advantage of static string analysis techniques, our. 政 治 大. analysis ensures that the patched programs are free from vulnerabilities with respect to. 立. given attack patterns. Specifically, we integrate the service front end with program-. ‧ 國. 學. visualization techniques, developing a 3D interface/presentation that allows users to access and view the analysis results in a visualization environment with the aim of. ‧. improving users’ comprehension of programs, and especially of how vulnerabilities get. Nat. sit. y. exploited and patched. We report our analysis results on several open-source. al. n. vulnerabilities.. er. io. applications, finding and patching various previously unknown as well as known. Ch. engchi. i n U. v. Keywords: Visualization, Web Security, String Analysis, Program Comprehension.. i.
(3) CONTENTS. Abstract ............................................................................................................................................ i CONTENTS ........................................................................................................................................ii List of Figures ..................................................................................................................................iii List of Tables ....................................................................................................................................iv CHAPTER 1 INTRODUCTION ....................................................................................................... 1 1.1 Background and Motivation ....................................................................................... 1 1.2 Approach: Patching Vulnerabilities Online ................................................................. 1 1.3 Contribution ................................................................................................................ 2 1.4 Content Organization .................................................................................................. 2 CHAPTER 2 LITERATURE REVIEW ............................................................................................... 4 2.1 Content Presentation .................................................................................................. 4 2.2 Program Visualization ................................................................................................. 7 2.3 String Analysis and Vulnerability Detection ................................................................ 9 CHAPTER 3 PATCHER: THE WEB SERVICE ................................................................................. 12 3.1 Web Service .............................................................................................................. 13 3.2 Architecture .............................................................................................................. 14 CHAPTER 4 VISUALIZATION ...................................................................................................... 20 4.1 Software Comprehension ......................................................................................... 21 4.1.1 Program Visualization Design and Implementation ..................................... 23 4.2 Graphic Visualization................................................................................................. 30 4.2.1 Processing Graphic Inputs ............................................................................. 33 4.2.2 Building Interactive Graphs ........................................................................... 35 4.3 App: The Mobile Application on the Client Side ....................................................... 36 4.4 Integration of the Web Service, the Visualization Device, and the App ................... 38 CHAPTER 5 EVALUATION .......................................................................................................... 42 CHAPTER 6 CONCLUSION ......................................................................................................... 46 6.1 Conclusion ................................................................................................................. 46 6.2 Ongoing Work ........................................................................................................... 47 References ..................................................................................................................................... 47. 立. 政 治 大. ‧. ‧ 國. 學. n. er. io. sit. y. Nat. al. Ch. engchi. ii. i n U. v.
(4) List of Figures Figure 1.The analysis components of Patcher. ............................................................. 12 Figure 2.The architecture of Web service. .................................................................... 14 Figure 3. The login page of the Website. ...................................................................... 16 Figure 4 The registration page. ..................................................................................... 16 Figure 5. The page for uploading files. ......................................................................... 17 Figure 6. The list of uploaded applications. .................................................................. 17 Figure 7. The vulnerable file list of a target application. .............................................. 18 Figure 8. Users can find the vulnerability by highlighted codes. ................................ 18 Figure 9. The patch code will be automatically attached once the patch label is clicked. ............................................................................................................................... 19 Figure 10. Architecture of the system. .......................................................................... 23 Figure 11: The data structure of system representation level. ...................................... 27 Figure 12: The data structure of architectural and file representation levels. ............... 27 Figure 13: The data structure of the graph level. .......................................................... 27 Figure 14: The data format of system representation level........................................... 28 Figure 15: The data format of architectural and file representation level. .................... 28 Figure 16: The data format of dependency-graph level and data-flow level. ............... 29 Figure 17. The graph represents the security status of the target application. .............. 30 Figure 18. Users can explore the dependency graph by checking nodes with the information. ........................................................................................................... 31 Figure 19. The algorithm of generating interactive dependency graphs. ..................... 35 Figure 20. The source code will be highlighted when the corresponded node is selected. ............................................................................................................................... 36 Figure 21. Color themes of security status.................................................................... 37 Figure 22. The integration of front-end applications. ................................................... 40 Figure 23. The sequence of visualization solution........................................................ 41 Figure 24. The bee comb and dependency graphs of schoolmate. ............................... 43 Figure 25.The bee comb and dependency graphs of benchmark. ................................. 44 Figure 26. The bee comb and dependency graphs of smalldata. .................................. 44 Figure 27.The bee comb of market. .............................................................................. 45. 立. 政 治 大. ‧. ‧ 國. 學. n. er. io. sit. y. Nat. al. Ch. engchi. iii. i n U. v.
(5) List of Tables Table 1.Abstraction levels of the system ...................................................................... 21 Table 2.The results of the analysis ................................................................................ 43. 立. 政 治 大. ‧. ‧ 國. 學. n. er. io. sit. y. Nat. al. Ch. engchi. iv. i n U. v.
(6) CHAPTER 1 INTRODUCTION 1.1. Background and Motivation In the past decade, Web applications have become a crucial part of commerce,. entertainment, and social interaction, and they are rapidly replacing desktop applications. In the near future, they are expected to play critical roles in national infrastructures such as healthcare, national security, and the power grid. However, there is a large stumbling block to the everincreasing reliance on Web applications in almost every aspect of society: they are notorious for. 政 治 大. security vulnerabilities that can be exploited by malicious users. Global accessibility of Web. 立. applications makes this a very serious problem because malicious users around the world can. ‧ 國. 學. exploit a vulnerable Web application and cause serious damage.. ‧. There are many information-security tools on the market, and an interesting observation is that most data that common software displays are in a text format, which is suitable for. y. Nat. io. sit. engineers to understand and maintain their programs. However, such information is not enough. n. al. er. in business. For non-technical users—e.g., managers of IT departments or application users—it. Ch. i n U. v. is hard to determine whether the core problem of the application is simply the information it. engchi. displays for engineers, and it is hard to tell whether it is safe to use the application or to make business decisions based on it.. 1.2. Approach: Patching Vulnerabilities Online Patcher is a new online service that is open to public users, who can access and upload their. code to check for potential vulnerabilities. Users can also insert patches that are automatically generated to prevent malicious exploitations of their programs. While deploying new Web services, it is essential to build confidence in their security mechanisms. To the best of our knowledge, this is the. 1.
(7) first public online service that secures Web applications using formal verification techniques. Another advantage of our service is its user-friendly interface that aims to improve users’ comprehension of where the program vulnerabilities are, how they get exploited, and how they can be patched. In particular, we have developed an interactive 3D interface/presentation for users that allows them to access and view the risk status of their applications and their vulnerabilities. The service provides users with a clear view of vulnerabilities of target applications and a quick fix to reduce their risks. To sum up, we are providing a new service platform for patching and viewing Web application vulnerabilities, combining advanced static-string analysis techniques as the back. 政 治 大. end and visualization techniques as the front end. We believe this service will certainly reduce the. 立. risks of Web applications and improve their security.. ‧ 國. 學. 1.3. Contribution. ‧. Our solution tries to help users improve their comprehension of their programs, which is an issue that is especially critical for managers of IT departments because the solutions can help. y. Nat. io. sit. them to realize the status of target applications and make decisions in more quickly. Also, the. n. al. er. tasks can be assigned to engineers clearly because the views of source code and architecture are. Ch. i n U. v. provided. Users can access the analysis report from different devices so that the analysis report. engchi. can be displayed in different situations and places. We believe it would significantly improve the efficiency of program development and maintenance.. 1.4. Content Organization. The rest of the paper is structured as follows: Chapter 2: We review related work on content presentation, program visualization, and string analysis. Chapter 3: We give an overview of Patcher and the Web service.. 2.
(8) Chapter 4: We introduce graphic visualization and its implementation. Chapter 5: We evaluate our platform with several open-public applications. Chapter 6: We conclude and make suggestions for future work.. 立. 政 治 大. ‧. ‧ 國. 學. n. er. io. sit. y. Nat. al. Ch. engchi. 3. i n U. v.
(9) CHAPTER 2 LITERATURE REVIEW 2.1. Content Presentation Research studies have discussed the transformation of content on the big screen of. desktop computers to content on the small screens of mobile devices. Ahmadi and Kong (2012) introduced an adaptive layout on the mobile screen based on visual analysis and structural analysis. It provides users with a tool to customize the screen layouts of their mobiles. At first, it will have page segmentation, including visual analysis and heuristic rules and. 政 治 大. content analysis. After studying some popular Websites, the researchers found that most Web. 立. pages have this pattern in common. The visual analysis is approached using the heuristic rules.. ‧ 國. 學. By pixel analysis, a Web page can divide into five sections, which are the top, left menu, right. ‧. menu, bottom, and main content. Also, it classifies the functionalities of the HTML elements so that it can enclose the semantics of the page content. To provide a user-centric, adaptive layout,. y. Nat. io. sit. the tool will include preprocessing, and it will eliminate all of the elements not necessary to. n. al. er. optimize the structure. Then the visible element in the Web page will be resized to fit the mobile. Ch. i n U. v. screen. Two ways about methods of content presentation were introduced (Ahmadi and Kong,. engchi. 2012)—narrow -page presentation and multi-page presentation. After giving the advantages and drawbacks, it the Web page decides to take multi-page as its choice. It makes, which requires users to customize their navigation facilities to include overview, search, and shortcut. The set up files will be recorded as XML files so that users can reload themit. It also introduced other tools like Minimap and Gateway. List their advantages and drawbacks and try to integrate with its tool and improve the weakness. Ahmadi and Kong(2012) made an evaluation of their approach and found that the browser with the tables and navigation links did improve efficiency and made. 4.
(10) users more satisfied. They compared their browser (SSD v.3) with the Opera mobile browser based on four aspects: subjective satisfaction, efficiency, error prevention, and aesthetics. The results showed that users were more satisfied with the SSD v.3 than with the Opera mobile browser except in the category of error prevention. The reason is that the SSD v.3 uses keyword extraction to generate the title of a navigation link. Although the approach shows the advantage of providing users with a customized and adaptive layout on mobile browsers, there are still numerous problems to be solved, including the diversity of the Document Object Model (DOM). 治 政 大 device manufacturing companies evaluate the browser. 立. structure, the difficulty of dealing with dynamic Web technologies (e.g., Flash), and how mobile. Virpi et al. (2006) gave the principles about content presentation on mobile devices.. ‧ 國. 學. Instead of focusing the effort on transformations, we need to obey their principles to improve the. ‧. usability and performance of the content display of the application on the mobile device. Ahmadi and Kong (2012) suggested using hierarchical links and navigations to deal with cases that have. y. Nat. er. io. sit. many contents in the screen. Gateway (Mackay, 2003) reduced its page scale so that users would not have to do too much vertical and horizontal scrolling, which they thought would cause them. n. al. to become frustrated.. Ch. engchi. i n U. v. In order to display original content from Web pages on mobile devices, some elements have to be removed. Such elements can be formatting style, dynamic objects, or animation effects, which may increase the effort of processing the content. Presentation of content on mobile devices is totally different from that of Web pages, which provide users not only with content but also with many additional functions such as multiple navigations and fantasy effects. These elements have to be removed in mobile content to allow easier browsing and to improve. 5.
(11) the efficiency. Still, developers try to present as much content on mobile devices as on Web pages. Minimap (Virpi et al., 2006) developed a visualization method to provide users with a suitable layout of contents and listed the requirements of good content presentation for mobile devices. For example, it is better to fit more content on the screen and eliminate the manipulation of horizontal scrolling. Also, developers have to fulfill the requirement above without destroying the original layout and introducing modes. Minimap adjusts the width of text and the rest of the. 治 政 大 page elements such as images occupying too much space, Minimap scales down the non-textual 立. elements to fit the screen so that users do not need to do much horizontal scrolling. In the case of. and scales up the size of textual elements by using the algorithm. All of this means that it can fit. ‧ 國. 學. more content in the viewport.. ‧. Minimap preserves the format of large data tables because tabular information such as schedules, stock prices, and time tables, is relevant for mobile use. It also provides a page. y. Nat. and it is visible while users scroll down the page.. n. al. 2.2. Dependency graph. Ch. engchi. er. io. sit. overview to help users navigate the page. The page overview is a mini map of the whole page,. i n U. v. A dependency graph is a directed graph representing dependency relations of objects and a dependency graph consist edges and nodes. The edges connect different nodes with directions. The system can trace how the value of variable be modified in each node. Ottenstein (1984) suggested that dependency graph is a suitable form for the internal program representation because it allows programs to be sliced in linear time for debugging and optimizing. Susan et. al.(1982) introduced the tool gprof which display textual decompositions of the program structure in a convenient and informative way. The gprof profiler counts the execution time in. 6.
(12) the implementation of abstractions and it can help users to maintain and optimize the large, structured and hierarchical program. Lukoit et al.(2000) developed the visualization front-end TraceGraph which allows engineers to run the specific feature and view how the program execution varies. The program analyzer Stranger (Yu et al., 2010) parses the program codes and builds the dependency graph of program node. The analyzer exams all the node that suspicious variable pass through and finds the vulnerable node. Dependency graphs play the important roles in program analysis because it helps users easily understand the structure of the program.. 治 政 大Grove et al. (1997) introduced without documentations by visualizing the dependency graphs. 立 RIPPLES (Chen and Rajich, 2001) helps users modify the source codes of legacy program. the model which unified more algorithms to construct the call graphs of large and complicate. ‧ 國. 學. programs. We also try to construct the dependency graphs in the front end applications so that. Program Visualization. sit. y. Nat. 2.3. ‧. users can know more about the vulnerabilities and have some idea about solving the problem.. io. er. Visualization can help improve the comprehension of abstract program logics.. al. iv n C danger, caution, and safety with the colors yellow, and h ered,n g c h i Ugreen. Red represents the maximum n. Gammatella (Orso et al., 2004) used the analogy of a traffic light to convey the concepts of. value, and green represents the minimum value. The way that colors are assigned to status depends on the view of the targeting dimension. In Patcher, we also use colors to in indicate vulnerable files and deliver information on the risks of applications. Wapiti (Surribas, 2013) is a scanner for auditing the security of web applications and it performs black-box examinations which scan webpages without studying the source code. It doesn’t provide the graphical interface and users have to manipulate through the command line interface. After auditing, the system generates the complete report with HTML format include. 7.
(13) the detail of vulnerabilities. All of the vulnerabilities will be categorized as three levels (high, medium, low) by the risk and highlighted by different colors. The report also contains a column chart for displaying the comparative of the vulnerabilities found. It also provides the attack detail of the examination with the risk level, the url, the attack string and the category of vulnerability. Netsparker (Mavituna Security, 2013) is a web application security scanner which can crawl, attack and identify and identify vulnerabilities in various types of web applications. It also performs black box examination by scanning each web page and the issue will be listed in a. 政 治 大. group when Netsparker detects it. Users can also check the analysis information through the scan summary dashboard.. 立. Bohnet and Döllner (2006) developed the a technique that provides for the extraction of. ‧ 國. 學. system architectures and dependencies between code components. The model includes the class-. ‧. level model and the architectural-level model, and users can choose a scenario (a sequence of interactions between users and the system) that triggers specific executions. The visual layout. y. Nat. er. io. sit. separates nodes by the components such as functions and directories, and it also provides the capability to quickly access source codes by synchronizing the textual-source-code view with its. n. al. Ch. i n U. v. graph-exploration view. If users click the function shape or call relation, the corresponding. engchi. source code will be loaded into the textual source code view area, with the selected code line highlighted. Alternatively, the corresponding shape in the graph-exploration view will be highlighted when the source code line is selected. Later, we will show the capabilities of the cover program codes (level 0), data flows (level 1), dependency graphs (level 2), and architectural-level views (level 4), as specified in Table 1. Some recent products focus on how to present contents on mobile devices. SmartFoxServer (2013) is a multi-platform technology to integrate the Web server with mobile. 8.
(14) technology (Adobe Flash, Unity, iOS, Android, HTML5), enabling developers to build a multiuser platform. Ahmadi and Kong (2012) introduced an adaptive layout on the mobile screen based on advanced visual analysis and structural analysis that provides users with a tool to customize the screen layout on their mobile devices. Our implementation for visualization is on Unity, which is a game engine and Integrated Device Electronics (IDE) cross-platform that not only supports PC, Mac, Xbox 360, and Web servers but also mobile operation systems such as iOS and Android. The graphic engine of Unity. 治 政 Android), and proprietary APIs (e.g., Wii). Using Unity, our大 visualization tool can be deployed 立. can be incorporated with Direct3D (Windows), OpenGL (Mac, Windows), OpenGL ES (iOS,. to multiple platforms, as evidenced by a remark from a Unity official: “author once, deploy. ‧ 國. 學. everywhere.” Unity also supports integration with 3Ds Max, Maya, Softimage, Blender, Cinema. ‧. 4D, Photoshop, and Adobe Fireworks. Changes that are made to the listed assets can be automatically updated in the Unity environment.. sit. y. Nat. String Analysis and Vulnerability Detection. io. er. 2.4. al. iv n C approach has been grammar-based stringhanalysis i U computes an over-approximation e n gthat c hstatically n. Due to its importance in security, string analysis has been widely studied. One influential. of the values of string expressions in Java programs (Christensen et al., 2003), which has also been used to check for various types of errors in Web applications (Gould et al., 2004; Minamide 2005; Wassermann and Su, 2007 and 2008). In addition, there are several recently developed string-analysis tools that use symbolic string analysis based on digital facility access (DFA) encodings (Shannon et al., 2007; Fu et al., 2007; Yu et al., 2008). Some of them are based on symbolic execution and use a DFA representation to model and verify the string manipulation operations in Java programs (Shannon. 9.
(15) et al., 2007; Fu et al., 2007). HAMPI (Kiezun et al. 2009) is a bounded-string constraint solver. It outputs a string that satisfies all the constraints or reports that the constraints are unsatisfiable. Note that this type of bounded analysis cannot be used for sound string analysis, whereas the string-analysis techniques that we adopted in this paper are sound. Yu et al. (2008, 2010) have used single-track, DFA–based, symbolic-reachability analysis to verify the correctness of string sanitization operations in hypertext preprocessor (PHP) programs. Their preliminary results on generating (non-relational) vulnerability signatures using single-track DFA were reported in a. 治 政 大 the reachable configurations of All of the above results use single-track DFA and encode 立. short paper (Yu et al., 2009).. each string variable separately—i.e., they use a non-relational string analysis. Yu et al. (2010). ‧ 國. 學. reported the results on foundations of string analysis using multi-track automata, which read. ‧. tuples of characters as input instead of only single characters. Each string variable corresponds to a particular track (i.e., a particular position in the tuple), thereby allowing a relational analysis.. y. Nat. er. io. sit. As demonstrated in Yu et al. (2010), a relational analysis enables verification of properties that cannot be verified with the earlier approaches. However, relational string analysis can generate. n. al. Ch. i n U. v. automata that are exponentially larger than the automata generated during non-relational string. engchi. analysis. To tackle this problem, we also incorporated the abstraction techniques with the tool, including alphabet abstractions and relational abstractions (Yu et al., 2011), which enabled us to improve the performance of the relational string analysis by adjusting its precision. The earlier results on relational string analysis presented in (Yu et al., 2010) do not use any abstraction techniques. It is critical that vulnerabilities are not only discovered quickly but also repaired quickly. There has been previous work on automatically generating filters for blocking bad input (e.g., Costa et. 10.
(16) al., 2007). This work focuses on buffer-overflow vulnerabilities that are different from the string vulnerabilities we investigate here. In Costa et al. (2007), the generation of filters is done starting with an existing exploit, whereas we plan to start with an attack pattern instead. Yu et al. (2009), used single-track automata to generate the vulnerability signatures of the detected vulnerabilities in the Web applications. In addition to generating vulnerability signatures, Yu et al. (2009) used the vulnerability signatures to generate effective sanitization statements, and by applying their techniques we were able to prove the absence of vulnerabilities in the applications that were. 治 政 relations among variables. As shown in Yu et al. (2009),大 this limitation makes the analysis 立. patched with these statements. On the other hand, single-track automata are limited to model. generate rather coarse vulnerability signatures—e.g., Σ* (any arbitrary string) for a vulnerability. ‧ 國. 學. that can be exploited from multiple inputs. To tackle this problem, Yu et al. (2010) proposed a. ‧. new approach to applying relational string analysis. They were able to generate more precise vulnerability signatures by catching the relations among inputs (Yu et al., 2011).. n. er. io. sit. y. Nat. al. Ch. engchi. 11. i n U. v.
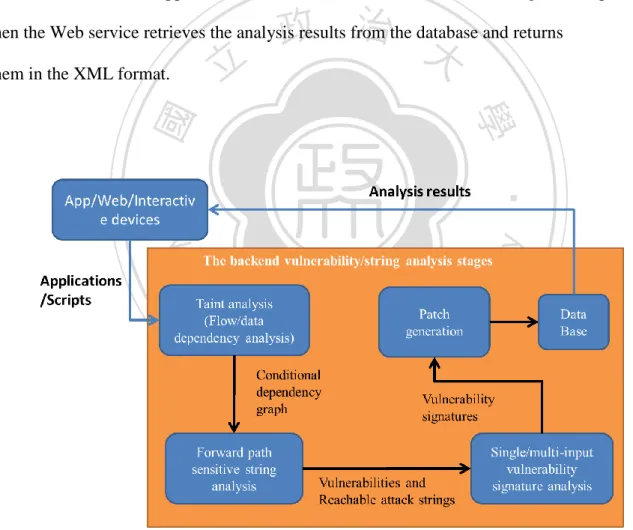
(17) CHAPTER 3 “PATCHER”: THE WEB SERVICE We propose Patcher to patch Web application vulnerabilities online so that users can upload PHP codes and view the results in different ways with different devices. We build the Web service as the middleware. The file user upload will be sent to the Web service, which will send it to Patcher in the back end after parsing it. Patcher will then analyze the source code and store the report in its database. The front end’s applications communicate with the Web service to get the requested data,. 政 治 大. then the Web service retrieves the analysis results from the database and returns. 立. them in the XML format.. ‧. ‧ 國. 學. n. er. io. sit. y. Nat. al. Ch. engchi. i n U. v. Figure 1.The analysis components of Patcher. The analysis process of Patcher is shown in Fig. 1. Users first upload the file they want to check, then the system performs taint analysis to identify tainted sinks, which are sensitive. 12.
(18) functions that may take values from user inputs. This is done by flow and data-dependency analysis. For each tainted sink, the system generates its conditional-dependency graph accordingly and passes the conditional-dependency graph to our string analyzer for further inspection. Then the system performs forward-path, sensitive-string analysis on the conditionaldependency graph using automata to calculate all possible values of each sink during execution. If it includes an attack string, we report the sink as a vulnerability, and for each vulnerability we subject all reachable attack strings (characterized as automatons) to vulnerability signature. 治 政 and multi-track automata to generate all potential malicious 大 inputs. Based on these vulnerability 立 analysis. At the next step, the system uses both forward and backward analysis with single-track. signatures, we generated effective patches for inputs that ensure the removal of all reachable. ‧ 國. 學. attack strings on sinks. Finally we stored the report that summarizes the analysis and. Nat. y. Web Service. io. sit. 3.1. ‧. performance in the database.. n. al. er. The Web service plays the role of the middleware and helps the front-end application to. Ch. i n U. v. communicate with the back-end server, then the Web service receives the data from the client. engchi. side and sends it to Patcher for analyzing. After analyzing the data, Patcher generates the analysis results, including the lists of vulnerabilities and patch codes for vulnerabilities, and stores them in the database. When the front-end application requests the Web service for analysis results, the Web service retrieves the analysis results by the query string, and the front-end applications do visualization based on the analysis results they receive.. 13.
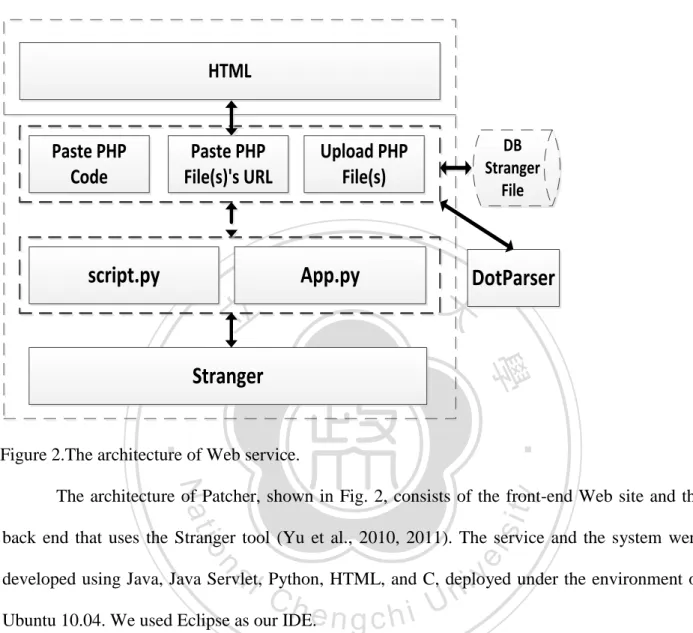
(19) 3.2. Architecture. HTML. Paste PHP Code. Paste PHP File(s)'s URL. script.py. App.py 治 DotParser 政 大. 學. ‧ 國. 立. DB Stranger File. Upload PHP File(s). Stranger. ‧. Figure 2.The architecture of Web service.. y. Nat. sit. The architecture of Patcher, shown in Fig. 2, consists of the front-end Web site and the. n. al. er. io. back end that uses the Stranger tool (Yu et al., 2010, 2011). The service and the system were. i n U. v. developed using Java, Java Servlet, Python, HTML, and C, deployed under the environment of. Ch. engchi. Ubuntu 10.04. We used Eclipse as our IDE.. Several services are provided by the back-end server, including member management (register, login, logout, authority management), PHP file upload (single file, source code, applications), vulnerabilities analysis, patch code offering, and analysis history. To improve the usability for the client side, the server side provides two formats of results analysis. The client side receives the analysis results, then determines by the header if it is a single file or an application, and the data can be displayed in different platforms such as Websites, mobile apps, or desktop applications using different display formats. 14.
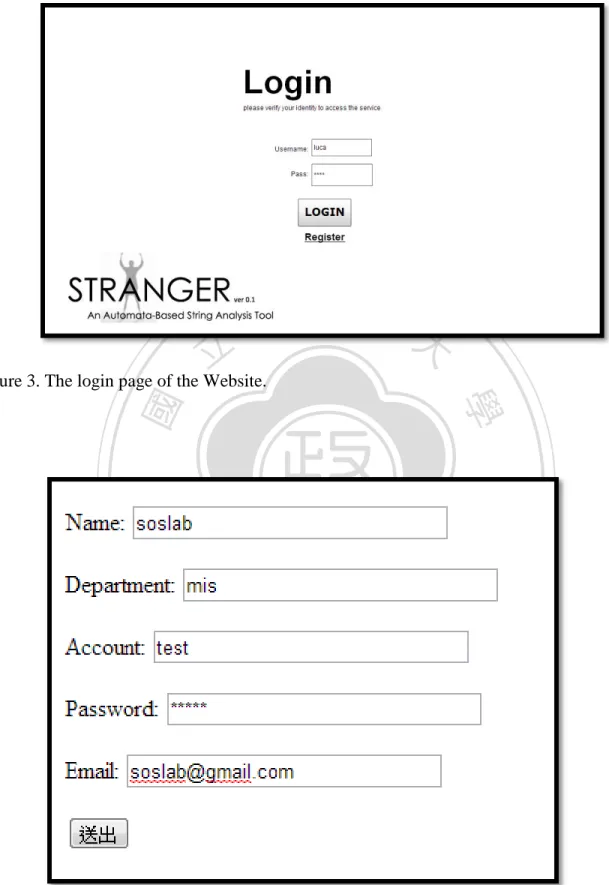
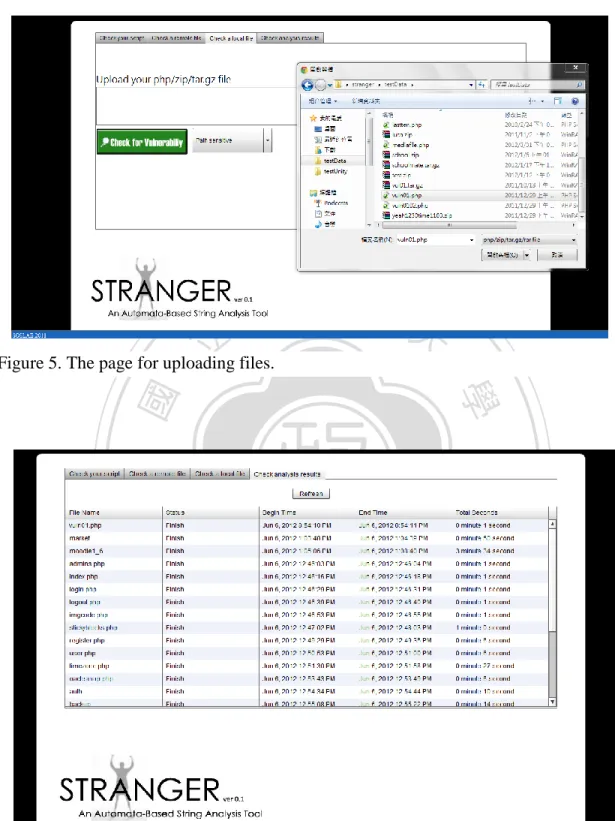
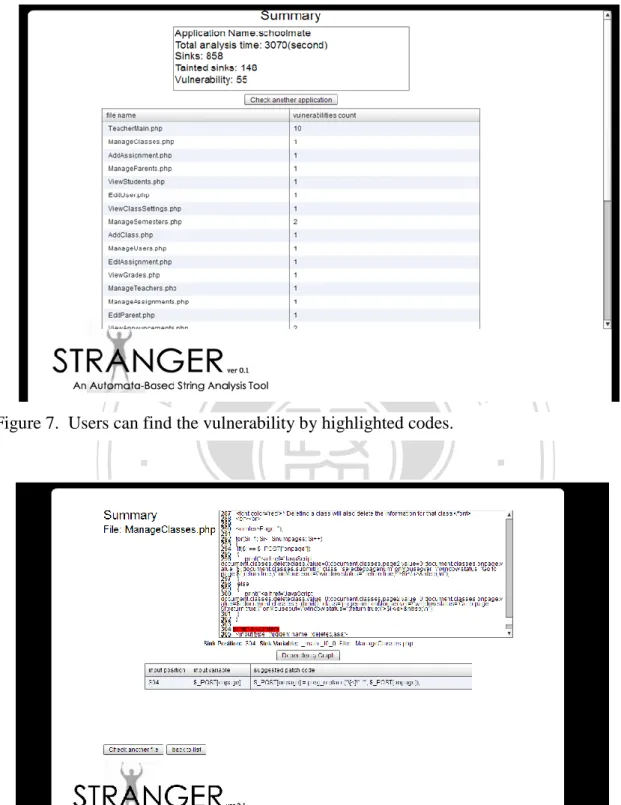
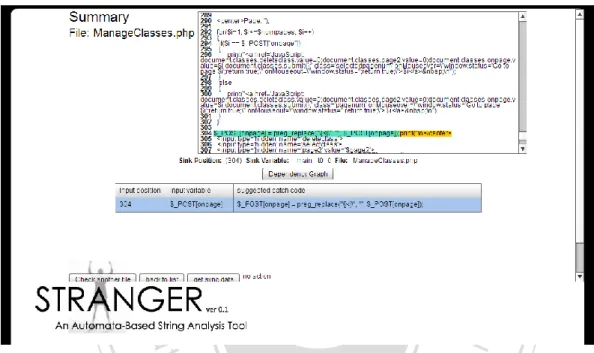
(20) Users have to login by their identity so that they can use the service (see Fig. 3), and they have to sign up on the registration page (see Fig. 4) if they do not have an account. They can then upload a file through the Website (see Fig. 5), and the file uploaded can be source code, a PHP file, or a compressed file. After uploading the file, users will be shown a list of all the files they have uploaded (see Fig. 6). The list also provides information about the time spent on analysis and the analysis status of each file. If the user clicks one of the applications in the list, the page will be navigated to another page that contains a list of files in the selected application (see Fig.. 治 政 there is a report summary of the decide whether to check the source code or not. Also, 大 立. 7). The user can get a brief preview of each file by checking the vulnerabilities and can then. application on the top of the page.. ‧ 國. 學. Then the user can choose a file in detail by clicking the name label, which displays a. ‧. summary of the selected file and the vulnerability list (see Fig. 8). If users click one of the vulnerabilities, the text area of the source code will scroll down to the position where the. y. Nat. er. io. sit. vulnerability is located, and a window will pop up providing the detailed information about the vulnerability and the patch code, so that users can revise the code directly.. n. al. Ch. engchi. 15. i n U. v.
(21) 立. 政 治 大. Figure 3. The login page of the Website.. ‧. ‧ 國. 學. n. er. io. sit. y. Nat. al. Ch. engchi. Figure 4 The registration page.. 16. i n U. v.
(22) 立. 政 治 大. Figure 5. The page for uploading files.. ‧. ‧ 國. 學. n. er. io. sit. y. Nat. al. Ch. engchi. Figure 6. The list of uploaded applications.. 17. i n U. v.
(23) 立. 政 治 大. ‧ 國. 學. Figure 7. Users can find the vulnerability by highlighted codes.. ‧. n. er. io. sit. y. Nat. al. Ch. engchi. Figure 8. The vulnerable file list of a target application.. 18. i n U. v.
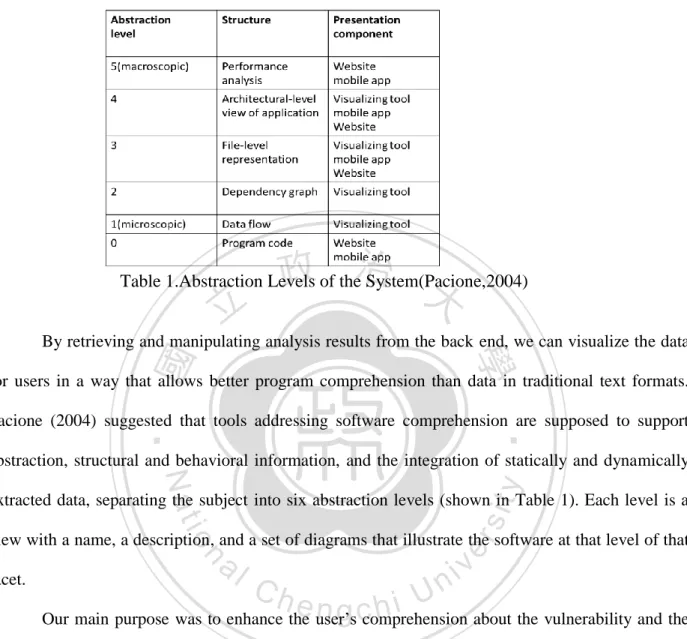
(24) 立. 政 治 大. ‧. ‧ 國. 學 sit. y. Nat. n. al. er. io. Figure 7. The patch code will be automatically attached once the patch label is clicked.. Ch. engchi. 19. i n U. v.
(25) CHAPTER 4 VISUALIZATION There are many functional components and much analysis data available in our system. Normally, if users want to know get a result that is useful and easy to understand, they have to do several things manually, such as find the line number of the vulnerability in the source code and check the vulnerable files one by one. It is inefficient and can make users frustrated. We designed a set of front-end user-interface features that help users to access the information easily. The user interface includes a Website and a visualization tool. In addition to viewing the analysis. 政 治 大. result in the browser, the user can view the graph showing the status of the application and the. 立. dependency graph of the specific file.. ‧ 國. 學. By retrieving the analysis results from the back end, the user can visualize the data to find an easier way to understand the analysis result. The visualization can be categorized as three levels:. ‧. the architecture-level view of the application, the file-level representation, and the dependency. Nat. sit. y. graph. The whole application will be represented as a bee comb, and users can use mobile apps. n. al. er. io. to approach the files in the application, which are characterized as pieces of the bee comb. Users. i n U. v. can also drill down to view the dependency graph and determine which method calls contain the vulnerabilities.. Ch. engchi. 20.
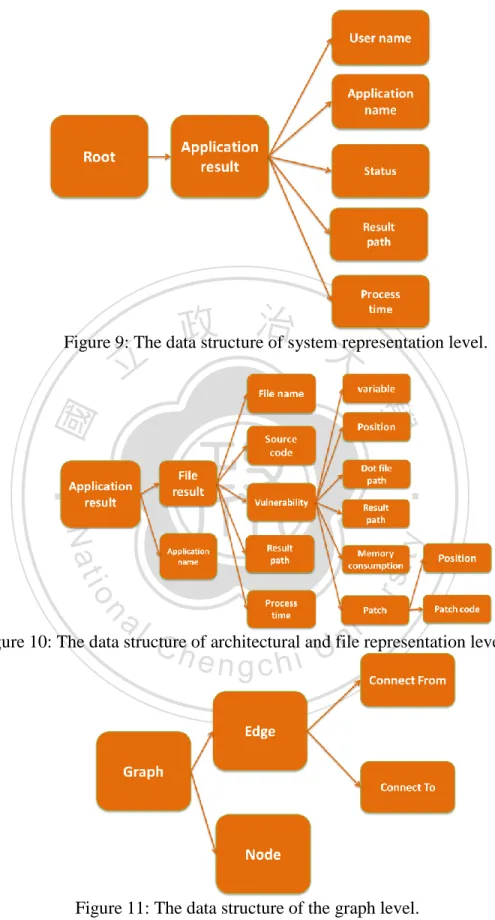
(26) 4.1. Software Comprehension. 政 治 大. Table 1.Abstraction Levels of the System(Pacione,2004). 立. By retrieving and manipulating analysis results from the back end, we can visualize the data. ‧ 國. 學. for users in a way that allows better program comprehension than data in traditional text formats.. ‧. Pacione (2004) suggested that tools addressing software comprehension are supposed to support abstraction, structural and behavioral information, and the integration of statically and dynamically. y. Nat. io. sit. extracted data, separating the subject into six abstraction levels (shown in Table 1). Each level is a. n. al. er. view with a name, a description, and a set of diagrams that illustrate the software at that level of that facet.. Ch. engchi. i n U. v. Our main purpose was to enhance the user’s comprehension about the vulnerability and the program execution of applications or files. We presented the results analysis at six levels, as proposed in (Pacione, 2004), with each level providing analysis results of applications in different aspects. Table 1 lists the corresponding information that we provided at each level. Levels 0, 1, and 2 provide detailed information regarding one vulnerability.. Level 0: The program code will be shown in the Website and mobile app to help users find the vulnerability.. 21.
(27) Level 1: The program execution is simulated by displaying the data flow. The user can trace the flow of input variables in the dependency graph through the visualizing tools. Level 2: The dependency graphs display sink nodes and input nodes of each vulnerability. Users can comprehend the status overall by viewing the dependency graphs. Level 3: Instead of object-level representation, we used file-level representation because objectoriented programming is not often used by PHP developers. Users can check the lists of vulnerable files and improve their comprehension about the file relation on the Website, app, and. 政 治 大. desktop computer. Also, users can get brief information on each file by viewing the bee combs of the visualizing tool.. 立. Level 4: This level provides the entire view of the application. Users can comprehend the. ‧ 國. 學. security status overall by viewing the bee combs through visualizing tools, and then they can. ‧. decide how to patch the vulnerabilities. Also, users can check the application lists through the Website and the app.. y. Nat. obtain the overall information on the application.. n. al. Ch. er. io. sit. Level5: Users can check the analysis summary through the Website and the app so they can. i n U. v. Information in a large-scale view (higher level) gives users a clear view of the high-level. engchi. components and the architecture. Information in a small-scale view provides users with detailed information from specific aspects. Our visualization tool provides browsing capabilities to answer users’ questions, which are generally broad at the beginning and then narrow down to specific issues. That is to say, users can check the vulnerable file in an application when a vulnerability is reported, and then they can drill down to examine the source code to reveal how the vulnerability is raised. Program visualization also requests data from various sources to. 22.
(28) display different views as the dimension changes, which improves the comprehension to provide information from different platforms.. 4.1.1 Program Visualization Design and Implementation. 立. 政 治 大. ‧. ‧ 國. 學. n. er. io. sit. y. Nat. al. Figure 8. Architecture of the system.. Ch. engchi. i n U. v. We developed the Web service so that the front-end application can request the analysis results, which are separated and can be requested at different levels, thus helping with maintenance and improving the performance of the back-end server. We designed the data format for different representation levels, and it is compatible for all applications on different platforms. The engineer can develop the front end—such as apps, Websites, and desktop applications—and represent the analysis results based on the features of applications. In addition. 23.
(29) to representing the level alone, the front-end application can perform the drill-down manipulation, and because the levels are connected by the index users can easily switch the facet to check different levels. The architecture of the system follows the “loosely coupled” principle, which makes it easier to fix if one of the levels does not work. Also, we created a protocol for the communication between the front-end applications, and thus they can synchronize the status and co-operate. We will give an overview of the data format of each representative level in the following section.. 政 治 大. System level: Users first login through the app or the Website. After passing the. 立. authentication, they can upload their applications for investigation or access previous analysis. The. ‧ 國. 學. server keeps the list that includes all of the applications that a user has uploaded, with application names and features; performance data and status; and the paths to access analysis results. The back-. ‧. end server provides the xml file of analysis result for system level with well-define structure as. sit. y. Nat. shown in Fig. 11. There are lots of child nodes (application result) under the root node. Every. io. er. application the user uploaded is represented by a node and the system can get more information by. al. drilling down to the child node. When one of applications in the list is selected, the system can. n. iv n C request the full information of the selected application by the h e n g c h i U result path attribute. The front-end applications can represent the data by textual or graphic ways so that the manager of IT department can easily understand and compared the performance of different applications. Architectural level: Users can select an application in the list to view the details on how many files are vulnerable within the application. This can be done through the app or the Website, and data are represented based on the interface. The level information includes all of the file names, an index, and the vulnerability counts within the application, and users can drill down to the details of a file. The vulnerable files in the visualization tool are displayed as a bee comb, where each file is. 24.
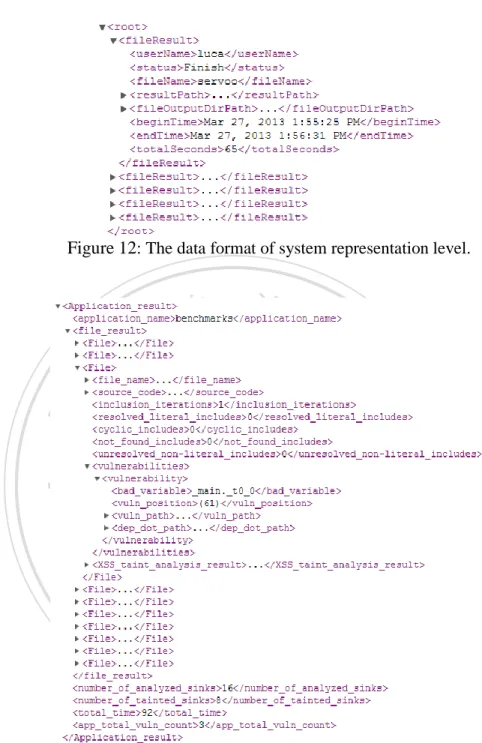
(30) represented as a honey cell and colored in red, yellow, or green. The color indicates how vulnerable a file is (dangerous, moderate, or safe). To represent the architectural level, the system request the analysis result of each file as shown in Fig. 12 and Fig. 15 and eliminate the detail information such as source codes and file path. The system collects the data of vulnerability counts of each file and represents them as different colors. File and program code level: This level provides information on a single file and its source code, and users can check the vulnerabilities in the file. At this level, users can examine each vulnerability in detail, such as the sensitive function, and determine where it is (line of code) and. 政 治 大. how to patch it (where to insert the patch statement). The information can also be represented in. 立. different formats. On the Website, we created a source code editor so that users can directly modify. ‧ 國. 學. the vulnerability or add the automatically generated patch code into the source code, and system developers can fix vulnerabilities without knowing much about the vulnerabilities or the codes. It is. ‧. particularly useful to patch legacy parts of Web applications. On the other hand, users may want to. Nat. sit. y. know what the vulnerabilities are and how they are raised and exploited. We generate an interactive. er. io. dependency graph for each vulnerability for this purpose. This level reveals the detail information of. al. n. iv n C h etongetgmore many child nodes and system can drill down i U about the selected file. Also it c hinformation. vulnerability in each file as shown in Fig.12 and Fig 15. Every file is represented as a node with. can improve performance of system because the system can deal with the data of file individually without processing the redundant data. Dependency-graph level and data-flow level: Every dependency graph corresponds to one vulnerability in the file. Both apps and Websites can access this information through the index of vulnerabilities and trigger the displace device to show the graph in 3D. Our server provides an interactive environment that allows engineers to trace program execution step by step or to run a simulation of a sample path to exploit the vulnerability. We also synchronize the dependency graph. 25.
(31) and source code and highlight the corresponding line of the selected execution (node in the dependency graph) in the source code. That is, users can trace the source code when they explore executions on the dependency graph. The back-end server transforms the dot files into xml files and front-end applications can easily parse and process the data. The data of dependency graph includes nodes and edges which are the basic components of dependency graph and the visualization tool can build the graph based on the information of nodes and edges. After building the static graph, visualization tool build the data flow based on the direction of edge.. 立. 政 治 大. ‧. ‧ 國. 學. n. er. io. sit. y. Nat. al. Ch. engchi. 26. i n U. v.
(32) 政 治 大. Figure 9: The data structure of system representation level.. 立. ‧. ‧ 國. 學. n. er. io. sit. y. Nat. al. Ch. i n U. v. Figure 10: The data structure of architectural and file representation levels.. engchi. Figure 11: The data structure of the graph level.. 27.
(33) Figure 12: The data format of system representation level.. 立. 政 治 大. ‧. ‧ 國. 學. n. er. io. sit. y. Nat. al. Ch. engchi. i n U. v. Figure 13: The data format of architectural and file representation level.. 28.
(34) Figure 14: The data format of dependency-graph level and data-flow level.. 立. 政 治 大. ‧. ‧ 國. 學. n. er. io. sit. y. Nat. al. Ch. engchi. 29. i n U. v.
(35) 4.2. Graphic Visualization. 立. 政 治 大. ‧ 國. 學 ‧. Figure 15. The graph represents the security status of the target application.. Nat. sit. y. We visualize the data and give the user a global view. We collect an analysis report of. n. al. er. io. each file in the application and visualize the data as a bee comb structure graph. Every cell in the. i n U. v. bee comb graph is a single file, and its color will be different based on the vulnerabilities the. Ch. engchi. files have. If a file has many vulnerabilities, it will be more easily attacked, and the cell that the file mapped will have the color red to indicate its dangerous status. On the other hand, if a file has few vulnerabilities but has connections with one or more very dangerous files, its cell will be yellow because it could possibly execute the malicious scripts from the dangerous files. Though the yellow files do not have obvious vulnerabilities, users still have to monitor them, and they are categorized as secondary dangerous files. The third type of files are those without any vulnerabilities and no connections with vulnerable files. The cells they mapped are colored green,. 30.
(36) which means they are safe. The screen will zoom in to the file and list its name and status when users click it.. 立. 政 治 大. ‧ 國. 學. Figure 16. Users can explore the dependency graph by checking nodes with the information.. ‧. Another view we wanted to show was the dependency graph. Originally, Stranger. sit. y. Nat. analyzes the source and builds the dependency graph of the programming logic so that it can. io. er. easily detect the vulnerabilities in the source. This is the core value of information-security. al. analysis. However, users will not be able to see these data in the analysis report, so we wanted to. n. iv n C provide them with views of this aspect.h Users can check the e n g c h i Urelation of the variable and method. in the application, as well as the data flow and how the malicious scripts affect the application. Then they can choose one of the files in the bee comb graph and press the space key, which causes the scene to be transformed to a view of the dependency graph. The dark node represents the sink node, which may cause vulnerabilities, and the red node represents the input node, which receives input values. Users can check every node in the execution process of the target file by clicking the node, which causes the screen to zoom in to the chosen node, with a textual area showing up in the up left corner of the screen. The textual area contains the properties of the. 31.
(37) chosen node, such as the line position, the variable, and the method called. We also provide users with the capability to trace the path from input nodes to the sink node by moving the camera of the screen backward and forward as shown in Fig.18. Users can use the “A” key to move forward and the “S” key to move backward while examing the graph. We integrated the Website with the visualizing tool so that users can manipulate the toolsets at the same time. Users launch the visualization tool when browsing the Patcher website, and the website synchronizes the users’ manipulations with the visualization tool. For instance,. 治 政 大 tool will receive the command contain a list of files in the selected application. The visualization 立. when users click one of the applications in the list and the pages are navigated to, the pages. with information of the target application from the Website. Then the visualization tool will. ‧ 國. 學. transform each file of the selected application into the cell and color it based on the amount of. ‧. vulnerability, so the user can check the overall status of the application. If users drill down to the specific file in the application, the visualization tool will synchronize the manipulation as. y. Nat. io. sit. zooming in the camera to the cell representing the selected file, with the label showing its file. n. al. er. name and security level. In the page of view single file, users can click the “Dependency Graph”. Ch. i n U. v. button to view the dependency graph of vulnerabilities generated by the dot file from the analysis. engchi. report. Users can also switch between different dependency graphs. We are working on reverse synchronizing, which means that the corresponding source codes will be highlighted when the nodes of dependency graphs are chosen. It could improve users’ comprehension because they will not have to check the information of the node in the visualization and then switch to the Website to search for the corresponding source. Having to switch applications and windows too often could cause frustration and make users stop manipulating.. 32.
(38) We use Unity as the development tool to generate the graph, and we will have the material of the cell that is the model exported by the Maya software. First, the user can upload an application to the back-end server and check the vulnerabilities, then the visualization application will load the output XML file provided by the Stranger back end and get the detailed information of the analysis report, which could include the number of files, the vulnerabilities of each file, and the types of vulnerabilities. The application will generate the bee comb dynamically, piece by piece, based on the information in the XML file from the back end. Users. 治 政 transforms the single node in the XML file into a cell of the大 bee comb, and all of the visualized 立 can experience the analysis process by viewing the animation. In the other words, the application. objects will be shown on the big screen by the projector.. ‧ 國. 學 ‧. 4.2.1 Processing Graphic Inputs. sit. y. Nat. Stranger generates graphics in the dot format (Graphviz, 2013), which has been widely. io. er. adopted to illustrate flow graphs. Due to the requirement for representing dependency graphs in. al. Unity, we have to parse the dot file of the analysis results as XML. We developed a parser that. n. iv n C checks the nodes and the relations between in the dot file and transfers the information h e nnodes gchi U into the XML format so that the visualization tool can read it with the XML parser and instantiate visual objects. The dot file contains a large amount of information, so we have to filter and separate it. We collect the node name, shape, and each line of the label. If the node represents an input, the system will instantiate a node in the environment to represent the input node, which receives the user’s input value in the dependency graph, and we use the labels Condition and OnCondition to determine the relations of the nodes. If a node contains the label. 33.
(39) Condition:xxxx, it means that the node is a method that can be called for several times by other nodes. The dot graph uses an arrow to indicate the directions of nodes. When the edge contains a label, it will be placed between the [ ]. We record the start point as From and the end point as To, and there is a special label called EdgeLabel to record the label in the edge. We list the information in the table: in addition to Nodes and Edges, we make a Root list to inform Unity about which node is the root. The root node represents the tainted sink, which means it is the end. 治 政 大in Graphviz looks like the figure vulnerable input of the source code from the root. The root node 立 of the data on how and where the malicious behavior may happen. The system traces the. below.. ‧ 國. 學. We find every node and collect the nodes that are shaped as double octagons and that are. ‧. Condition nodes, and we make them into a list. Because a dot file does not tell the condition. Nat. sit. y. relationship, we need to develop an algorithm to build the relationship. We need to match the. n. al. er. io. Condition node and the OnCondition node. We already have the Condition node list at the step. i n U. v. where we make roots, so what we need to do is find which OnCondition node is matched to the. Ch. engchi. target Condition node. Just like with the Edge table, we use the attribute From to record the Condition node and the attribute To for the OnCondition node, but we also use an additional table to record the conditions. We parse all of the files as XML files and each dot file has four child nodes: Nodes, Edges, Roots, and Conditions. We pack all of a node's information into a node element, then append it under the nodes element list, with the roots being appended under Roots. If the file does not have a Condition, there will be a Non-condition attribute in the Conditionedges node.. 34.
(40) 立. 政 治 大. ‧. ‧ 國. 學 er. io. sit. y. Nat. Figure 17. The algorithm of generating interactive dependency graphs.. n. al. Ch. engchi. i n U. v. 4.2.2 Building Interactive Graphs In order to build a function-oriented graph-exploration view, we used a tree data structure to reconstruct the dependency graph. In addition, to instantiate visual nodes and link them to parent nodes with visual lines, we also linked the nodes by the pointer and made them the tree. After the doubly-linked tree is created, it is easy to access and modify the node and its. 35.
(41) information both in the visible aspect and invisible aspect such as broadcasting information of root nodes to every child node and adjusting the distance between two visual nodes. We developed the capability to trace the function call path based on the mechanism above, and users can move the focus forward and backward to check nodes in the dependency graph as shown in Fig. 15. When users move the focus forward and backward to explore the dependency graph, the visualization sends synchronization commands, and corresponding codes in the Websites are highlighted. By this capability, users can easily trace the source code without searching by the line number.. 立. 政 治 大. ‧. ‧ 國. 學. n. er. io. sit. y. Nat. al. Ch. i n U. v. Figure 18. The source code will be highlighted when the corresponded node is selected.. 4.3. engchi. App: The Mobile Application on the Client Side When users are not in front of their computers, they can view the analysis results through. the mobile application, as well as use features similar to those provided by the Website. Also, the mobile application can be the remote control for the visualizing tool. If users want to obtain further information about a file in a mobile app, they can use the mobile device to cooperate with the visualizing tool and enhance their comprehension of the file.. 36.
(42) We used Xcode as our IDE to develop the application on iOS devices because. By with Xcode we can easily manipulate the graphic user interface to get the contents diversifying presented. Also, frameworks provided by Xcode help us to easily handle the transmission of the data between the server- side and the client- sideWe receive an XML file from the server by sending an HTTP request to it. After receiving the XML file, we use the TBXML class, which was created by Tom Bradley on 10/21/2009, to parse the XML file into objects in Xcode. We pick out some attributes of the objects as our main contents to show on the front end and present these contents in a spontaneous way.. 立. 政 治 大. ‧. ‧ 國. 學. n. er. io. sit. y. Nat. al. Figure 19. Color themes of security status.. Ch. engchi. i n U. v. Users can not only view the contents from the server but also interact with it. They can touch some specific actions to send HTTP requests to the server, which might make some view changes on the other client side, such as personal computers. For example, a user can spin the view of a bee comb presented on a computer by just giving a scrolling gesture on an iPhone. As the first view of our app, users will see a table view (or a picker view) that lists the analyzed applications provided by the server, and they can pick one of them and touch the title to see information about the application. On this page, users can further pick one of the files in the. 37.
(43) picked application, and the vulnerabilities about the file will be shown on the following page. We use different background colors to allow users to directly feel the degree of vulnerabilities. As mentioned above, we use green as a safe sign, yellow as a warning sign, and red as a danger sign. The background of each page also uses the bee comb as a main idea to coincide with our topic.. 4.4. Integration of the Web Service, the Visualization Device, and the App Users may miss some information if they use only one of the front-end applications, but. 政 治 大. they could also lose the focus and feel frustrated when manipulating two front-end applications. 立. at the same time. In order to provide a better solution for viewing and patching their Web. ‧ 國. 學. applications, we connected the front-end applications together.. After developing the three front-end applications include website, visualizing tool and. ‧. app, we connected them so that we could take advantage of all of the front-end application and. y. Nat. io. sit. cover their shortcomings, thus improving the efficiency of viewing and patching source code.. n. al. er. The mobile app plays not only a data viewer role but also that of a remote controller. For. i n U. v. example, users can check analysis reports on mobile phones after uploading from laptop. Ch. engchi. computers. All the features of a Website are implemented on the app except the patching feature, so users can view the analysis report almost the same as on the Website. In addition to viewing the data, users can also interact with the visualization tool using the mobile app, which can be connected to the visualization tool and the back-end server dispatching the manipulation. When the user clicks one of the applications on the list, the visualization tool transforms the analysis report into a graph, and users can understand the security status of the whole target application by checking the graph. Users can also switch the target applications without any manipulations. 38.
(44) or typing inputs on the visualization tool, and if they want to drill down to check a single file, the visualization tool will zoom in to the file and show some brief information about the selected file. Each vulnerability has its dependency graph, which can be shown on the visualization tool through manipulating the app. By examining the dependency graph, users can trace the logic of the programs and do optimization and patching. However, they still need to switch to the code viewer to map the dependency node and source codes. To solve this problem, we connected the visualization tool to the Website. When users are tracing nodes of the dependency graph, the. 治 政 大comprehension. To enhance the trace source code very easily and improve the efficiency and 立. corresponding source codes are highlighted as well. Users can manipulate the visualization to. usability, we implemented the feature so that the Website can also do remote control of the app.. ‧ 國. 學. When users choose the application and dependency dot file, the visualizing tools show the bee. ‧. combs and dependency graphs as well.. We took the PHP Web application schoolmate as the example, as shown in Fig. 15. First,. y. Nat. er. io. sit. users can login and upload the application through the Website, then they can view the analysis result from the mobile app or the Website and launch the visualization tool. When users choose. n. al. Ch. i n U. v. the schoolmate application from the list, the visualization tool shows the status graph of. engchi. schoolmate, and users can realize that there are many vulnerable files in the schoolmate application that are not safe. Both the Website and the app provide the feature to view the vulnerable files, and users can drill down to exam vulnerabilities and patch codes. We chose the ManageClasses.php file to check its vulnerabilities and source codes. Users can click the Dependency Graph button on the Web page or the Graph button on the app to view the dependency graphs, which are generated from dot files.. 39.
(45) 立. 政 治 大. ‧ 國. 學. Figure 20. The integration of front-end applications.. ‧. We chose the vulnerability at line 304 of the ManageClasses.php file to check its. y. Nat. io. sit. dependency graph, and we found that it contains three input nodes (red node). We traced the. n. al. er. input node to the sink node and found that the main function concatenates many html markups. Ch. i n U. v. and input variables and prints them out on the client side. To secure the application, thesystem. engchi. has to filter the input variables because input variables may contain malicious scripts. Then the vulnerability is patched by attaching the patch code.. 40.
(46) 立. 政 治 大. ‧. ‧ 國. 學. n. er. io. sit. y. Nat. al. Ch. engchi. Figure 21. The sequence of visualization solution.. 41. i n U. v.
(47) CHAPTER 5 EVALUATION To evaluate our platform, we uploaded various open-source Web applications using Patcher. Table 2 summarizes the analysis results. There are ten applications that contain 3,055 files in total, and 2,895 of these were analyzed successfully in less than 4,000 sec (1.3 sec per file on average), with a success rate of about 95%. Within these applications, Patcher revealed 2,823 vulnerabilities, and most of them were previously unknown. As for the performance issue, Patcher took 1,343 sec to analyze the php-fusion-6-01-18 application and 993 sec to analyze moodle1_6, which had more files. 政 治 大 of php-fusion-6-01-18 had a larger number of nodes, which may have increased the time of the string 立 and vulnerabilities. We took a close look at the vulnerabilities and found that the dependency graphs. ‧ 國. 學. analysis to find vulnerabilities and generate patches. We also showed some graphic results, such as the examples below. In the application benchmarks, we found three vulnerable files (cells colored. ‧. yellow) that each had one vulnerability. The dependency graph of the second vulnerability is complicated due to various method calls and string operations. As for the bee comb of schoolmate,. y. Nat. er. io. sit. we can see that the application has high security risk, with half of its cells being colored red. While we were looking at the files, we found that most of their sensitive functions directly utilized users’. al. n inputs without any sanitization.. Ch. engchi. i n U. v. In sum, the preliminary results showed that Patcher is capable of analyzing large-size Web applications and revealing previously unknown as well as known vulnerabilities, then creating effective patches to prevent the vulnerabilities from being exploited. The visualization tool also enhances our understanding of program risks and structures.. 42.
(48) 立. 政 治 大. ‧. ‧ 國. 學. Table 2. The Results of Analysis. n. er. io. sit. y. Nat. al. Ch. engchi. i n U. Figure 22. The bee comb and dependency graphs of schoolmate.. 43. v.
(49) 政 治 大. Figure 23.The bee comb and dependency graphs of benchmark.. 立. ‧. ‧ 國. 學. n. er. io. sit. y. Nat. al. Ch. engchi. i n U. v. Figure 24. The bee comb and dependency graphs of smalldata.. 44.
(50) 學. ‧ 國. 立. 政 治 大. Figure 25.The bee comb of market.. ‧. n. er. io. sit. y. Nat. al. Ch. engchi. 45. i n U. v.
(51) CHAPTER 6 CONCLUSION 6.1. Conclusion We have presented a new Web service and platform for patching Web application. vulnerabilities online. We adopted automata-based symbolic string analysis to perform static analysis on Web applications, detecting potentially severe, string-related vulnerabilities and generating effective patches. We also incorporated advanced visualization and mobile techniques to enhance the. 政 治 大 viewed at different abstraction 立 levels, presenting only the information needed. We design our service usability and program comprehension. Along with vivid graphics, analysis results can be. ‧ 國. 學. abstraction levels based on the feature of our system and previous research. The loosely-coupled structure of the abstraction level makes it very easy to develop or modify the front end applications. ‧. and the middleware. Our system present four levels through three front end applications included the. sit. y. Nat. website, the app and the visualization tool. Our tool can fulfill various demands of people by. io. er. presenting multiple levels with front end applications. Users in different occupation can check parts of the analysis result based on their requirement. Managers of IT departments can check the system. n. al. Ch. i n U. v. level to evaluate the security status of an entire application and make quick decisions, and engineers. engchi. can modify and patch source code by viewing vulnerabilities in more detailed files and source code levels. It is also a useful tool help people communicate when working to solve problems with colleagues. There are few security tools which integrate visualization though lots of researchers work on program visualization. We believe this tool can help people a lot when developing and maintaining the web application.. 46.
(52) 6.2. Ongoing Work. One of our ongoing projects is to make the web service open to the public. We currently work on scaling up the backend system so that it can analyze web applications which are more complicated. The analyzer will be deployed on the cloud server for load balance and leveraging the service level. By analyzing complicated web application, we can collect more data and improve the representation of the front end applications. We plan to dig out more analysis data. 政 治 大 between the files of target applications. The service could be enhanced by integrating more 立 from back-end servers. With more data, we can provide users with more aspects of the relations. ‧ 國. 學. visualization tools such as Dashboard with bar charts so users can choose their preferred display view. Finally, we plan to enhance the graphic visualization with Unity. One direction would be. ‧. to integrate 3D visualization to present complicated flow graphs with conditions and display. sit. y. Nat. more information in the visualization tool. And the algorithm will be improved for representing. io. er. more complicate dependency graphs. Our system represents one bee comb in the recent version. al. but there are still lots of space we can facilitate for the visualization. We will try to represent. n. iv n C multiple bee combs in the 3D environment users can switch the angle to view different web h eand ngchi U applications. Also there will be more abstraction levels can be represented in the visualization so. that we can provide user more aspects to examine the vulnerabilities. To fulfill the demand of users and improve our tool, it is necessary to collect the feedbacks of users from different position in the enterprise. Our goal is integrating several techniques and transforming them into a user-oriented solution so that people can use this solution to solve the tough problems.. References 47.
(53) [1] Hamed Ahmadi and Jun Kong. User-centric adaptation of Web information for small screens. Journal of Visual Languages and Computing ,Vol.23, No.1,pages 13-28, 2012. [2] Johannes Bohnet and Jürgen Döllner. Visual exploration of function call graphs for feature location in complex software systems. In Proc. of the ACM 2006 Symposium on Software Visualization, SOFTVIS '06, pages 95-104, Brighton, UK, September 4-5, 2006. [3] Johannes Bohnet, Stefan Voigt, and Jürgen Döllner. Locating and understanding features of complex software systems by synchronizing time-, collaboration- and code-focused views on. 治 政 ICPC '08, pages 268-271, Amsterdam, The Netherlands, June大 10-13, 2008. 立. execution traces. In Proc. of the 16th IEEE International Conference on Program Comprehension,. [4] Manuel Costa, Miguel Castro, Lidong Zhou, Lintao Zhang, and Marcus Peinado. Bouncer:. ‧ 國. 學. securing software by blocking bad input. In Proc. of the 21st ACM Symposium on Operating. 2007.. ‧. Systems Principles, SOSP '07, pages 117-130, Stevenson, Washington, USA, October 14-17,. y. Nat. er. io. sit. [5] Aske Simon Christensen, Anders Møller, and Michael I. Schwartzbach. Precise analysis of string expressions. In Proc. of the 10th International Static Analysis Symposium, SAS '03, pages. n. al. Ch. 1-18, San Diego, CA, USA, June 11-13, 2003.. engchi. i n U. v. [6] Kunrong Chen and Vaclav Rajlich. RIPPLES: Tool for Change in Legacy Software. In Proc. of the IEEE International Conference on Software Maintenance, ICSM '01 pages 230-239, Florence, Italy, November 6-10, 2001.. [7] Tsung-Hsiang Chang, Tom Yeh, and Rob Miller. Associating the visual representation of user interfaces with their internal structures and metadata. In Proc. of the 24th Annual ACM. 48.
(54) Symposium on User Interface Software and Technology, UIST '11, pages 245-256, Santa Barbara, CA, USA, October 16-19, 2011. [8] Pierre Dragicevic, Stéphane Huot, and Fanny Chevalier. Gliimpse:Animating from markup code to rendered documents and vice versa. In Proc. of the 24th annual ACM symposium on User interface software and technology, UIST '11, pages 245-256, Santa Barbara, CA, USA, October 16-19, 2011. [9] Xiang Fu, Xin Lu, Boris Peltsverger, Shijun Chen, Kai Qian, and Lixin Tao. A static analysis. 治 政 大'07, pages 87-96, Beijing, China, , Computer Software and Applications Conference, COMPSAC 立 framework for detecting sql injection vulnerabilities. In Proc. of the 31st Annual International. July 24-2, 2007.. ‧ 國. 學. [10] gotoAndPlay(). Smartfoxserver @ONLINE, http://www.smartfoxserver.com/. Jan. 2013.. ‧. [11] David Grove, Greg DeFouw, Jeffrey Dean ,and Craig Chambers. Call Graph Construction in Object-Oriented Languages. In Proc. of the 1997 ACM SIGPLAN Conference on Object-. y. Nat. er. io. sit. Oriented Programming Systems, Languages Applications, OOPSLA '97, pages 108-124, Atlanta, Georgia, USA, October 5-9, 1997.. n. al. Ch. i n U. v. [12] Paul A. Gross and Caitlin Kelleher. Non-programmers identifying functionality in. engchi. unfamiliar code: strategies and barriers. Journal of Visual Languages and Computing, Vol. 21 No. 5, pages263-276, December 2010. [13] Susan L. Graham, Peter B. Kessler, and Marshall K. McKusick. gprof: a call graph execution profiler. In Proc. of the SIGPLAN Symposium on Compiler Construction, SIGPLAN '82, pages 120-126, Boston, Massachusetts, USA, June 23-25, 1982.. 49.
(55) [14]Carl Gould, Zhendong Su and Premkumar Devanbu. Static checking of dynamically generated queries in database applications. In Proc. of the 26th International Conference on Software Engineering, ICSE '04, pages 645-654, Edinburgh, United Kingdom, May 23-28, 2004. [15] Paul A. Gross, Jennifer Yang, and Caitlin Kelleher. Dinah: an interface to assist nonprogrammers with selecting program code causing graphical output. In Proc. of the International Conference on Human Factors in Computing Systems, CHI '11, pages 3397-3400, Vancouver, BC, Canada, May 7-12, 2011.. 治 政 embedded system for universal interactions. In Proc. of the大 10th IEEE International Workshop 立. [16] Liviu Iftode, Cristian Borcea, Nishkam Ravi, Porlin Kang, and Peng Zhou. Smart phone: An. on Future Trends of Distributed Computing Systems FTDCS '04, pages 88-94, Suzhou, China,. ‧ 國. 學. May 26-28, 2004.. ‧. [17] James A. Jones, Mary Jean Harrold and John Stasko. Visualization of test information to assist fault localization. In Proc. of the 24th International Conference on Software Engineering,. er. io. sit. y. Nat. ICSE '02, pages 467-477, New York, NY, USA, May 19-25, 2002.. [18] Adam Kiezun, Vijay Ganesh, Philip J. Guo, Pieter Hooimeijer and Michael D. Ernst. Hampi:. n. al. Ch. i n U. v. a solver for string constraints. In Proc. of the 18th International Symposium on Software Testing. engchi. and Analysis ,ISSTA '09, pages 105-116, Chicago, IL, USA, July 19-23, 2009 [19] Thorsten Karrer, Jan-Peter Krämer, Jonathan Diehl, Björn Hartmann and Jan Borchers. Stacksplorer: call graph navigation helps increasing code maintenance efficiency. In Proc. of the 24th annual ACM symposium on User interface software and technology, UIST '11, pages 217224, New York, NY, USA, October 16-19, 2011.. 50.
數據

+7
相關文件
You are given the wavelength and total energy of a light pulse and asked to find the number of photons it
Wang, Solving pseudomonotone variational inequalities and pseudocon- vex optimization problems using the projection neural network, IEEE Transactions on Neural Networks 17
volume suppressed mass: (TeV) 2 /M P ∼ 10 −4 eV → mm range can be experimentally tested for any number of extra dimensions - Light U(1) gauge bosons: no derivative couplings. =>
We explicitly saw the dimensional reason for the occurrence of the magnetic catalysis on the basis of the scaling argument. However, the precise form of gap depends
incapable to extract any quantities from QCD, nor to tackle the most interesting physics, namely, the spontaneously chiral symmetry breaking and the color confinement..
• Formation of massive primordial stars as origin of objects in the early universe. • Supernova explosions might be visible to the most
Miroslav Fiedler, Praha, Algebraic connectivity of graphs, Czechoslovak Mathematical Journal 23 (98) 1973,
The difference resulted from the co- existence of two kinds of words in Buddhist scriptures a foreign words in which di- syllabic words are dominant, and most of them are the
