國
立
交
通
大
學
管理科學系
碩 士 論 文
性別與風險忍受程度對銷售人員幫助行為意願的影響
The Effects of Gender and Risk Tolerance on Sales
Helping Behavior Intention
研 究 生:林崇孝
指導教授:張家齊 博士
性別與風險忍受程度對銷售人員幫助行為意願的影響
The effects of Gender and Risk Tolerance on Sales Helping
Behavior Intention
研 究 生:林崇孝 Student:Chung-Hsiao Lin
指導教授:張家齊 Advisor:Chia-Chi Chang
國 立 交 通 大 學
管 理 科 學 系
碩 士 論 文
A ThesisSubmitted to Department of Management Science College of Management
National Chiao Tung University in partial Fulfillment of the Requirements
for the Degree of Master
in
Management Science June 2006
Hsinchu, Taiwan, Republic of China
性別與風險忍受程度對銷售人員幫助行為意願的影響
學生:林崇孝 指導教授:張家齊 博士
國立交通大學管理科學系碩士班
中文摘要
本研究主要探討銷售人員在沒有報酬、沒有額外補償的情況之
下,基於何種原因願意付出心力幫助顧客。本研究以性別及銷售人員
對於產品風險忍受程度的差異作為自變數,探討對應變數「銷售人員
幫助行為意願」的影響;亦即男女銷售人員是否基於相同的動機幫助
顧客?能夠忍受風險程度較高的銷售人員是否較願意幫助顧客?此
處的風險忍受程度以銷售人員對於新產品促銷的意願為衡量標準,因
為過去文獻指出:對於促銷未知新產品意願較高的銷售人員,即擁有
較高的風險忍受程度。
本研究以迴歸分析作為主要的測量方法,搭配
ANOVA、LSD 分
析人口統計資料對應變數間的影響。結果顯示性別對於銷售人員幫助
行為意願的影響極小,而風險忍受程度則有顯著的影響,詳細的原因
則列於內文中。本研究分析結果能提供銷售主管作為日後訓練銷售人
員的方向;也提供有志成為超級銷售員的讀者一個努力目標。
關鍵字:銷售人員、銷售人員幫助行為、性別、風險忍受程
度
T
he Effects of Gender and Risk Tolerance on Sales Helping Behavior
Intention
Student:Chung-Hsiao Lin
Advisors:Dr. Chia-Chi Chang
Department of Management Science
National Chiao Tung University
ABSTRACT
This essay focuses on the importance of a Salesperson Helping Behavior under specific situations, for example no rewards, no extra bonuses. Does GENDER or RISK TOLERANCE influence Sales Helping Behavior Intentions? In other words, will a risk-loving salesperson do more SHB compared to a risk-averting one? Furthermore, what is the connection between gender and risk tolerance? The risk tolerance is defined as willingness to accept new product launching. Prior researches indicate that salespeople who are willing to do more new product promotions have higher risk tolerance.
This study uses regression analysis to discover the relationships among variables. By ANOVA and LSD comparison method, it explores the relations between demographics and variables. The results show that gender has minor influence on Sales Helping Behavior Intention, but risk tolerance has a distinctive influence. The explanations are listed in the content. The result provides sales managers with an orientation to train salespeople. Furthermore, it also provides new ideas for those who want to be super salespeople.
Key Words: Salespeople, Sales Helping Behavior, Gender,
Risk Tolerance
誌 謝 辭
「做學問,需學問;只求答,非學問」,在碩士班就讀的兩年裡,尤其是在 撰寫論文的這一年中,深深的體會了大學時代啟蒙老師在我們初為新鮮人時說過 的這句話。沒有真正地流汗插秧,怎能感受嘴嚼米飯時的那股喜悅;同樣地真正 踏實地做了一篇研究,才能了解學術的浩瀚與無窮。在新竹的第兩千一百個日 子,有幸能從交大完成了碩士的訓練,在完成最後階段的同時,憶起六年前乍到 風城的青澀模樣以及展翅欲飛的雄心壯志;兩千一百個日子過去後,知識的養 成、心態的成長、週遭景色的物換星移,在即將離開陪伴我人生最菁華時光的土 地當下,逕自地一一浮現在眼前。 家齊老師無疑是使我全力完成這篇研究的重要推手,除了當初洞悉我的個性 而引導我走入了此論文方向,「軟硬兼施」的手段更令我心悅誠服。在我輕蔑學 術的殿堂而想要偷懶打混時,老師會即時嚴厲地指正並灌輸我們應有的研究態 度;在我因為資料取得不易而喪失動力時,老師會輕拍我的肩膀適時鼓勵、耐心 指引相關的搜尋方向,為當時疲軟的鬥志注入了一股源源湧泉。從老師的身上, 能夠看到學術最踏實的一面,學習到研究該有的堅持與嚴謹;研究方法或變數也 許簡單,但該有的步驟一律按部就班,從細節操作中學習到的研究精神,對我而 言遠比研究結果來的重要!也很感謝口試期間王老師一針見血的意見,蕭老師有 條不紊地分析了我的研究不足,沈老師更是妙語如珠地緩和了當下緊張的氣氛, 並更進一步釐清了此篇研究概念上的盲點,由衷地謝謝四位老師使本篇研究更臻 完美! 登泰、佳誼兩位博班學長,更是替我治癒了此篇研究中統計方法的疑難雜 症,在我遇到棘手無法處理的問題時,與兩位學長的討論都能從中豁然開朗,兩 位學長為學嚴謹的態度、認真看待每一個問題的產生並不厭其煩地指導,更令我 佩服與尊敬,誠心地祝福兩位學長都能順利榮獲博士學位,將來在學術圈造福更 多的莘莘學子!同門師兄建中也扮演了舉足輕重的角色,透過經驗的分享與鼓 勵,讓我克服了許多研究上的恐懼與慌張,這種經驗傳承的風氣,希望在沒有秘 密的管科所也能一直延續下去! 在撰寫論文的這一年,每週固定的meeting 也是讓我成長的關鍵,藉由和老 師與同門成員毓貞、昭璇、MAX、青岳不斷地討論,激發了很多的點子與方向, 慢慢的才能將天馬行空的想法收斂成一篇學術研究,與大家共同 meeting 的日 子,有歡笑有緊張,大家也從討論中成長而順利地畢業,期待我們家齊幫的眾子 弟兵們,未來在各個領域都有很好的發展,再聚首時,已是各領域小有成就的核 心人物!同在109 研究室的同學們這一年來的互吐苦水與相互鼓勵,讓我在研究 煩悶之虞,也能很快的靜下心來思考解決之道;宗譽、宗霖、士軒三位好室友, 讓我在學生生涯的最後一年,再度重溫了愉快的宿舍生活,由衷地謝謝各位曾經 幫助過我的好同學們! 一篇論文從無到有,一己之力絕對無法完成,感謝在蒐集問卷期間,鼎力相助的文凱、伊君、Selena、龔經理、阿嬌,其中更要感謝老媽登高一呼,為兒子 奮力蒐集了三分之二的問卷,大大地解決了令我頭疼的樣本問題,此篇研究若有 一點學術上的貢獻,誠摯地獻給我的父母親與各位摯友!也感謝南部鄉親的大力 支持,你們熱情的填寫問卷且伴隨著超高的回收率,使我的研究更趨完備! 管科所是個有感情的地方,雖然位處博愛校區,平日像安養院寂靜無聲,假 日卻如運動場人聲鼎沸,但所辦就像是資訊集結中心,走入所辦可以很輕鬆地與 豪氣干雲的王姊交流八卦,也能與溫柔婉約的玉娟姐說說笑笑,兩位小姐對待我 們就如朋友般親切關心。撰文至此,王姊喜獲麟兒也個把月了,玉娟姐則將要初 嚐為人母的喜悅,即將離開所上之際,誠摯地祝福兩位姐姐的小孩都平安長大, 更謝謝他們兩年來課業及生活上的照顧;這裡不會是個過站,而是我永遠都感念 的溫馨有感情的地方! 風城的店家樓舖、草木樹影、人事土地,陪伴了我生命中菁華的六年,從當 初懵懂無知的少年蛻變為成熟穩重的男人,這裡有太多踏過的足跡與回憶,大學 時代的同學不少繼續攻讀博士,研究所的同學則多半進入職場發揮所學,無論在 學界或業界,相信大家一定會有一番不錯的成就,也盼我未來亦不負學校的栽 培,能將所學盡情發揮。最後,必須要感謝兩年來攜手共同奮鬥的女友,有她的 伴隨在側,生活多了重心與努力的目標,心態也變得更穩重踏實,屬於我們的日 誌仍會繼續寫下去。 人生道路上的貴人們,由衷地感謝你們伸手相助,此篇研究若有一絲貢獻與 榮耀,將是屬於你們的! 於博愛教學大樓109 研究室
Contents
Contents ...v
List of Tables...vii
List of Figures ... viii
Chapter 1 Introduction ...1
1.1 Research Motivation & Background ...1
1.2 Research objectives...2
1.3 Thesis structure ...2
Chapter 2 Literature Review...4
2.1 Variables description...4
2.1.1 Dependent Variable...4
2.1.1.1 Sales Helping Behavior...4
2.1.2 Independent Variable ...8
2.1.2.1 Gender...8
2.1.2.2 Risk Tolerance...14
2.2 Relations between Variables ...18
Chapter 3 Research Methodology...24
3.1 Sample Selection...24
3.1.1 Subjects of Research ...24
3.1.2 Sampling Method...25
3.2 Questionnaire Design...25
3.3 The Operational Definition and Measure of Variables ...25
3.3.1 Dependent and Independent Variables...25
3.3.2 Demographics ...26
3.4 Analytic Methods...26
3.4.1 Descriptive Statistics...26
3.4.2 Reliability and Validity Analysis ...27
3.4.3 ANOVA and LSD of Multiple Comparisons ...27
3.4.4 Pearson’s Product-moment Correlation Analysis ...27
3.4.5 Regression Analysis ...28
3.4.6 Mediation Analysis ...28
Chapter 4 Data Analysis...29
4.1 Samples and Descriptive Analysis ...29
4.2 The Reliability and Validity of Variables ...31
4.2.1 Sales Helping Behavior Items...31
4.3 The ANOVA and Multiple Comparisons of Independent Variables ...34
and Demographic Variables...34
4.3.1 Gender...34
4.3.2 Demographic variablesⅠ: ...35
Marriage status, Industry, Educational level, Seniority, Job position, Age .35 4.3.3 Demographic variables Ⅱ: Monthly salary, Monthly bonus percentage, ...40
Past growing experience, Working location, Major customer ...40
4.3.4 Demographic variables comparison...43
4.4 Correlation Analysis...43 4.5 Regression Analysis...44 4.5.1 Y=SHB ; X=Gender...44 4.5.2 Y= SHB ; X=Risk Tolerance...46 4.5.3 Moderation Analysis ...47 4.6 Mediation Analysis ...49 4.7 Model-fit Evaluation...50 Chapter 5 Conclusions ...56 5.1 Discussions ...56 5.2 Managerial Implications ...57
5.3 Limitations of This Research ...58
5.4 Further Suggestions ...59
Reference ...61
Appendix 1 Chinese Questionnaire ...66
Appendix 2 English Questionnaire ...69
List of Tables
Table 2.1 Sales Force Gender Studies...11
Table 2.2 Literature Summary on Gender Difference on Sales Performances ...13
Table 2.3 Descriptions of Types of Perceived Risk ...15
Table 3.1 Subjects’ Industries & Sample Size ...25
Table 4.1 The Distribution of the Demographics...31
Table 4.2 SHB Items’ Mean, Std. Deviation, Reliability and Factor Loading...33
Table 4.3 Risk Tolerance Items’ Mean, Std. Deviation, Reliability and Factor Loading ...34
Table 4.4 The ANOVA of the Gender Variable...35
Table 4.5 The ANOVA of the Marriage Status Variable ...35
Table 4.6 The ANOVA of the Industry Variable ...36
Table 4.7 The ANOVA of the Educational Level Variable ...37
Table 4.8 The ANOVA of the Seniority Variable...37
Table 4.9 The ANOVA of the Job Position Variable...38
Table 4.10 The ANOVA of the Age Variable ...39
Table 4.11 The ANOVA of the Monthly Salary Variable...40
Table 4.12 The ANOVA of the Monthly Bonus Percentage Variable ...41
Table 4.13 The ANOVA of the Past Growing Experience Variable...41
Table 4.14 The ANOVA of the Working Location Variable...42
Table 4.15 The ANOVA of the Customer Segment Variable ...42
Table 4.16 Comparisons of Demographics...43
Table 4.17 Correlation Table...44
Table 4.18 Regression Analysis of Gender ...45
Table 4.19 Coefficients of Gender ...45
Table 4.20 Regression Analysis of Risk Tolerance...46
Table 4.21 Coefficients of Risk Tolerance...46
Table 4.22 Regression Analysis of Empathy ...47
Table 4.23 Change Statistics of Empathy ...48
Table 4.24 Regression Analysis of Moral Reasoning ...48
Table 4.25 Change Statistics of Moral Reasoning ...48
Table 4.26 Coefficients of Full Model ...49
Table 4.27 Multi-Sample CFA Analysis ...51
Table 4.28 Multi-Sample Individual CFA Analysis ...52
Table 4.29 Inter-Item Correlation Matrix ...54
List of Figures
Fig 1.1 Research Flows...3
Fig. 2.1 Classification Scheme Based on Gender Mix ...12
Fig. 2.2 Risk Management Cycle...17
Fig. 2.3 Research Concept ...22
Fig. 2.4 Risk Tolerance as a Mediator Variable ...23
Fig. 4.1 Path Analysis Parameters...50
Fig. 4.2 Path Diagram of CFA Model ...53
Chapter 1 Introduction
In the beginning of this chapter, I would like to tell how Sales Helping Behavior begin in research motivation and background. In the second part, I will identify the research objectives and lastly I will structure the overview of the essay through the use of figures.
1.1 Research Motivation & Background
First of all, I am going to define the term「Helping Behavior」. Helping behavior may take many forms, from the trivial (giving directions to a stranger who is lost) to the magnificent (risking your life to save a drowning victim) (Bendapudi, Singh, and Bendapudi, 1996).「Sales Helping Behavior (SHB) 」, which includes the notion of sales, occurs when a salesperson will provide help to customers. The purpose of the helping behavior may differ from one salesperson to another. This study focuses on the importance of salesperson helping behavior under specific situations, such as new product launching. Does GENDER or RISK TOLERANCE influence Sales Helping Behavior? In other words, will a risk-loving salesperson do more SHB compared to a risk-avertering one? Furthermore, what is the connection between gender and risk tolerance?
To increase sales is a constant preoccupation of companies today. Customers want to get help if they need it and may be influenced by salespeople’s helping behavior. How to enhance SHB from salesperson is also a major problem. This essay will present some ideas about gender, risk tolerance, and Sales Helping Behavior intentions. The connections between these factors will also be discussed in the following chapters.
1.2 Research objectives
Only few attempts have been made so far to study SHB, as there are many factors involved. I would like to focus on gender and risk tolerance. Take gender for example, male and female salespeople will take different actions to sell the new products. Another factor to consider is that male or female risk-lover may take more care about the new products than a male or female risk-averter. Therefore, the objectives of this thesis are:
A. Find out the variables (gender and risk tolerance) involving degree to SHB. B. Find out the connection between gender and risk tolerance.
C. Find out whether new products or established ones will lead to dissimilar SHB. For these objectives, I will express these connections by a figure in the following section.
1.3 Thesis structure
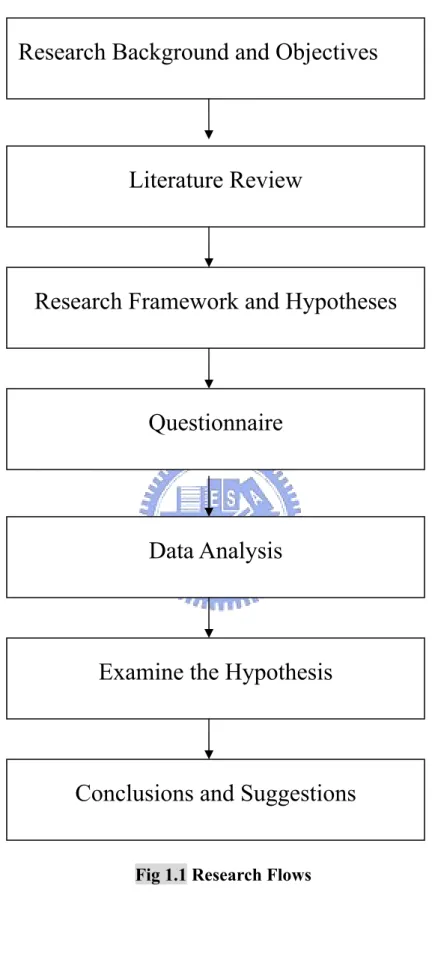
The research is structured in five chapters as illustrated in fig. 1.1. An overview of the research objectives is presented in chapter two.
Chapter 1 introduces background of the research. Next, the literature review includes content, variable descriptions, the logic of the research and hypotheses. The third chapter will be the hypotheses building and research methodology. Following is the fourth chapter with data analysis and discussions. Finally, the last chapter reveals the conclusions and suggestions for further research.
Fig 1.1 Research Flows
Literature Review
Research Framework and Hypotheses
Questionnaire
Research Background and Objectives
Data Analysis
Examine the Hypothesis
Chapter 2 Literature Review
This chapter may be divided into two groups. The first part is based on variable description and definition, including risk tolerance, gender, and Sales Helping Behavior. The other group is about the correlations between these variables and logic of the paper. Please take notice that I will briefly state the hypotheses in the second part.
2.1 Variables description
2.1.1 Dependent Variable
2.1.1.1 Sales Helping Behavior
Variables in this study can be classified into two categories: independent and dependent. On the independent variable side, gender and risk tolerance are considered. The dependent variable is hereby Sales Helping Behavior (SHB).Brief and Motowidlo (1986), identified 13 specific kinds of prosocial organizational behavior. Two of them are stated as follows: “providing services or products to consumer in organizationally inconsistent ways”; “helping consumers with personal matters unrelated to organizational services or products”. According to the authors, prosocial organizational behavior is a specific behavior that is expected to benefit a person. It is performed by individuals, groups, or organizations. George (1991) also mentioned that prosocial behaviors are helping behaviors; they are performed to benefit or help another individual. Moreover, there were two forms of prosocial behavior investigated (George, 1991):
1. Extrarole prosocial behavior: The concept is similar to Altruism and the items of this scale are like”suggest helping a specific other person with work-related problem”, “assists me with my duties” and “helps others when their work load increases.”
2. Role-prescribed prosocial behavior: It was defined as customer-service behavior, or prosocial behavior directed at customers. A sample item is “informs a customer of the important features of an item.”
As described above, SHB is one kind of prosocial organizational behavior. It mainly describes how salesmen or saleswomen help customers with product-unrelated problems. However, SHB is also similar to organizational citizen behavior. Wright (1996) mentioned in her dissertation that Organ (1988) expanded the taxonomy of organizational citizen behavior from two to five groups. One of the groups is altruism, which is a similar concept to SHB.
There are many factors influencing prosocial organizational behavior. Moods are usually mentioned among them. George (2000) said, “Moods and emotions play a central role in cognitive processes and behavior.” Piliavin and Charng (1990) also mentioned that a positive mood promotes helpfulness. “People in a good mood may perceive things in a more positive way and may increase positive cognitions” (Piliavin and Charng, 1990). As a result, they become more likely to perform acts associated with positive affect, such as helping behavior (Brief and Motowildo, 1986). Positive mood at work does support prosocial organizational behaviors and they are reciprocally related. Individuals who experienced positive moods at work were more likely to engage in both role-prescribed (customer service) and extrarole (altruism) forms of prosocial behavior (George, 1991).
However, do negative moods always decrease prosocial behavior? Clark and Isen (1982) say no and suggest that negative moods sometimes increase prosocial behavior.
Some scholars argued that helping others is sometimes seen as a way to evaluate one’s mood. Mainly unhappy people sometimes try to engage in prosocial behavior because it can make them feel better (Brief and Motowidlo, 1986; Baumann, Cialdini, & Kenrick, 1981).
For example, when people are in positive moods their perceptions and evaluations are more likely to be favorable; they tend to remember more positive information. They are more self-assured, more likely to take credit for successes and avoid blame for failures, and are more helpful to others (George, 2000). Conversely, negative moods may foster derivative reasoning and more critical and comprehensive evaluations (George, 2000). In fact, George (1991) said that analysis of negative moods for prosocial behavior is still unclear and ambiguous. Since it can increase helpfulness, decrease helpfulness and be unrelated to helpfulness. A variety of explanations have been offered for these confusing results, which are reviewed by Carlson and Miller (1987).
There are some main points from preceding studies about SHB, such as:
1. There are several complementary explanations for why positive moods may facilitate salesperson helping behavior (George and Brief, 1992).
2. Being in a positive mood is likely to result in a salesperson perceiving customers, service and sales opportunities more positively than if the salesperson was not in a positive mood (George and Brief, 1992).
3. Positive moods recall positive material from memory (George, 1998). Recalling positive material from memory during a service encounter is likely to result in a salesperson having a more helpful, positive approach toward a customer and the provision of customer service.
Research has found that positive moods lead to people finding others more pleasant or appealing, and when a help giver finds another person pleasant or
attractive, he or she is more likely to provide help (George, 1998). Above the explanation, how can salespeople promote positive moods? It is suggested that positive moods may be fostered by promoting a sense of competence, achievement, and meaning in the work place. This may be accomplished by providing rewards and recognition, keeping work group or team size relatively small, and the leader’s having a positive mood.
The general helping decision process involves four sequential steps: perception of need Î motivation Î behavior Î consequence (Bendapudi, Singh, & Bendapudi, 1996). These variables are all concerned about the helping behavior; therefore, they are related to SHB. I will put more effort on discussing motivation, since motivation of helping behavior may be egoistic, altruistic, or both. For egoistic purpose, the first category is to gain rewards for helping or avoid punishment for not helping (Cialdini et al., 1987). Second, the motivation is egoistic when it results in helping because the ultimate goal is to reduce the donor’s personal distress. For altruistic motivation, the ultimate goal is enhancing the welfare of the needy (Bendapudi, Singh, & Bendapudi, 1996), even at the expense of a person’s own welfare. There is an altruistic motivation behind prosocial behavior when empathy is aroused (Piliavin and Charng, 1990). The concept of Sales Helping Behavior is the same as altruism. Bar-Tal (1985-1986) notes that altruistic behavior includes following features: (a) must benefit another person, (b) must be performed voluntarily, (c) must be performed intentionally, (d) the benefit must be the goal itself, (e) must be performed without expecting any external reward. Organ (1988) also argues that the dimension of altruism includes “…all discretionary behaviors that have the effect of helping a specific other person with an organizationally relevant task or problem. Altruism is characterized as helping behavior, implying sensitivity, especially to one’s social environment” (Organ, 1988). All these features are related to SHB and will apply to
the questionnaire items. However, is there an altruistic personality? Piliavin et al. (1990) summarized a few regularities as: people high in self-esteem, high in competence, high in internal locus of control, low in need for approval, and high on moral development appear to be more likely to engage in prosocial behaviors (Piliavin and Charng, 1990).
Bystander effect is the best known situational effect in helping behavior. It is caused by diffusion of responsibility. In other words, when an individual believes that there is someone who can offer help, pressure to help the needy person is reduced. There is also an interesting phenomenon about helping behavior: a person receives more help when smiling. In other words, people provide more help when a stranger smiles all the times. In my opinion, I think if one gets help, others will think you are worthy to help. However, the one may get more help. Pleasant music and fragrant odor also has a positive effect on helping behavior.
There is one more variable that is important to helping behavior. It is trust (Jones, George, 1998). Customers tend to receive more help from salespeople who are worthy to trust.
2.1.2 Independent Variable
2.1.2.1 Gender
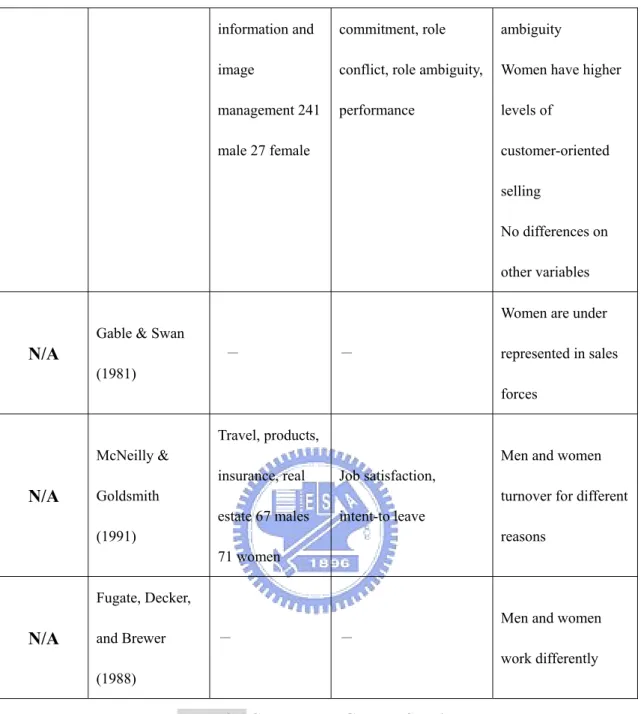
Some studies measure the gender difference in field sales organizations. Table 2.1 shows these studies and primary results as follows:
No. Study(Year) Sample (Industry) Primary Variables Primary Results A
Busch & Bush (1978) Pharmaceuticals 438 male 39 female Job satisfaction, Values, role clarity, performance, propensity to leave
Women lower in role clarity.
Men had higher propensity to leave. Men emphasize promotion more. Women emphasize co-workers. No differences job satisfaction and value. B
Brief & Oliver (1976) Retail sales Organizational and organizational level No difference C
Gibson & Swan (1981) Real estate 59 males and 54 females Job rewards, aspiration No differences in gender for expectations of success. Men had higher aspirations. D Swan, Futrell, and Todd (1978) Pharmaceutical 396males and 35 females Job satisfaction, self-confidence, perceptions of management control,
Men and women differ in their views of the job.
career goals. greater importance for independence in their work.
E
Schul & Wren (1992) Pharmaceutical 72 men and 82 women Job satisfaction, organizational commitment, rewards, role stress, performance, supervisor, turnover intentions No differences in satisfaction, organizational commitment, role conflict, ambiguity, performance, supervising, significant differences in extrinsic rewards and turnover. F Strutton, Pelton, and Lumpkin (1995) Industrial organization 139 male 92 female
Ingratiation sales tactics
Males more likely to use ingratiation tactics G Russ & McNeilly (1995) Publishing 73 male 77female Organization commitment, job satisfaction, turnover intentions Differences for organizational commitment and turnover No differences in job satisfaction H Siguaw & Honeycutt Roster of the association for Job satisfaction, organizational
Women report lower conflict and
information and image
management 241 male 27 female
commitment, role conflict, role ambiguity, performance
ambiguity Women have higher levels of customer-oriented selling No differences on other variables N/A
Gable & Swan (1981)
- -
Women are under represented in sales forces N/A McNeilly & Goldsmith (1991) Travel, products, insurance, real estate 67 males 71 women Job satisfaction, intent-to leave
Men and women turnover for different reasons N/A Fugate, Decker, and Brewer (1988) - -
Men and women work differently
Table 2.1 Sales Force Gender Studies
Source: Moncrif, Babakus, Cravens, Johnston (2000)
In order to clarify the overall effect of these studies, four quadrants are drawn below. Quadrant 1 is considered to be the traditional cell with most of the historical studies from the 1970s and the 1980s falling into this area. In this situation, the sales force is dominated by males, as is the customer base. Prior studies to Table 2.1 have indicated that differences exist by gender in the sales force and, therefore, management must employ dissimilar strategies with their male versus female sales
forces (W. C. Moncief et al., 2000).
Quadrant 3 has a dominant female sales force and a female customer base. The assumption is that these managerial decisions are different based upon an abundance of female sales personnel and customers. The second and fourth quadrants are labeled uncertain because it is unknown how gender might be affected with a male sales force and a female customer base or vice versa (W. C. Moncief et al., 2000).
Fig. 2.1 Classification Scheme Based on Gender Mix A~H is mentioned as Table 2.1, and I=W. C. Moncrief et al. (2000)
Source: W. C. Moncrief et al. (2000)
By R. Y. Darmon et al. (2003), salesmen tend to give significantly more importance to promotion opportunities than saleswomen do; this might suggest that salesmen tend to be more career-oriented than saleswomen. According to this viewpoint, it is implied that males could have more risk tolerance than females when promoting risky products. Another factor to consider is that women prefer to visit
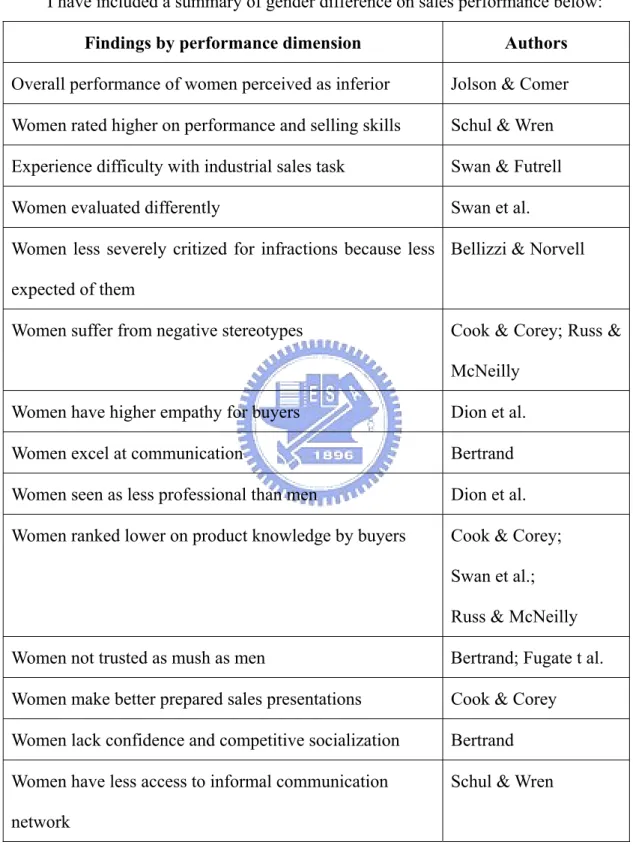
group customers whereas salesmen tend to prefer calling on individual customers, especially at the exploration and establishment stages (R. Y. Darmon et al., 2003). I have included a summary of gender difference on sales performance below:
Findings by performance dimension Authors Overall performance of women perceived as inferior Jolson & Comer Women rated higher on performance and selling skills Schul & Wren Experience difficulty with industrial sales task Swan & Futrell Women evaluated differently Swan et al. Women less severely critized for infractions because less
expected of them
Bellizzi & Norvell
Women suffer from negative stereotypes Cook & Corey; Russ & McNeilly
Women have higher empathy for buyers Dion et al. Women excel at communication Bertrand Women seen as less professional than men Dion et al. Women ranked lower on product knowledge by buyers Cook & Corey;
Swan et al.; Russ & McNeilly Women not trusted as mush as men Bertrand; Fugate t al. Women make better prepared sales presentations Cook & Corey Women lack confidence and competitive socialization Bertrand Women have less access to informal communication
network
Schul & Wren
Table 2.2 Literature Summary on Gender Difference on Sales Performances Source: Dion and Banting (2000)
As mentioned above, gender is a factor in performance evaluation. However, is gender a significant factor in performance evaluation? For buyer evaluation, they saw no significant differences in performance. In addition, the gender of the buyer made no difference in their judgment (Dion and Banting, 2000). These findings are contrary to some of the differences reported in the literature review in Table 2.2.
According to sales manager evaluation, when sales managers were subsampled by gender and were paired with salespeople of the same and different gender, the following differences were observed:
z Male managers viewed male salespeople as more adaptive in their selling practices and more satisfied (Dion and Banting, 2000).
z Female managers viewed female salespeople as more satisfied. Two other variables: overall performance and negotiation performance were close to statistical significance. However, the small number of female sales managers limited the acuity of statistical tests on the same (Dion and Banting, 2000).
2.1.2.2 Risk Tolerance
Since this research about SHB is an exploratory study, I explore an interesting variable, Risk Tolerance, to be my independent variable. I would like to know whether salespeople with higher risk tolerance will have more SHB intention. However, there is a well-known theory about risk in finance. It describes that people will invest different portfolios depending on their personality, such as risk lovers or risk averters. A risk lover is an investor who is willing to take on additional risk for an investment that has a low expected return. Conversely, a risk averter is an investor who is willing to maintain a stable investment that provides a stable return. Depending on the attitude to risk, I propose that the phenomena will be similar to the
Sales Helping Behavior. Although a large number of studies have been made on sales performance and helping behavior, little is known about risk tolerance influencing Sales Helping Behavior.
「Perceived Risk」 is a form of risk that has a long and varied research tradition.
I infer that the more perceived risk salespeople can tolerate, the more Sales Helping Behavior they will engage in. Peter and Ryan (1976) have modified the model about risk as follows:
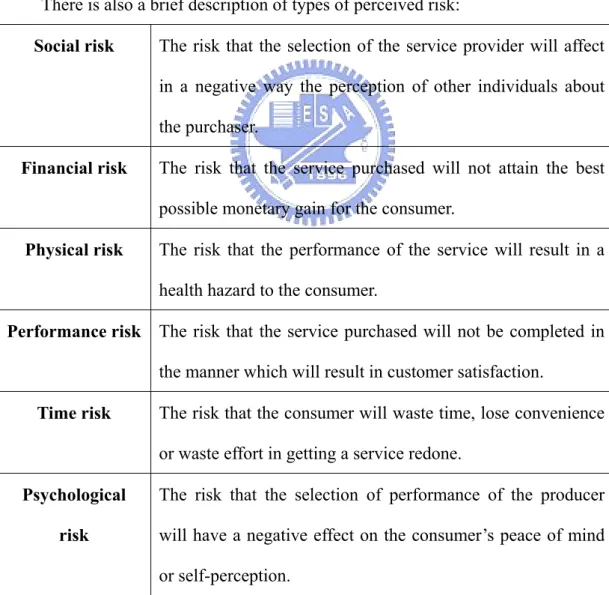
Risk= 『Probability of consequences occurring』× 『Negative consequences of poor brand choice』 There is also a brief description of types of perceived risk:
Social risk The risk that the selection of the service provider will affect in a negative way the perception of other individuals about the purchaser.
Financial risk The risk that the service purchased will not attain the best possible monetary gain for the consumer.
Physical risk The risk that the performance of the service will result in a health hazard to the consumer.
Performance risk The risk that the service purchased will not be completed in the manner which will result in customer satisfaction.
Time risk The risk that the consumer will waste time, lose convenience or waste effort in getting a service redone.
Psychological risk
The risk that the selection of performance of the producer will have a negative effect on the consumer’s peace of mind or self-perception.
Source: Mitchell (1992)
Perceived risk also has a part to play in all types of consumer buying behavior. Assael (1981) has suggested four types of perceived risk: the first is complex buying behavior, which is usually characterized by high involvement and there being significant differences between brands. The infrequent purchases and lack of product category knowledge will result in increased uncertainty. The second category is dissonance-reducing buying behavior, which is characterized by high involvement. After the purchase, the consumers attempt to reduce the risk of dissatisfaction by gathering information about the purchase, which is favorable and reinforces soundness of the initial purchase choice. The third is habitual buying behavior. It is characterized by low consumer involvement and low levels of brand difference. The interesting feature of this type of decision is that makers are constantly trying to move this type of product from a low involvement to higher involvement status. They do this by emphasizing the risks involved in the purchase. The last classification is variety seeking behavior. It is characterized by low consumer involvement, but significant brand differences. Typically, consumers will change their brand frequently not through dissatisfaction but through boredom.
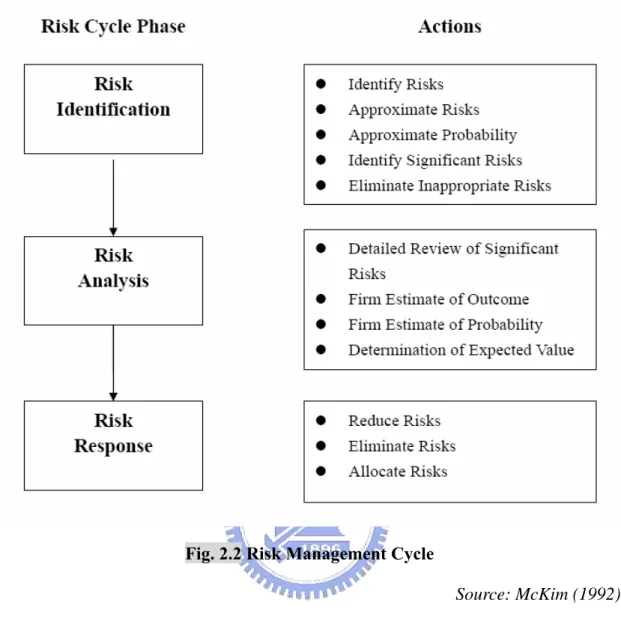
Faced with these perceived risks, consumers will follow five stages in decision making. These are: problem recognition, information research, evaluation of alternatives, purchase decision and post purchase behavior. Many project managers, who are faced with making decisions under risk will simply go with their gut feeling not wishing to trust their project to a simplified mathematical interpretation of a very complex situation (McKim, 1992). According to the risk, 「Risk management」is critical to decision making, as is the salesperson engaging in SHB. Risk management is a cyclical process with several distinct phases. Their relations are figured out as figure 2.2:
Fig. 2.2 Risk Management Cycle
Source: McKim (1992)
There is no magic solution to the management of risk. Like any other function in a project, the best approach is to have skilled and knowledgeable coworkers (McKim, 1992).
Age is also suggested to influence risk tolerance, however, findings are inconsistent. Grable & Lytton (1998) assume that older individuals have less time to recover losses than younger individuals; hence risk tolerance will decrease with age. On the other hand, according to Sung and Hanna (1996), the general pattern of age is that risk tolerance decreases with age after 45. According to this theory, risk tolerance exhibits a hump-shaped pattern. In other words, it increases with age and then
decreases. The inconsistency exists due to the lack of distinction between subjective and objective risk tolerance when research was conducted (Chang, 2001).
There are other factors reported to play an important role in determining risk tolerance. These include: income, education, demographic characteristics, and marital status. According to Roszkowski, Snelbecker, and Leimberg (1993), people are perceived to be more risk tolerant if they are white, male, older, unmarried, self-employed, professional, or have a higher level of income and education.
Before starting to discuss risk tolerance, we should know four risk concepts: propensity, attitude, capacity, and knowledge (Cordell, 2002). I modify the explanations defined by Cordell (2002) as follows: Risk propensity is the idea that salespeople can infer something about the customers’ attitude toward risk by reviewing the customers’ real-life decisions in buying situations. Risk attitude refers to the customers’ willingness to incur buying risk. Risk capacity refers to the customers’ financial ability to incur risk, starting with the customers’ age and family responsibilities. Finally, risk knowledge refers to the customers’ understanding of risk. Cordell (2002) concludes that if clients understand that their financial situation allows them to take greater risks; they will be more willing to do so. According to the conclusion, I would like to investigate whether the same effect will occur on salespeople.
2.2 Relations between Variables
In this thesis, the two independent variables, gender and risk tolerance, have impact on dependent variable: SHB; and the two independent variables also interact. In other words, both gender and risk have relations with Sales Helping Behavior. In this study, I will investigate the salespeople’s attitude towards new product promotion
by questionnaire. Then, I will determine which gender will have more risk tolerance and engage in more Sales Helping Behavior.
Harris and Bays (1973) found that both the gender of the person in need and the gender of the helper effect how much assistance is given. Some studies found that men are generally more helpful (Borofsky et al., 1971), while others indicate that women are more supportive (Wilson, 1975; Switzer et al., 1999). In these studies, men are generally more helpful in spontaneous situations that involve personal risk. Women, on the other hand, tend to assist more in long-term and close relationships. Eagly and Crowley (1986) point out that there are many ways in which one can help another. These include emotional support, action based help, and giving advice. Many of the previous studies overlooked this fact and chose to focus on one kind of helping behavior, which is not commonly exhibited by both sexes. Eagly and Crowley (1986) also contend that women are generally more empathic and sympathetic than men and are more likely to help others. Eisenberg et al. (1988) found that girls exhibited more facial sympathy and reported more distress than boys. Women report themselves to be more empathic than men do (Piliavan and Charng, 1990). Aries et al. (1983) also hold the same argument: women report providing their friends with more personal favors, emotional supports, and counseling about personal problems than men do (Piliavin and Charng, 1990).
By The relationship between sex differences and helping behavior of college
students (McCabe), the researchers conclude that men and women are equally helpful
when gender-bias is eliminated. While sex alone does not appear to affect how much help a person gives, one may wonder if gender plays any role in helping behavior? According to Eagly and Crowley (1986), most previous studies used situations that were biased towards the helping behavior of one of the sexes. The results of each study incorrectly claimed that one sex is more helpful than the other.
Previous studies about gender differences and performances resulted in different concern for customers. That is women have more 「communal goals」such as affiliation and fostering harmonious relationships, whereas males have 「agentic goals」, which stress goal orientation, self-assertion, and mastery (McColl-Kennedy, Daus, & Sparks, 2003). Furthermore, a related study (Sparks and Callan, 1997) found that women prefer an accommodating communication style more so than men. Part of accommodating involves listening to and understanding the customer, which can be considered as showing concern for the customer.
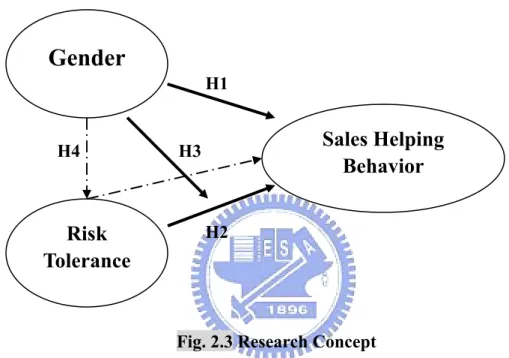
H1: Female salespeople tend to engage in more Sales Helping Behavior than male salespeople do
In addition to measuring the correlation between risk tolerance and Sales Helping Behavior, I would also like to find out the relation of risk tolerance and gender. In other words, are males more risk tolerant than females or vise versa? The risk here is pointed towards new products promotion. In general, salespeople consider that new products are more risky than established ones; customers are more aware of established products, and good established products are promoted through word-of-mouth. The leverage of a strong brand name can substantially reduce the risk of introducing a product on a new market by providing consumers the familiarity of, and knowledge about, an established brand (Aaker, Keller, 1990). General customers will choose to buy from them. Therefore, salespeople find it more difficult to promote new products to ordinary consumers.
Although salespeople have difficulty promoting new products, they are motivated to do so because new products have some advantages: first, these products are produced to satisfy someone who is in need. Next, these products will have added
more function or value to compete with the ordinary ones. Furthermore, a new product offers several advantages to the salesperson. It could open up new market and customer opportunities, and it offers new selling experiences that could enhance his/her skill base, earnings, and mobility. Furthermore, success at selling new products could enhance the personal value and reputation of the salesperson in the organization (Kwaku, 1997). These advantages will drive the risk-tolerant salespeople to promote new products.
H2: Salespeople with higher risk tolerance engage in more Sales Helping Behavior
Gender is extensively used as a moderator variable in marketing. In this thesis, I will try to find out what is the difference between H2 and H3 with gender being a moderator variable in H3. In financial decision making among gender difference, some previous studies suggest that women are more cautions, less confident, less aggressive, easier to persuade, and have inferior leadership and problem solving abilities when making decisions under risk compared to men. But recent studies argue against this conclusion. According to the paper written by Powell and Ansic (1997), they suggest males and females are found to be equally capable of performing in terms of achieving desired outcomes from decision-making under risk, equally effective in leadership roles, and equally capable of processing and reacting to information.
The strategy differences could be linked to risk preference through motivational theory (Schneider and Lopes, 1986). Females would have a lower risk preference if they have a greater desire for security, and males have a higher risk preference if they have a greater desire for returns. According to this model, males engage in more Sales
Helping Behavior under risk compared to females. The risk here is about lunching new product risk, perceived risk and so on.
H3: Males tend to engage in more Sales Helping Behavior under a risky condition than females do
Fig. 2.3 Research Concept H3 H2 H1 H4
Gender
Risk
Tolerance
Sales Helping
Behavior
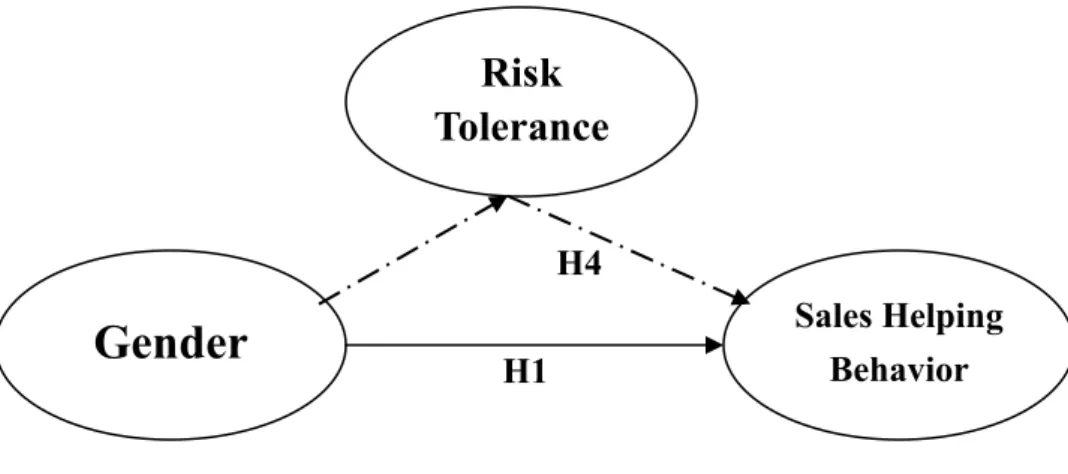
Fig. 2.4 Risk Tolerance as a Mediator Variable
H4: Risk tolerance mediates between Gender and Sales Helping Behavior.
The level of significance between Gender and Sales Helping Behavior should, therefore, be reduced.
Gender
Risk
Tolerance
Sales Helping Behavior H1 H4Chapter 3 Research Methodology
This chapter demonstrates how research is designed and conducted, including sampling, data collecting, and measurement. The chapter presents the research tools and methods applied in this thesis.
3.1 Sample Selection
3.1.1 Subjects of Research
This study primarily surveys how salespeople engage in SHB in different situations. Therefore, the subjects of research are salespeople. The gender of these salespeople, however, is also an independent variable in this study; I surveyed approximately the same amount male and female salespeople. The sample size is over 200, meeting the standard condition, and the questionnaire is conducted in both paper and online version.
There is no limitation of industries that salespeople engage in. Moreover, all kinds of industries are included. Chung and Ding (2002) mentioned in their SLCS essay: it is possible that different kinds of salespeople may generate a difference. The following table shows industry distribution of salespeople:
Industry Sample size
Life insurance 10
Finance 80 High-tech 14 Agency 10 Service 118
others 45
Total 277
Table 3.1 Subjects’ Industries & Sample Size
3.1.2 Sampling Method
As mentioned, the questionnaire was publicized in both paper and online version. The online vision was sited on http://www.my3q.com/home2/83/finmat/123456.phtml. The questionnaire was hosted from 13th March to31st March, 2006.
3.2 Questionnaire Design
The formal questionnaire was divided into three parts (Appendix 1 & 2). The first and second parts measure Sales Helping Behavior and risk tolerance. The last part concerns demographics and includes 12 items. According to the pretest result, I modified items in the second section to enhance the reliability and tried to make a better content validity. In the formal test, there were 16 items about SHB and 7 items about risk tolerance. Sales Helping Behavior items were mainly rewritten according to Wright’s (1996) dissertation. This dissertation had a scale for prosocial personality battery in appendix A. Moreover, risk tolerance items referred to Roszkowski, Davey, and Grable (2005). Some of the items were developed from experienced salespeople.
3.3 The Operational Definition and Measure of Variables
16 items are measured for the dependent variable-SHB and all of them are put in part one. 7 items are put in the second part for measuring one of the independent variables: risk tolerance. The other independent variable is gender, which we identified in the third part. All the items are measured by Likert 5 points scale; 1 signifies “Strongly disagree” and 5 denotes “Strongly agree”. The higher score each item receives, the more SHB salespeople are willing to engage in and the higher risk tolerance these salespeople possess.
3.3.2 Demographics
The demographics includes salespeople’s gender, marriage status, industry, educational level, seniority, monthly income, monthly bonus percentage, position in the company, age, growing history, customer segment and working location. There is a total of 12 items regarding personal information about the salespeople in the last part of the questionnaire.
3.4 Analytic Methods
The major analytic tool used in this study is statistic software SPSS 12.0 version. These statistic methods include descriptive statistics, reliability analysis, Pearson correlation and regression. I have also used ANOVA and Fisher’s Least Significant Difference of multiple comparisons to explore the demographics influencing Sales Helping Behavior and risk tolerance.
In order to understand the structure of salespeople’s Sales Helping Behavior, risk tolerance and personal information including gender, age, educational level…etc., I have used descriptive statistics to show the amounts, percentages, means and variances of these variables.
3.4.2 Reliability and Validity Analysis
The reliability analysis mainly used Cronbach’s α coefficient to test internal consistence of items. From pre-test to formal test, I deleted some lowαitems to ensure a reliable and qualified questionnaire. The reliabilities of Sales Helping Behavior are 0.663 for Empathy items and 0.837 for Moral Reasoning items. Besides, 0.766 is the reliability value for Risk Tolerance items. Moreover, factor analysis was used to test prior structure of variables and identify factors that statistically explain the variation and covariation among measures.
3.4.3 ANOVA and LSD of Multiple Comparisons
This study used the analysis of variance (ANOVA) and Fisher’s Least Significant Difference (LSD) of multiple comparisons to explore the demographic variables; which includes age, marital status, industry, educational level, seniority, job position, age, monthly salary, monthly bonus percentage, growing history, working location, and customer segment.
3.4.4 Pearson’s Product-moment Correlation Analysis
correlation coefficient of correlation matrix, it clearly indicated a positive or negative correlation between category variable (gender) and continuous variable (SHB & risk tolerance).
3.4.5 Regression Analysis
In order to analyze the relationships among gender, risk tolerance and Sales Helping Behavior, regression analysis was broadly used. The full regression model of this study is shown as follows:
Yi=α + β1(G) +β2(R) + β3(G×R) + εi
εi~ N (0, σ2), i= 1,……., n; n=277
Yi= Sales Helping Behavior G = Gender
R = Risk Tolerance
3.4.6 Mediation Analysis
According to the framework, risk tolerance may be a mediation variable between gender and Sales Helping Behavior. I have tested each simple regression standardized coefficient because mediated effect occurs when all path regression coefficients are significant. This will be explained in chapter 4.
Chapter 4 Data Analysis
This chapter mainly explains the research data from the questionnaires. All the methods introduced in chapter three are used here. First of all, the structure of samples can lead to an overall awareness of. The SHB and risk tolerance reliability and validity analysis are in the second part and the ANOVA tables of demographics will be shown later. Last but not least, regression analysis is used to test the hypotheses.
4.1 Samples and Descriptive Analysis
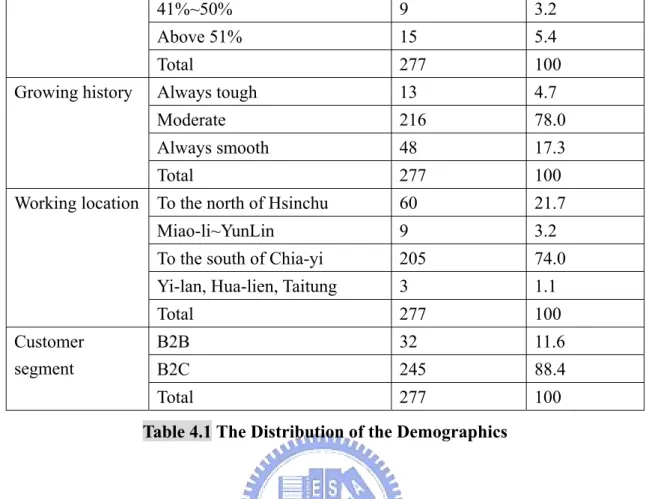
During March 13th to March 31st, 2006, the questionnaire was sited on both the Internet: http://www.my3q.com/home2/83/finmat/123456.phtml and paper vision to reach a wider variety of salespeople. There are 277 out of 281. All sample characteristics are listed in detail in the following table.
Characteristic Sample size Percent (%)
Male 101 36.5 Female 176 63.5 Gender Total 277 100 Single 127 45.8 0~2 children 119 43 Married Above 3 children 31 11.2 Marital status Total 277 100 Life-insurance 10 3.6 Financial 80 28.9 High-tech 14 5.1 Agency 10 3.6 Service 118 42.6 Others 45 16.2 Industry Total 277 100
Under junior high school 3 1.1 Education
University/College 145 52.3 Master 24 8.7 Ph.D 4 1.4 Total 277 100 Below 1 year 58 20.9 1~2 years 38 13.7 2~3 years 47 17.0 3~4 years 21 7.6 4~5 years 17 6.1 Above 5 years 96 34.7 Seniority Total 277 100 Self-employed 52 18.8 General employee 162 58.5 Manager 22 7.9 Consultant/advisor 4 1.4 Researcher 3 1.1 Others 34 12.3 Job position Total 277 100 Under 20 8 2.9 21~25 46 16.6 26~30 63 22.7 31~35 38 13.7 36~40 39 14.1 41~45 36 13.0 46~50 26 9.4 Above 51 21 7.6 Age Total 277 100 Less than 30000 85 30.7 30001~40000 88 31.8 40001~50000 54 19.5 50001~60000 24 8.7 More than 60000 26 9.4 Monthly salary (including bonus) Total 277 100 Below 10% 133 48.0 10%~20% 52 18.8 21%~30% 48 17.3 Monthly bonus percentage 31%~40% 20 7.2
41%~50% 9 3.2 Above 51% 15 5.4 Total 277 100 Always tough 13 4.7 Moderate 216 78.0 Always smooth 48 17.3 Growing history Total 277 100
To the north of Hsinchu 60 21.7
Miao-li~YunLin 9 3.2 To the south of Chia-yi 205 74.0
Yi-lan, Hua-lien, Taitung 3 1.1 Working location Total 277 100 B2B 32 11.6 B2C 245 88.4 Customer segment Total 277 100
Table 4.1 The Distribution of the Demographics
4.2 The Reliability and Validity of Variables
4.2.1 Sales Helping Behavior Items
In order to examine the internal consistency of each factor and make sure all the items have contributed to each factor, this study proceeds to use reliability analysis and exploratory factor analysis (EFA). Because the variables of Sales Helping Behavior and risk tolerance are new concepts, there are few relevant papers at present. Therefore, EFA applies more accurately to this study. Before doing EFA, KMO value should be checked (Kaiser-Meyer-Olkin measure of sampling adequacy). In this variable, KMO is 0.83, which is large enough to proceed to EFA. According to the rule of factor extraction, eigenvalues of each factor over 1 is extracted by principal component analysis and then proceeds to varimax rotation. After the rotation, factor
loading of each item below 0.5 and cross loading items would be deleted. All the items should be retested following the previous step. Finally, I found two components in Sales Helping Behavior (SHB) and only one component in Risk Tolerance. The two factors of SHB named by Wright’s dissertation are Empathy and Moral Reasoning.
Items Mean Std.
Deviation
Reliability Factor Loading Ⅰ、Sales Helping Behavior
Factor 1- Empathy items 1.1 When customers are nasty to me, I feel very little
responsibility to treat them well ®
3.14 1.120 0.648
1.2 I sometimes find it difficult to see things from customers’ point of view ®
3.25 1.041 0.697
1.3 Other customers’ purchase-related misfortunes do not usually disturb me a great deal ®
3.12 0.967 0.573
1.4 If I’m sure I’m right about something, I don’t waste much time listening to other customers’ arguments ®
3.35 1.019 0.795
1.5 When I see customers being treated unfairly, I sometimes don’t feel very much pity for them ®
3.50 1.062
0.663
0.674 Factor 2- Moral Reasoning items
1.8 When dealing with customers, I choose alternatives that are intended to meet customers’ needs
4.15 0.624
0.707 1.9 When dealing with customers, I choose a course of
action that maximizes the help other customers receive
4.24 0.666
0.783 1.10 When dealing with customers, I choose a course of
action that considers the rights of all customers involved
3.94 0.827
0.809 1.11 My decisions are usually based on concern for the
welfare of customers
3.82 0.823
0.767 1.12 When dealing with customers, I choose alternatives
that minimize the negative consequences to customers
4.02 0.807
0.837
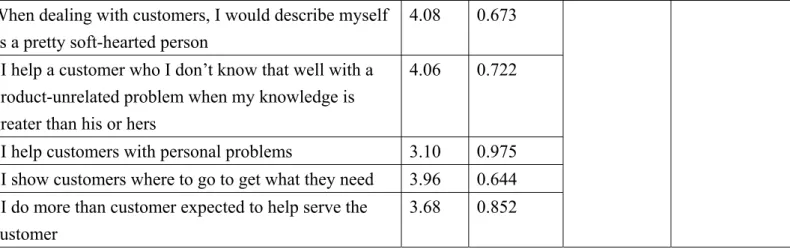
0.828 Other items
1.6 I would feel obligated to do a favor for customers who needed it, even though they had shown no gratitude for past favors
3.81 0.843 Deleted in the F.A
1.7 When dealing with customers, I would describe myself as a pretty soft-hearted person
4.08 0.673 1.13 I help a customer who I don’t know that well with a
product-unrelated problem when my knowledge is greater than his or hers
4.06 0.722
1.14 I help customers with personal problems 3.10 0.975 1.15 I show customers where to go to get what they need 3.96 0.644 1.16 I do more than customer expected to help serve the
customer
3.68 0.852 ® Denotes Reverse-Coded Item
Table 4.2 SHB Items’ Mean, Std. Deviation, Reliability and Factor Loading
4.2.2 Risk Tolerance Items
Purifying the risk tolerance items by EFA gets the following results: Risk Tolerance is the only major component among these items, there are some theories about financial risk tolerance, and there are fewer references about sales risk tolerance. Therefore, the scale developed by the definition of risk tolerance may provide sufficient ground for further research.
Items Mean Std.
Deviation
Reliability Factor Loading 2.2 I like to promote new products because it’s challenge. 3.74 0.789 0.720 2.3 I would spend my effort to study how to promote new
products, no matter what the products are hot in the future.
3.88 0.745
0.767 2.4 I will still promote products as usual even though I
don’t think many people will buy them.
3.87 0.652
0.811 2.5 I will still promote products as usual even though I
expect that customers will only buy a small number of products.
3.86 0.706
0.766
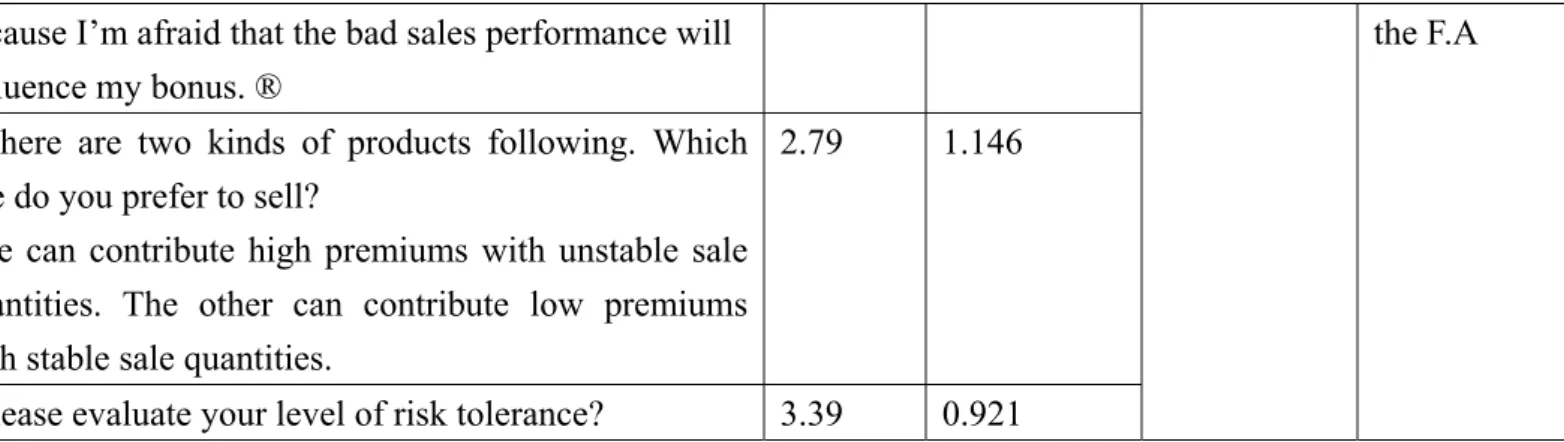
0.779 2.1 If possible, I will not actively promote new products 3.48 1.048 Deleted in
because I’m afraid that the bad sales performance will influence my bonus. ®
2.6 There are two kinds of products following. Which one do you prefer to sell?
One can contribute high premiums with unstable sale quantities. The other can contribute low premiums with stable sale quantities.
2.79 1.146
2.7 Please evaluate your level of risk tolerance? 3.39 0.921
the F.A
® Denotes Reverse-Coded Item
Table 4.3 Risk Tolerance Items’ Mean, Std. Deviation, Reliability and Factor Loading
4.3 The ANOVA and Multiple Comparisons of Independent Variables
and Demographic Variables
This section explores the demographic variables mentioned in 3.4 by analysis of variance (ANOVA) and Fisher’s Least Significant Difference (LSD).
4.3.1 Gender
There is no significant difference between male and female SHB and risk tolerance, as table 4.4 shown. The results indicate that gender might be a constant variable to these factors. Since gender is a dummy variable, two categories, it can not be examined by multiple comparison LSD method.
Gender Variables μ1 Male (n=101) μ2 Female (n=176) F value P value Empathy 3.309 3.262 0.272 0.603 SHB Moral reasoning 4.051 4.020 0.180 0.672
Risk Tolerance 3.878 3.817 0.776 0.379 Table 4.4 The ANOVA of the Gender Variable
4.3.2 Demographic variablesⅠ:
Marriage status, Industry, Educational level, Seniority, Job position, Age
As table 4.5 has shown, empathy has significant difference between married and single salespeople. Married salespeople have higher empathy than single adults and may engage in more Sales Helping Behavior. The explanation may be that married salespeople have duty to take care of their families; they can experience more customers’ needs through experiencing families’ needs. Since marital status has only two categories, it can not be examined by multiple comparison LSD method either.
Marital status Variables μ1 Single (n=127) μ2 Married (n=150) F value P value Empathy 3.125 3.409 11.25 0.001*** SHB Moral reasoning 3.966 4.086 2.875 0.091* Risk Tolerance 3.862 3.819 0.416 0.519 Note: * P<0.1; **P<0.05; *** P<0.01
Table 4.5 The ANOVA of the Marriage Status Variable
Table 4.6 shows how different industries affect SHB and risk tolerance. In particular, empathy and moral reasoning have significant difference among these various industries. In multiple comparison, the formula
meansμ2,μ4are significantly higher than μ1,μ3,μ5 , but μ2,μ4,μ6 and μ6,μ 1,μ3,μ5 are approximately the same. From this ANOVA table, finance and agency
salespeople have a higher level of empathy and moral reasoning motivation to help serve customers than salespeople in other industries.
Industry Variables μ1 Life Insurance (n=10) μ2 Finance (n=80) μ3 High Tech (n=14) μ4 Agency (n=10) μ5 Service (n=118) μ6 others (n=45) F value P value Multiple comparison LSD Empathy 2.966 3.445 2.940 3.657 3.185 3.320 2.965 0.013** Note 1 SHB Moral reasoning 4.273 4.182 4.069 4.045 3.934 3.951 2.240 0.05** Note 2
Risk Tolerance 3.879 3.769 4.031 3.695 3.877 3.824 0.852 0.514 No difference Note: * P<0.1; **P<0.05; *** P<0.01
Table 4.6 The ANOVA of the Industry Variable
Educational level also has significant influence on SHB, however each factor has different result. According to the empathy factor, salespeople with a Master degree have less motivation to help serve customers. Salesmen with a Senior High School degree have significantly lower moral reasoning than others; whereas Junior High School graduates have the highest means.
Educational level Variables μ1 under junior high school (n=3) μ2 senior high school (n=101) μ3 university (n=145) μ4 Master (n=24) μ5 Ph.D (n=4) F value P value Multiple comparison LSD SHB Empathy 3.662 3.359 3.297 2.733 3.579 4.449 0.002*** Note 1 Note 1: Note 2:
Moral reasoning 4.541 3.929 4.076 4.164 3.799 2.014 0.093* No difference Risk Tolerance 3.743 3.796 3.853 3.970 3.678 0.613 0.654 No difference Note: * P<0.1; **P<0.05; *** P<0.01
Table 4.7 The ANOVA of the Educational Level Variable
Seniority affects the level of empathy. As expected, experienced salespeople engage in more SHB. Therefore, salespeople who have above 5 years seniority have the highest mean, which is significantly larger than those with less experience.
Seniority Variables μ1 Below 1 year (n=58) μ2 1~2 years (n=38) μ3 2~3 years (n=47) μ4 3~4 years (n=21) μ5 4~5 years (n=17) μ6 Above 5 years (n=96) F value P value Multiple comparison LSD Empathy 3.177 3.247 3.333 3.206 3.013 3.390 1.285 0.270 Note 1 SHB Moral reasoning 4.012 4.152 4.074 4.054 4.031 3.969 0.592 0.706 No difference Risk Tolerance 3.843 3.989 3.786 3.994 3.691 3.794 1.347 0.245 No difference
Table 4.8 The ANOVA of the Seniority Variable
Salespeople’s job positions have impacts on moral reasoning. Although means of μ4 (advisor) are significantly higher than others, the accuracy of this result is questionable due to insufficient samples. On the other hand, employee (μ2) has the lowest mean in risk tolerance.
Note 1:
Job position Variables μ1 Self- employed (n=52) μ2 Employee (n=162) μ3 Manager (n=22) μ4 Advisor (n=4) μ5 Researc her (n=3) μ6 Others (n=34) F value P value Multiple comparis on LSD Empathy 3.240 3.258 3.337 3.225 2.986 3.431 0.496 0.779 No difference SHB Moral reasoning 3.834 4.076 3.920 4.804 4.071 4.093 3.049 0.011** Note 1 Risk Tolerance 3.996 3.786 3.804 3.950 4.000 3.843 1.227 0.296 Note 2 Note: * P<0.1; **P<0.05; *** P<0.01
Table 4.9 The ANOVA of the Job Position Variable
Different segments of age also have impacts on SHB. Between empathy and moral reasoning factors, means of 41~45 years-old group is significantly higher than others. Those under 20 years old salespeople have the lowest mean on both empathy and moral reasoning factors.
Note 1: Note 2:
Age Variables μ1 Under 20 (n=8) μ2 21~25 (n=46) μ3 26~30 (n=63) μ4 31~35 (n=38) μ5 36~40 (n=39) μ6 41~45 (n=36) μ7 46~50 (n=26) μ8 Above51 (n=21) F value P value Multiple comparison LSD Empathy 2.854 2.941 3.187 3.413 3.408 3.505 3.454 3.368 3.362 0.002*** SHB Moral reasoning 3.542 4.076 4.037 3.961 4.133 4.244 4.059 3.640 3.224 0.003*** Risk Tolerance 3.532 3.960 3.864 3.745 3.803 3.963 3.729 3.775 1.321 0.240 Note: * P<0.1; **P<0.05; *** P<0.01
4.3.3 Demographic variables Ⅱ: Monthly salary, Monthly bonus percentage, Past growing experience, Working location, Major customer
Monthly salary has significant influence on moral reasoning factor of SHB, note that the group of monthly income 40001~50000 (μ3) has the lowest impact on this factor. Monthly salary Variables μ1 Less than 30000 (n=85) μ2 30001~ 40000 (n=88) μ3 40001~ 50000 (n=54) μ4 50001~ 60000 (n=24) μ5 More than 60000 (n=26) F value P value Multiple comparison LSD Empathy 3.159 3.281 3.366 3.360 3.409 1.094 0.360 No difference SHB Moral reasoning 4.097 4.068 3.796 4.104 4.113 2.760 0.028**
Risk Tolerance 3.778 3.884 3.767 3.969 3.917 1.092 0.361 No difference
Note: * P<0.1; **P<0.05; *** P<0.01 Table 4.11 The ANOVA of the Monthly Salary Variable
Salespeople who receive above 50% per month bonus (μ6) get the highest mean on moral reasoning factor. While the group who collect a bonus of 11~20% per month can tolerate more risk tolerance than others as table 4.12 shown.
Monthly bonus/salary % Variables μ1 Below 10% (n=133) μ2 11~20 % (n=52) μ3 21~30 % (n=48) μ4 31~40 % (n=20) μ5 41~50 % (n=9) μ6 Above 50% (n=15) F value P value Multiple comparison LSD SHB Empathy 3.288 3.252 3.270 3.377 3.136 3.279 0.243 0.943 No difference
Moral reasoning 4.060 3.977 3.893 4.157 3.972 4.265 1.349 0.244 Note 1 Risk Tolerance 3.817 3.946 3.779 3.923 3.641 3.854 0.863 0.506 No
difference
Table 4.12 The ANOVA of the Monthly Bonus Percentage Variable
Growing history may be a consideration of engaging in Sales Helping Behavior. Always smooth going salespeople get the highest mean on moral reasoning factor. This is an interesting phenomenon because the always tough salespeople have more empathy and, in turn, engage in more Sales Helping Behavior. The always tough salespeople have more empathy to help serve customers. As table 4.13 shows, my assumption is relevant to the fact.
Growing history Variables μ1 Always tough (n=13) μ2 Moderate (n=216) μ3 Always smooth (n=48) F value P value Multiple comparison LSD Empathy 3.539 3.264 3.277 1.072 0.334 No difference SHB Moral reasoning 3.985 3.993 4.214 2.830 0.061*
Risk Tolerance 3.886 3.830 3.867 0.139 0.870 No difference Note: * P<0.1; **P<0.05; *** P<0.01 Table 4.13 The ANOVA of the Past Growing Experience Variable
Different working locations have significant influence on empathy factor. Salespeople living in the south of Taiwan engage in more Sales Helping Behavior than those living in the north. However, salespeople who work south of ChiaYi are more friendly and provided more help for my research. In Taiwan, there is a saying Note 1: